

In this article, Snehasish CHINARA (ESSEC Business School, Grande Ecole Program – Master in Management, 2022-2024) explains the cryptocurrency Tether.
Historical context and background
Tether (USDT) emerged in July 2014 as a groundbreaking cryptocurrency designed to bridge the gap between traditional fiat currencies and the digital realm. Conceived by Brock Pierce, Craig Sellars, and Reeve Collins, Tether aimed to offer a stable alternative to the price volatility commonly associated with other cryptocurrencies like Bitcoin. Functioning as a stablecoin, Tether is pegged to the value of a fiat currency, primarily the US Dollar, maintaining a 1:1 ratio. This pegging mechanism provides a degree of price stability, making Tether an attractive option for traders and investors seeking to mitigate the risks inherent in the crypto market. Since its inception, Tether has grown to become one of the most widely used cryptocurrencies, playing a pivotal role in facilitating liquidity and serving as a gateway for funds within the broader digital asset ecosystem. Despite its popularity, Tether has faced scrutiny regarding its transparency and reserve backing, adding layers of complexity to its intriguing history within the crypto landscape.
Tether Logo
Source: Yahoo! Finance
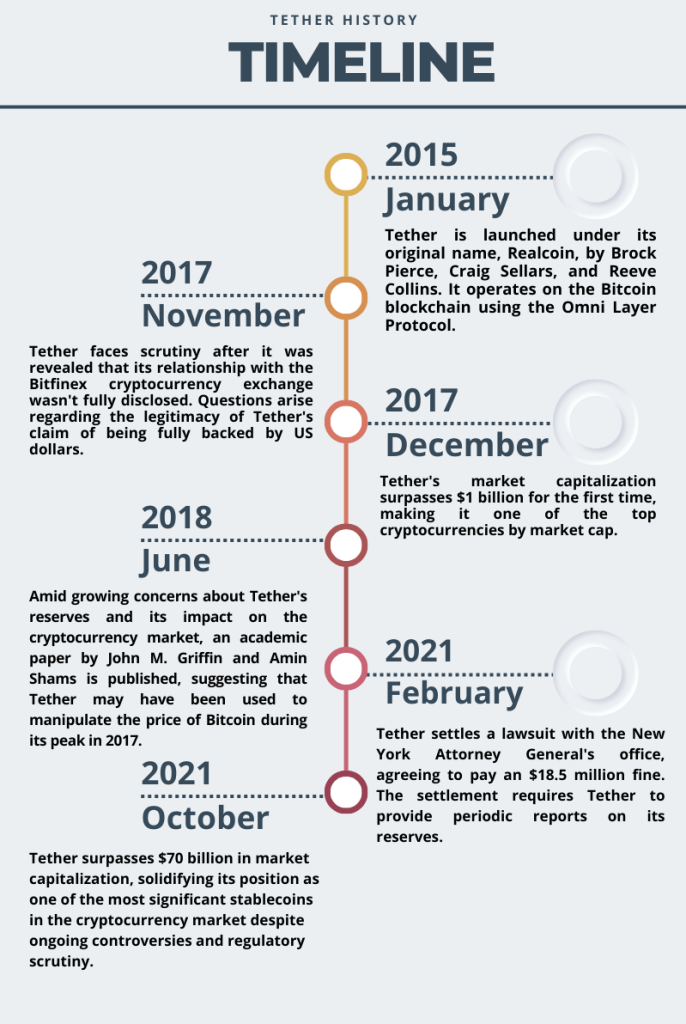
Figure 1. Key Dates in Tether History
Source: Yahoo! Finance
Key features
- Stability: Tether is designed to maintain a 1:1 peg with a fiat currency, typically the US Dollar. This pegging mechanism provides stability in value, reducing the volatility commonly associated with other cryptocurrencies.
- Widespread Adoption: Tether is widely adopted across various cryptocurrency exchanges and platforms. Its broad acceptance makes it a popular choice for traders and investors.
- Liquidity Provider: Tether serves as a crucial source of liquidity within the cryptocurrency market. Traders often use USDT as a safe haven during times of market turbulence.
- Fast Transactions: Tether transactions are conducted on blockchain networks like Ethereum and Tron, enabling fast and efficient cross-border transactions compared to traditional banking systems.
- Global Accessibility: Tether provides a borderless financial solution, allowing users to send and receive funds globally without the need for traditional banking intermediaries.
- Smart Contract Compatibility: Tether is compatible with blockchain-based smart contracts, enabling developers to integrate it into decentralized applications (DApps) for various financial services.
Use cases
- Trading Pairs: Tether is extensively used as a trading pair on cryptocurrency exchanges. It allows traders to quickly move in and out of positions while avoiding the market volatility associated with other digital assets.
- Hedging: Investors often use Tether as a hedging tool to safeguard their portfolios against market fluctuations. By converting their holdings to USDT during uncertain times, investors can protect their capital.
- Remittances: Tether facilitates cross-border remittances, offering a faster and potentially more cost-effective alternative to traditional money transfer services.
- Stable Value Storage: Tether serves as a stable store of value, allowing users to preserve their wealth in a cryptocurrency that is less prone to price fluctuations compared to other volatile digital assets.
- Decentralized Finance (DeFi): Tether is a common stablecoin used in decentralized finance protocols for lending, borrowing, and yield farming activities within the growing DeFi ecosystem.
- Tokenized Assets: Tether is utilized to represent traditional assets in tokenized form on blockchain platforms, enabling fractional ownership and increased liquidity for real-world assets.
Controversy
While Tether has gained popularity for its stability and utility, it has also faced criticism and regulatory scrutiny, particularly regarding its reserve backing and transparency. The paper “Is Bitcoin Really Untethered?”, analyses Tether’s controversies revealing that the significant growth of Tether, the largest pegged cryptocurrency, may not solely be driven by organic investor demand but also by a scheme to artificially inflate cryptocurrency prices. By analyzing the blockchains of Bitcoin and Tether, the researchers found evidence suggesting that a major player on Bitfinex utilizes Tether to purchase large amounts of Bitcoin during price downturns, effectively supporting Bitcoin prices. This intervention is particularly pronounced near round-number price thresholds, indicating a strategic approach to price support. The data also suggests that Tether issuance correlates with a month-end need for dollar reserves, implying partial reserve backing. Overall, these findings lend support to the hypothesis that Tether’s growth is supply-driven and potentially manipulative.
Furthermore, the paper highlights the broader implications of these findings, suggesting that price manipulation in cryptocurrencies can have significant distortive effects beyond standard supply-and-demand dynamics. It highlights the need for external surveillance, monitoring, and regulatory frameworks in the cryptocurrency space, challenging the notion that innovative technologies alone can bypass the need for traditional oversight. The conclusion suggests that while cryptocurrencies offer new possibilities for financial innovation, they are not immune to the risks associated with dubious activities and speculative bubbles, which could ultimately lead to further price distortions and negative impacts on the market.
Technology and underlying blockchain
Tether (USDT), a the stablecoin, utilizes blockchain technology across various networks to provide a digital asset pegged to traditional fiat currencies. The Ethereum-based ERC-20 version is the most prevalent, benefiting from Ethereum’s widespread adoption and smart contract capabilities, making it a cornerstone for decentralized exchanges and DeFi applications. Tether also operates on the Tron blockchain (TRC-20), offering faster transactions and reduced fees, particularly appealing for high-frequency trading. Acknowledging the demand for scalability and cost-effectiveness, Tether has expanded to alternative blockchains like Binance Smart Chain and Solana. These adaptations highlight Tether’s commitment to meeting diverse market needs. Managed by Tether Limited, the stablecoin asserts stability through regular audits and claims of holding equivalent fiat reserves, although controversies have arisen regarding transparency. The dynamic interplay of Tether across various blockchains underscores its pivotal role in the evolving landscape of digital finance.
Supply of coins
The market supply of Tether (USDT), a leading stablecoin, plays a crucial role in the broader cryptocurrency ecosystem. Tether’s supply dynamics are intrinsically linked to its unique issuance mechanism. Tether Limited, the company behind USDT, mints new tokens by receiving equivalent amounts of fiat currency, primarily the US Dollar, in its reserves. This issuance process is supposed to ensure a 1:1 peg between USDT and the underlying fiat currency, promoting price stability.
The market supply of Tether expands as demand for the stablecoin increases. Traders and investors often turn to USDT as a safe haven during times of high volatility, effectively increasing the circulating supply. This heightened demand results in additional Tether being issued to maintain the peg, thus influencing the overall supply in the market.
Monitoring Tether’s supply is of particular interest due to its significant impact on liquidity within the cryptocurrency space. An influx of USDT into the market provides traders with a reliable means to navigate price fluctuations without fully exiting the crypto market, enhancing liquidity and potentially mitigating market volatility.
Historical data for Tether
How to get the data?
The Tether is popular cryptocurrency on the market, and historical data for the Tether such as prices and volume traded can be easily downloaded from the internet sources such as Yahoo! Finance, Blockchain.com & CoinMarketCap. For example, you can download data for Tether on Yahoo! Finance (the Yahoo! code for Tether is USDT-USD).
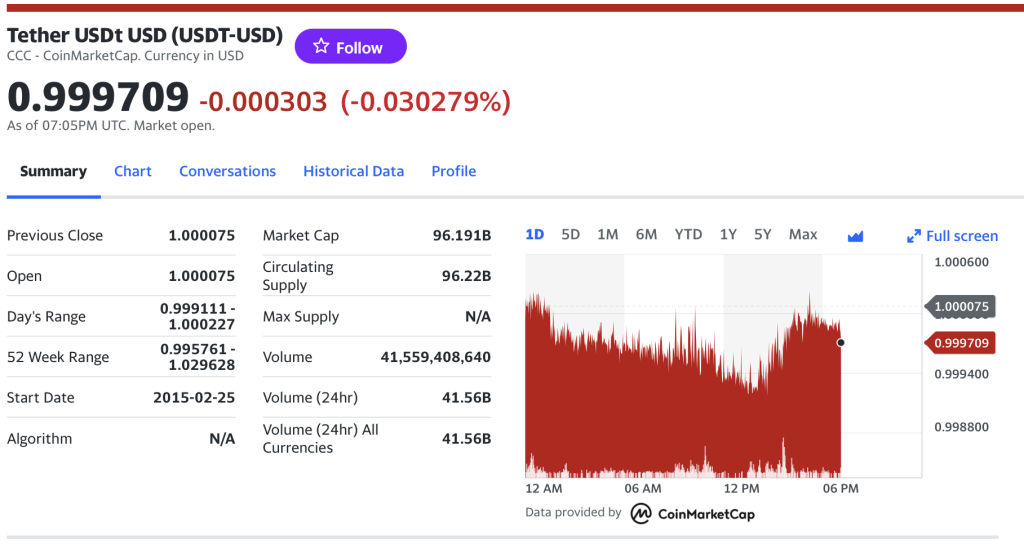
Figure 1. Tether data
Source: Yahoo! Finance.
Historical data for the Tether market prices
Exploring the historical market price of Tether (USDT) unveils a wealth of insights into the cryptocurrency’s role and its impact on the broader market. The stability of Tether, designed to maintain a 1:1 peg with traditional fiat currencies, is reflected in its price history. Observing deviations from this peg over time provides a gauge of Tether’s effectiveness as a stablecoin. Moreover, fluctuations in Tether’s historical price serve as a barometer for market sentiment, indicating periods of increased demand for stability during cryptocurrency market volatility. Tether’s price movements also offer a lens into liquidity trends, showcasing its role in various financial activities within the crypto ecosystem. Crucially, analyzing Tether’s historical price can illuminate market responses to controversies, regulatory developments, and its correlation with other major cryptocurrencies. Understanding these dynamics is essential for investors and traders seeking to navigate the intricate landscape of digital assets and stablecoins.
Figure 2 below represents the evolution of the price of Tether in US dollar over the period Nov 2017 – Dec 2023. The price corresponds to the “closing” price (observed at 10:00 PM CET at the end of the month).
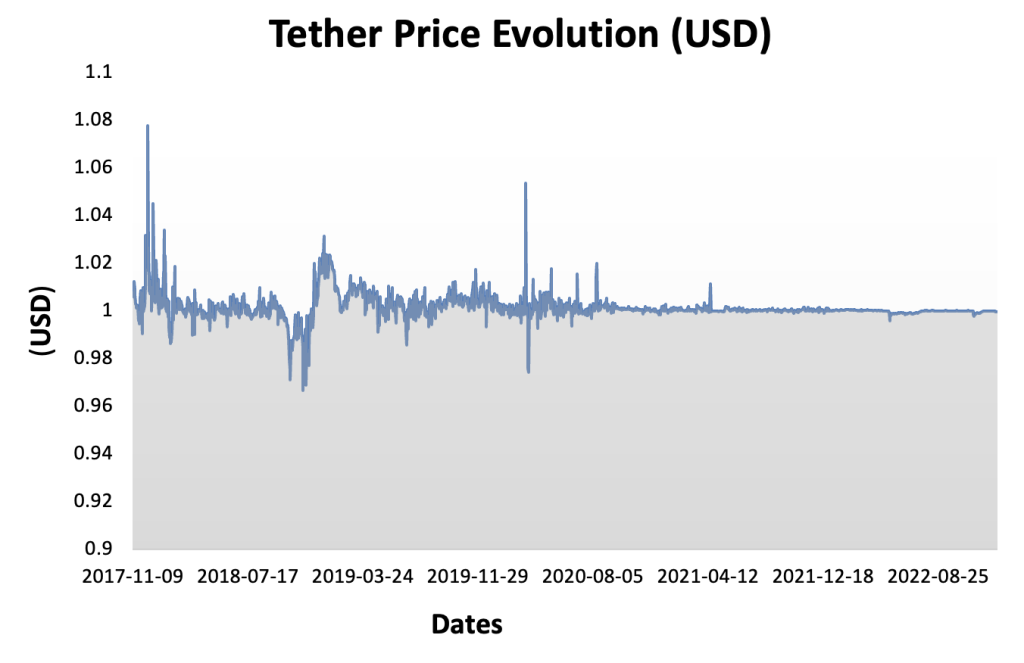
Figure 2. Evolution of the Tether price
Source: Yahoo! Finance.
R program
The R program below written by Shengyu ZHENG allows you to download the data from Yahoo! Finance website and to compute summary statistics and risk measures about the Ethereum.

Data file
The R program that you can download above allows you to download the data for the Ethereum from the Yahoo! Finance website. The database starts on December, 2017.
Table 1 below represents the top of the data file for the Ethereum downloaded from the Yahoo! Finance website with the R program.
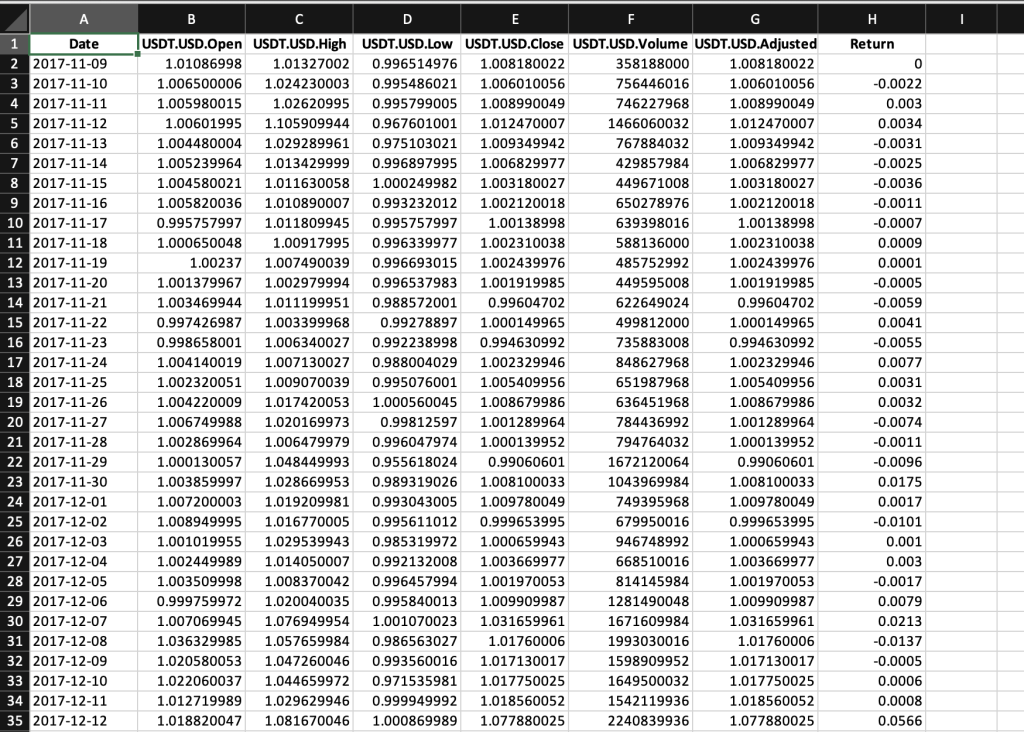
Table 1. Top of the data file for the Tether
Source: computation by the author (data: Yahoo! Finance website).
Python code
You can download the Python code used to download the data from Yahoo! Finance.

Python script to download Ethereum historical data and save it to an Excel sheet::
import yfinance as yf
import pandas as pd
# Define the ticker symbol for Tether
eth_ticker = “USDT-USD”
# Define the date range for historical data
start_date = “2020-01-01”
end_date = “2022-01-01”
# Download historical data using yfinance
usdt_data = yf.download(eth_ticker, start=start_date, end=end_date)
# Create a Pandas DataFrame from the downloaded data
usdt_df = pd.DataFrame(usdt_data)
# Define the Excel file path
excel_file_path = “tether_historical_data.xlsx”
# Save the data to an Excel sheet
usdt_df.to_excel(excel_file_path, sheet_name=”USDT Historical Data”)
print(f”Data saved to {excel_file_path}”)
# Make sure you have the required libraries installed and adjust the “start_date” and “end_date” variables to the desired date range for the historical data you want to download.
Evolution of the Tether
Figure 3 below gives the evolution of the Tether on a daily basis.
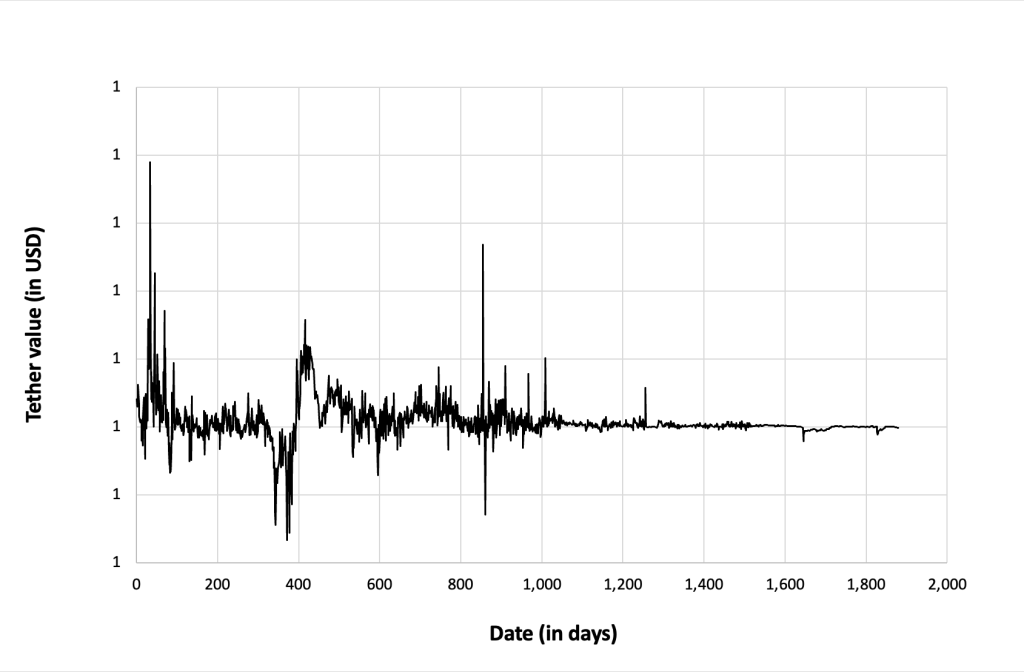
Figure 3. Evolution of the Tether.
Source: computation by the author (data: Yahoo! Finance website).
Figure 4 below gives the evolution of the Tether returns from November 09, 2017 to December 31, 2022 on a daily basis.
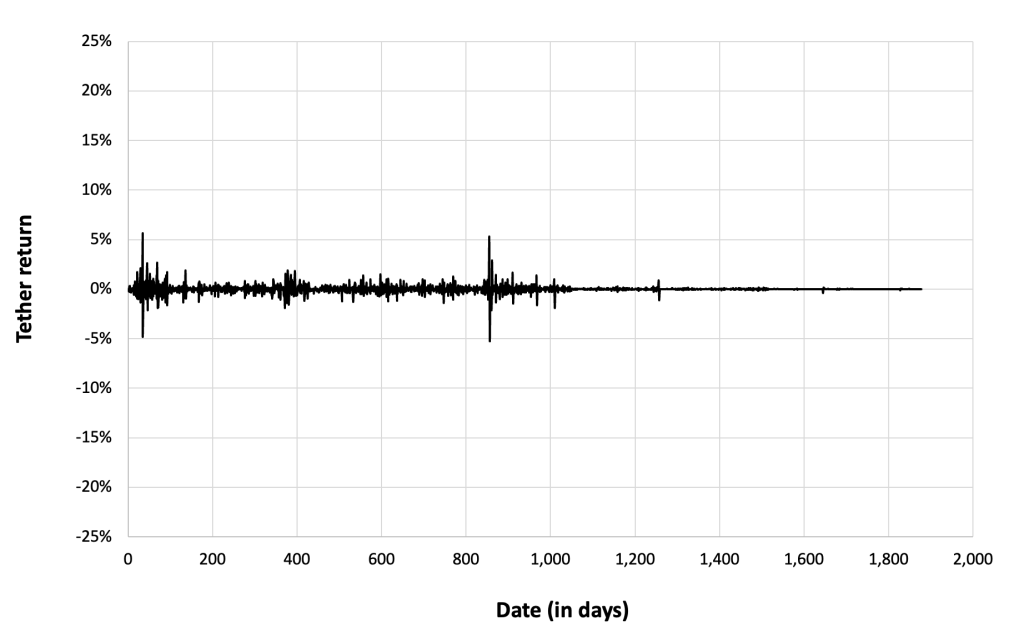
Figure 4. Evolution of the Tether returns.
Source: computation by the author (data: Yahoo! Finance website).
Summary statistics for the Ethereum
The R program that you can download above also allows you to compute summary statistics about the returns of the Tether.
Table 4 below presents the following summary statistics estimated for the Ethereum:
- The mean
- The standard deviation (the squared root of the variance)
- The skewness
- The kurtosis.
The mean, the standard deviation / variance, the skewness, and the kurtosis refer to the first, second, third and fourth moments of statistical distribution of returns respectively.
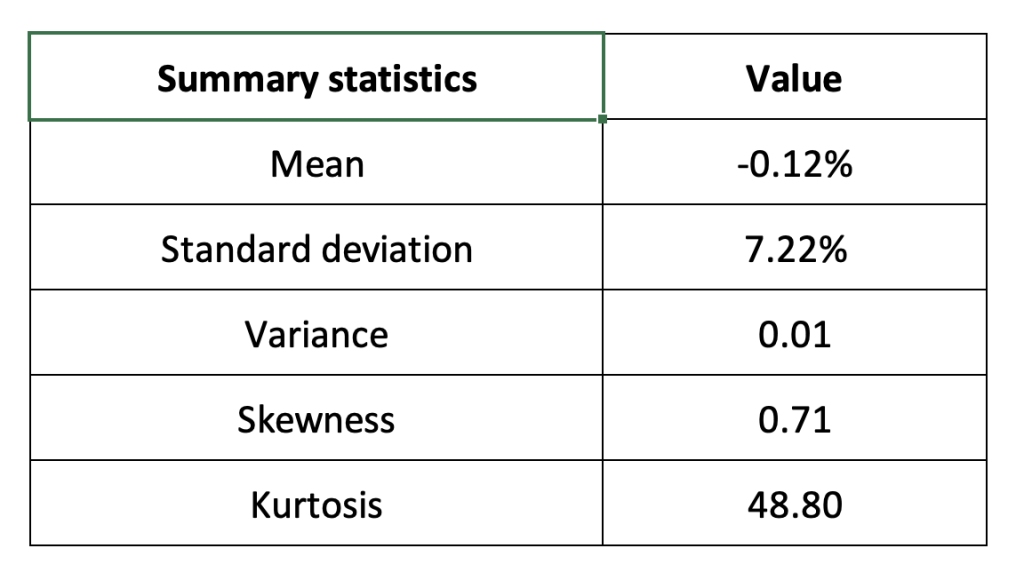
Table 2. Summary statistics for Tether.
Source: computation by the author (data: Yahoo! Finance website).
Statistical distribution of the Tether returns
Historical distribution
Figure 5 represents the historical distribution of the Tether daily returns for the period from November 09, 2017 to December 31, 2022.
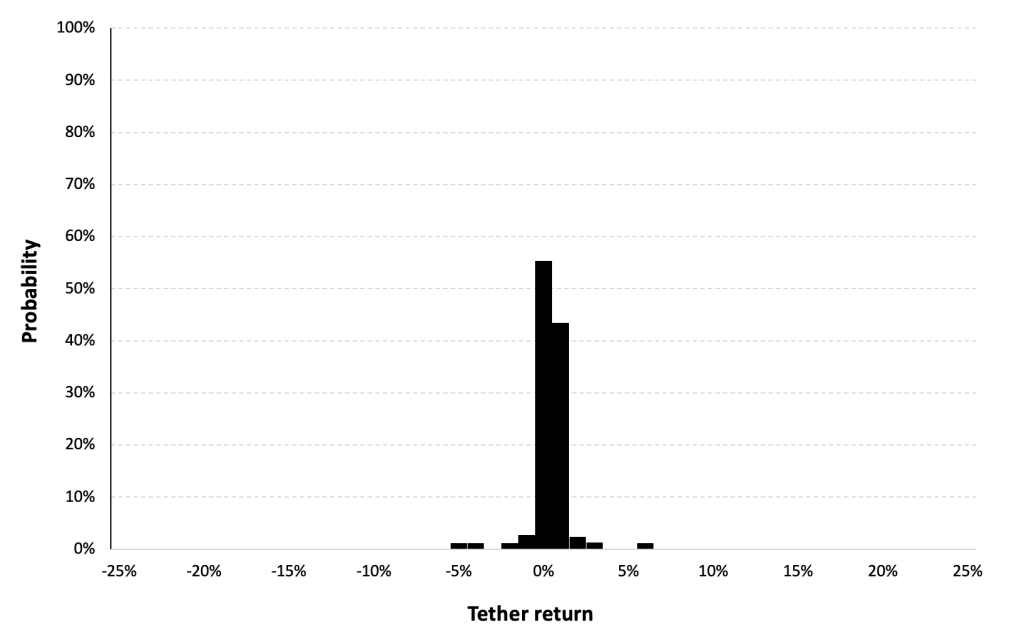
Figure 5. Historical Tether distribution of the returns.
Source: computation by the author (data: Yahoo! Finance website).
Gaussian distribution
The Gaussian distribution (also called the normal distribution) is a parametric distribution with two parameters: the mean and the standard deviation of returns. We estimated these two parameters over the period from November 09, 2017 to December 31, 2022.
Figure 6 below represents the Gaussian distribution of the Tether daily returns with parameters estimated over the period from November 09, 2017 to December 31, 2022.
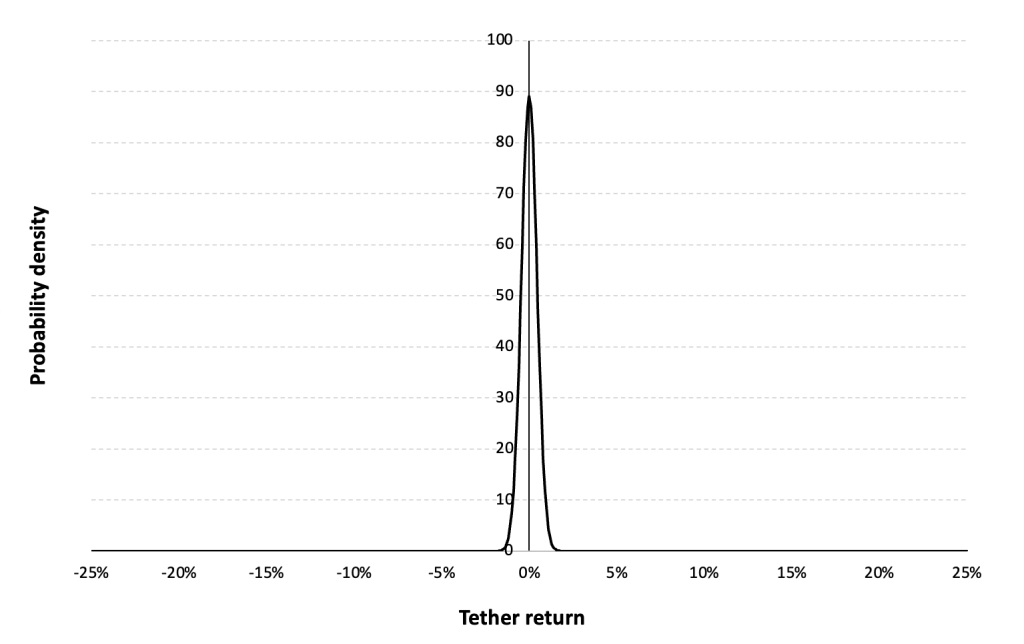
Figure 6. Gaussian distribution of the Tether returns.
Source: computation by the author (data: Yahoo! Finance website).
Risk measures of the Tether returns
The R program that you can download above also allows you to compute risk measures about the returns of the tether.
Table 3 below presents the following risk measures estimated for the Ethereum:
- The long-term volatility (the unconditional standard deviation estimated over the entire period)
- The short-term volatility (the standard deviation estimated over the last three months)
- The Value at Risk (VaR) for the left tail (the 5% quantile of the historical distribution)
- The Value at Risk (VaR) for the right tail (the 95% quantile of the historical distribution)
- The Expected Shortfall (ES) for the left tail (the average loss over the 5% quantile of the historical distribution)
- The Expected Shortfall (ES) for the right tail (the average loss over the 95% quantile of the historical distribution)
- The Stress Value (SV) for the left tail (the 1% quantile of the tail distribution estimated with a Generalized Pareto distribution)
- The Stress Value (SV) for the right tail (the 99% quantile of the tail distribution estimated with a Generalized Pareto distribution)
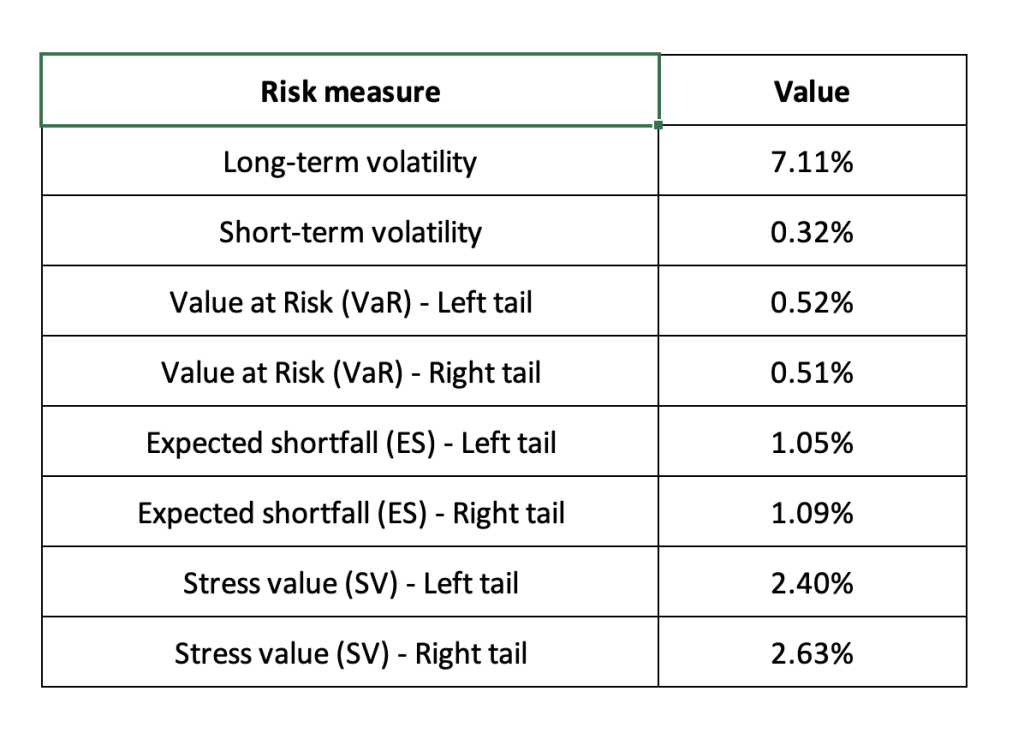
Table 5. Risk measures for the Tether.
Source: computation by the author (data: Yahoo! Finance website).
The volatility is a global measure of risk as it considers all the returns. The Value at Risk (VaR), Expected Shortfall (ES) and Stress Value (SV) are local measures of risk as they focus on the tails of the distribution. The study of the left tail is relevant for an investor holding a long position in the XRP while the study of the right tail is relevant for an investor holding a short position in the XRP.
Why should I be interested in this post?
Tether is a compelling subject for students, especially those in finance, economics, business, and technology. Ripple’s focus on revolutionizing cross-border transactions and its unique blockchain technology offer insights into innovations in financial technology. Exploring Tether provides a deeper understanding of blockchain, cryptocurrency markets, stable coins, regulatory challenges, and the practical applications of decentralized systems. Students can gain valuable knowledge about market dynamics, investment opportunities, and the intersection of technology and finance by delving into the complexities of Tether and its impact on the financial industry.
Related posts on the SimTrade blog
About cryptocurrencies
▶ Snehasish CHINARA Bitcoin: the mother of all cryptocurrencies
▶ Snehasish CHINARA How to get crypto data
▶ Alexandre VERLET Cryptocurrencies
▶ Youssef EL QAMCAOUIDecentralised Financing
▶ Hugo MEYERThe regulation of cryptocurrencies: what are we talking about?
▶ JOHN M. GRIFFIN, AMIN SHAMS Is Bitcoin Really Untethered?
About statistics
▶ Shengyu ZHENG Moments de la distribution
▶ Shengyu ZHENG Mesures de risques
▶ Jayati WALIA Returns
Useful resources
Academic research about risk
Longin F. (2000) From VaR to stress testing: the extreme value approach Journal of Banking and Finance, N°24, pp 1097-1130.
Longin F. (2016) Extreme events in finance: a handbook of extreme value theory and its applications Wiley Editions.
Data
Yahoo! Finance Historical data for Tether
CoinMarketCap Historical data for Tether
About the author
The article was written in January 2024 by Snehasish CHINARA (ESSEC Business School, Grande Ecole Program – Master in Management, 2022-2024).