History of Options Markets

History of the options markets

Akshit Gupta

This article written by Akshit GUPTA (ESSEC Business School, Grande Ecole Program – Master in Management, 2019-2022) presents an introduction to the History of the Options markets.

Introduction

Options are a type of derivative contracts which give the buyer the right, but not the obligation, to buy or sell an underlying security at a pre-determined price and date. These contracts can either be traded over-the-counter (OTC) through dealer or broker network or can be traded over an exchange in a standardized form.

A brief history

The history of the use of options can be dated back to ancient times. In early 4th century BC, a philosopher, and an astronomer, named Thales of Miletus calculated a surplus olive harvest in his region during the period. He predicted an increase in demand for the olive presses due to an increase in the harvest. To benefit from his prediction, he bought the rights to use the olive presses in his region by paying a certain sum. The olive harvest saw a significant surplus that year and the demand for olive presses rose, as predicted by him. He then exercised his option and sold the rights to use the olive presses at a much higher prices than what he actually paid, making a good profit. This is the first documented account of the use of option contracts dating back to 4th century BC.

The use of option contracts was also seen during the Tulip mania of 1636. The tulip producers used to sell call options to the investors when the tulip bulbs were planted. The investors had the right to buy the tulips, when they were ready for harvest, at a price pre-determined while buying the call option. However, since the markets were highly unstandardized, the producers could default on their obligations.
But the event laid a strong foundation for the use of option contracts in the future.

Until 1970s, option contracts were traded over-the-counter (OTC) between investors. However, these contracts were highly unstandardized leading to investor distrust and illiquidity in the market.

In 1973, the Chicago Board Options Exchange (CBOE)) was formed in USA, laying the first standardized foundation in options trading. In 1975, the Options clearing corporation (OCC) was formed to act as a central clearing house for all the option contracts that were traded on the exchange. With the introduction of these 2 important bodies, the option trading became highly standardized and general public gained access to it. However, the Put options were introduced only in 1977 by CBOE. Prior to that, only Call options were traded on the exchange.

With the advent of time, options market grew significantly with more exchanges opening up across the world. The option pricing models, and risk management strategies also became more sophisticated and complex.

Market participants

The participants in the options markets can be broadly classified into following groups:

  • Market makers: A market maker is a market participant in the financial markets that simultaneously buys and sells quantities of any option contract by posting limit orders. The market maker posts limit orders in the market and profits from the bid-ask spread, which is the difference by which the ask price exceeds the bid price. They play a significant role in the market by providing liquidity.
  • Margin traders: Margin traders are market participants who make use of the leverage factor to invest in the options markets and increase their position size to earn significant profits. But this trading style is highly speculative and can also lead to high losses due to the leverage effect.
  • Hedgers: Investors who try to reduce their exposure in the financial markets by using hedging strategies are called hedgers. Hedgers often trades in derivative products to offset their risk exposure in the underlying assets. For example, a hedger who is bearish about the market and has shares of Apple, will buy a Put option on the shares of Apple. Thus, he has the right to sell the shares at a high price if the market price for apple shares goes down.
  • Speculators: Speculative investors are involved in option trading to take advantage of market movements. They usually speculative on the price of an underlying asset and account for a significant share in option trading.

Types of option contracts

The option contracts can be broadly classified into two main categories, namely:

Call options

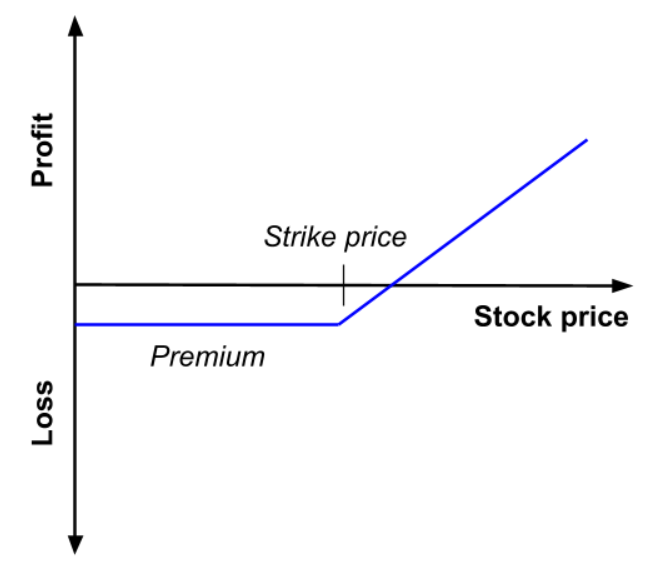
A call option is a derivative contract which gives the holder of the option the right, but not an obligation, to buy an underlying asset at a pre-determined price on a certain date. An investor buys a call option when he believes that the price of the underlying asset will increase in value in the future. The price at which the options trade in an exchange is called an option premium and the date on which an option contract expires is called the expiration date or the maturity date.

For example, an investor buys a call option on Apple shares which expires in 1 month and the strike price is $90. The current apple share price is $100. If after 1 month,
The share price of Apple is $110, the investor exercises his rights and buys the Apple shares from the call option seller at $90.

But, if the share prices for Apple falls to $80, the investor doesn’t exercise his right and the option expires because the investor can buy the Apple shares from the open market at $80.

Put options

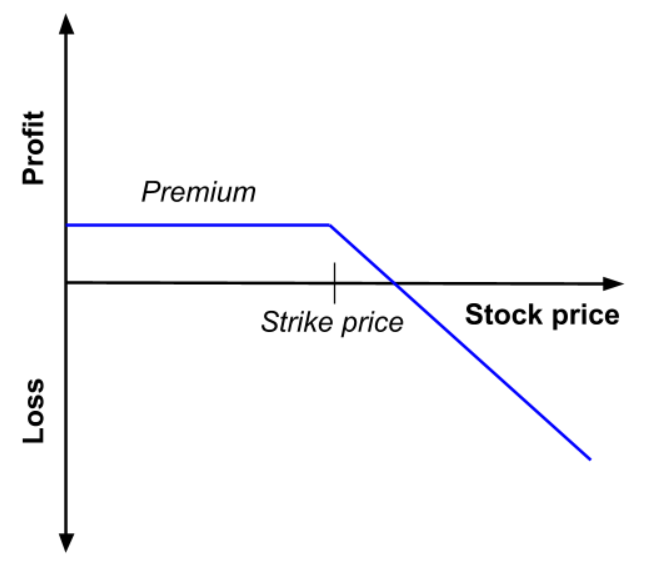
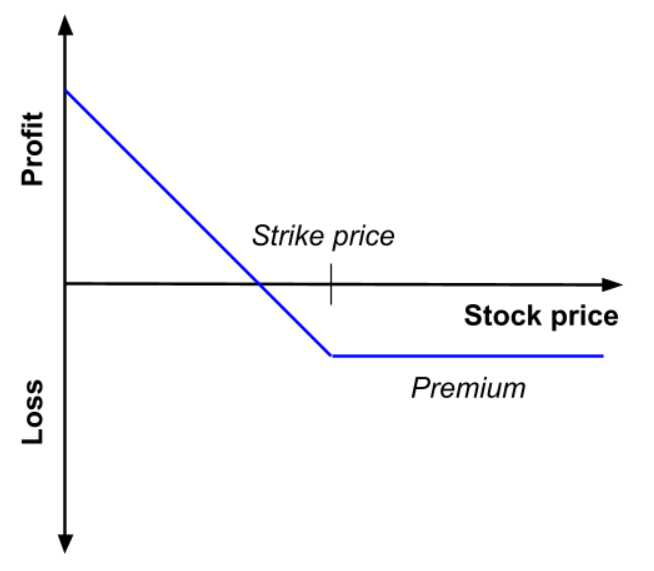
A put option is a derivative contract which gives the holder of the option the right, but not an obligation, to sell an underlying asset at a pre-determined price on a certain date. An investor buys a put option when he believes that the price of the underlying asset will decrease in value in the future.

For example, an investor buys a put option on Apple shares which expires in 1 month and the strike price is $110. The current apple share price is $100. If after 1 month,

The share price of Apple is $90, the investor exercises his rights and sell the Apple shares to the put option seller at $110.

But, if the share prices for Apple rises to $120, the investor doesn’t exercise his right and the option expires because the investor can sell the Apple shares in the open market at $120.

Different style of options

The option style doesn’t deal with the geographical location of where they are traded. However, the contracts differ in terms of their expiration time when they can be exercised. The option contracts can be categorized as per different styles they come in. Some of the most common styles of option contracts are:

American options

American style options give the option buyer the right to exercise his option any time prior or up to the expiration date of the contract. These options provide greater flexibility to the option buyer but also comes at a high price as compared to the European style options.

European options

European style options can only be exercised on the expiration or maturity date of the contract. Thus, they offer less flexibility to the option buyer in terms of his rights. However, the European options are cheaper as compared to the American options.

Bermuda options

Bermuda options are a mix of both American and European style options. These options can only be exercised on a specific pre-determined dates up to the expiration date. They are considered to be exotic option contracts and provide limited flexibility to the option buyer to exercise his claim.

Related posts on the SimTrade blog

   ▶ All posts about options

   ▶ Akshit GUPTA Analysis of the Rogue Trader movie

   ▶ Akshit GUPTA Market maker – Job description

   ▶ Akshit GUPTA Tulip mania of 1636

Useful Resources

Chapter 10 – Mechanics of options markets, pg. 235-240, Options, Futures, and Other Derivatives by John C. Hull, Ninth Edition

Wikipedia Options (Finance)

The Street A Brief History of Stock Options

About the author

Article written in June 2021 by Akshit GUPTA (ESSEC Business School, Grande Ecole Program – Master in Management, 2019-2022).

My internship experience at Deloitte

My Internship Experience at Deloitte

Anant Jain

In this article, Anant JAIN (ESSEC Business School, Grande Ecole Program – Master in Management, 2019-2022) shares his experience as a strategist intern with Deloitte, and talks about the functioning of Deloitte and Robotics Process Automation (RPA).

About Deloitte

Founded in 1845, Deloitte is one of the biggest professional service providers in the world. Being one of the “Big Four” accounting firm, it provides services in audit & assurance, consulting, financial advisory, risk advisory, tax and legal advisory. A key aspect about Deloitte is that it does not sell any products but rather services. Hence, it’s crucial for Deloitte to find the right mix of people to be hired for the job as explained below. Moreover, Deloitte likes to focus on automation of its processes because it increases the human productivity by removing repetitive tasks and allows its employees to focus more on crucial and important tasks. It doesn’t decrease the human input but in fact, increases the human output.

The working process

The working process for a new mission for a client is decomposed in three steps.

Step 1: The engagement letter

When is a new client comes onboard, the first step is to sign the engagement letter which defines the scope of the project, the estimated input and billable hours for the project and its breakup, and finally the price quotation to the client. This is always followed by a negotiation between the client and Deloitte and upon mutual agreement, the engagement letter gets signed.

Step 2: On-boarding

When the client gets “onboarded” with Deloitte then Deloitte’s employees who will be working with that particular client also get onboarded with the client’s firm. For example, if Coca-Cola is a client at Deloitte, then the employees at Deloitte working with Coca-Cola will also have to get onboarded with Coca-Cola’s employee platform .

Step 3: The plan and delegation

The next step is to do a thorough analysis of the project and the problems, the target areas, the areas requiring more efficiency, etc. This is usually followed by a thorough plan formulated by a Director or Senior Manager of Deloitte. The plan is then passed on to the Associates and Analysts with their designated tasks for the project with deliverables to be achieved and deadlines to be met.

The Organizational Hierarchy at Deloitte

The hierarchy of Deloitte is quite simple with titles and levels. In an ascending order, it is given by:

  • Analyst (I-III)
  • Analyst IV / Associate Consultant
  • Consultant (I-II)
  • Consultant (III-IV) / Assistant Manager
  • Manager (I-II)
  • Senior Manager (I-II)
  • Director
  • Partner

To reach a position as a Manager or above, it is important to show your business potential to get clients for the firm. Therefore, it important for a person, aiming to reach that level, to have a good network and communications skills.

Work Ethics & Environment

As a Deloitte employee, you have to restructure your schedule according to your client’s requirement especially if the client works at a different time zone (although it is extremely rare to be assigned a client with a huge time-zone difference). It is also important to realize that an employee essentially works at two firms, one being his/her employer, Deloitte, and the second being the Client’s firm. Hence, it is important for an employee to not only work with the Client but constantly update his/her progress at Deloitte. The work has to be extremely presentable to the client because the data and numbers can become very complex and difficult for a client to understand during a presentation. Therefore, it becomes important to make sure that your work is presentable and readable. The work has to be very categorical and detailed.

The working environment is quite pleasant. There are multiple team-building events and activities with various offsites, conducted throughout the year to integrate the employees more. At the same time, your supervisors and co-workers are really helpful. Even though initially one can find the environment quite fast paced and overwhelming, one can get a hang after a short period of time.

Despite the tough schedule and huge amount of workload, it is actually quite rewarding because understanding different clients’ businesses and operations make you more equipped and knowledgeable and thus adds value to your profile.

What is Robotics Process Automation (RPA)?

Robotics Process Automation (RPA) is the utilization of artificial intelligence (AI) to transform and digitize business processes. In this new era of AI, more and more organizations are on the process of completely digitizing and automating every department in their organization and RPA serves as a base for it essentially. RPA is a software which uses robots that can emulate the digital desktop work that people do. RPA is governed by business logic and structure inputs. But it does not mean that they are physical robots, they are just a digital software used to carry out functions which are monotonous, repetitive and one tone in nature. RPA can be utilized in a wide range of daily cases such as the “copy paste” activities, which can be automated using RPA for actions such as copying items from a mail to an Excel sheet, filling out forms, etc. It uses computer software robots called ‘bots’ to carry out these tasks. RPA eliminates more and more mundane admin work and handles it well and in full in compliance. This enables an organization to achieve greater efficiency by streamlining processes and improving accuracy. It also enables humans/employees to focus more on work that requires judgement, creativity, and interpersonal skills.

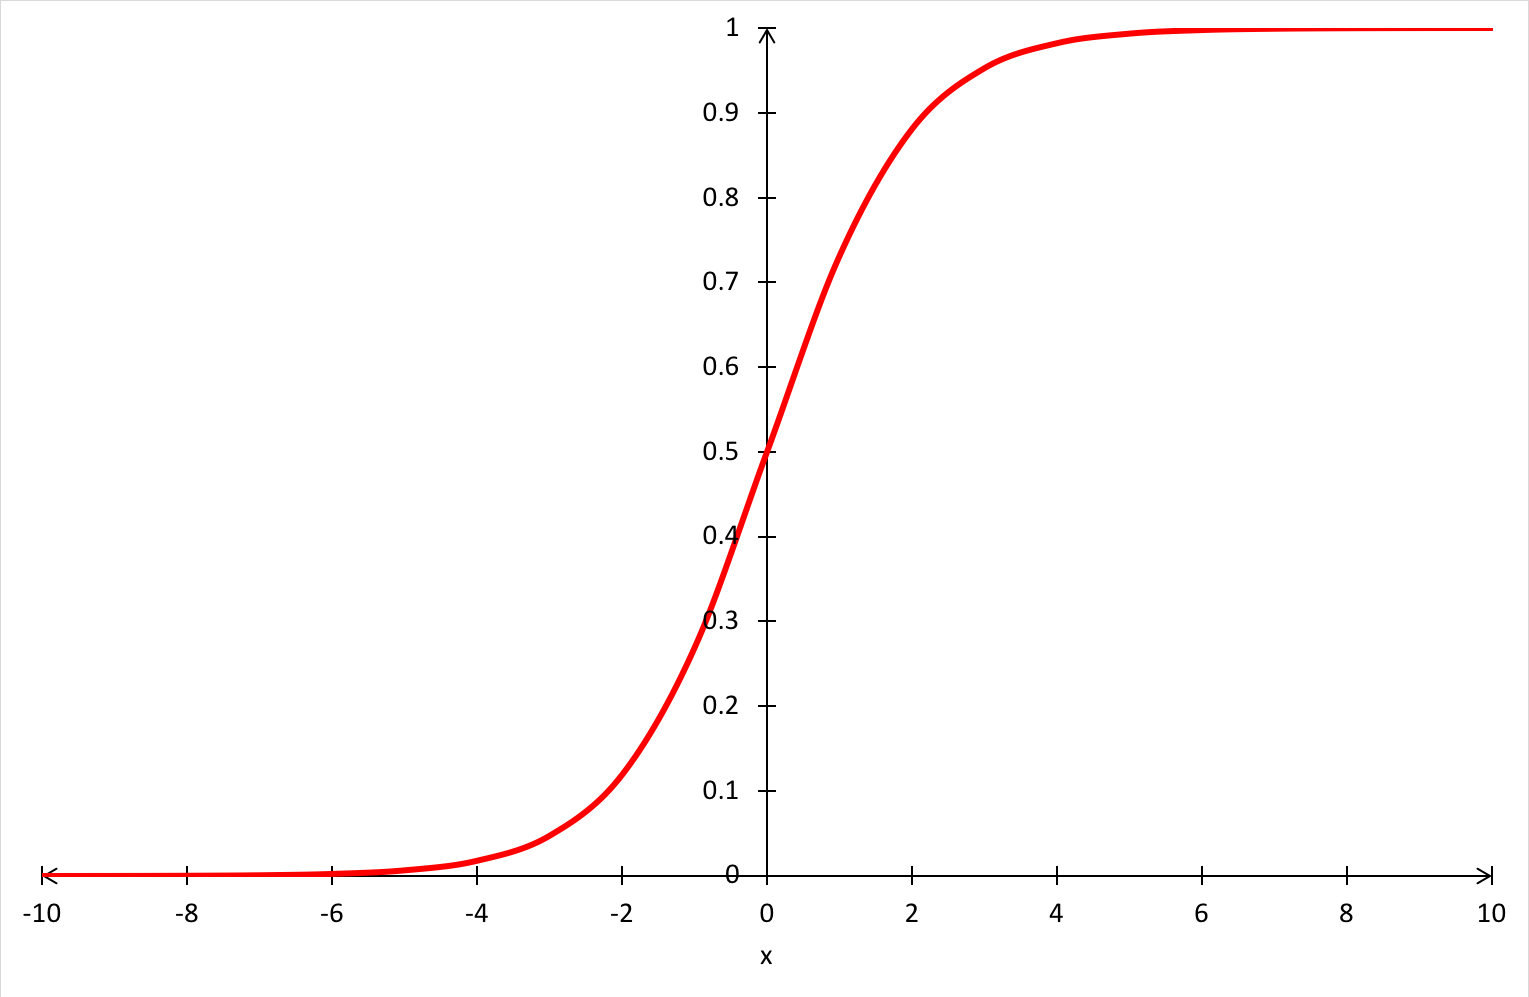
Robotic process automation uses a logit/probit regression as one of its bases to achieve its function of handling mundane and repetitive tasks. Logit/probit regression is a binary regression model in which the dependent variable (DV) takes the value of 0 or 1. In practice, it is used for answering tasks that have only two outputs: “yes” (1 in the model) or “no” (0). The diagram below explains how RPA functions and how it uses logit/probit in the process. The diagram shows how RPA assesses a mail and enters any relevant information in an Excel sheet and sends it to the employee related to it. The bot (robots called in RPA processes as already mentioned) reads an email sent to the employee, opens the Excel file attached to the email, and enters data from the Excel file into an Enterprise Resource Planning (ERP) platform. When this happens, the bot enters the information in the Excel file, then looks for any possibility of the matter being escalated or not (to be defined). If escalation is required, then the bot sends a notification to the employee for analysis which eventually ends the task. If escalation is not required, then the bot automatically ends the task.

Figure 1. RPA Working Process
RPA Working Process
Source: Krify

My Experience at Deloitte

As a student pursuing his graduation in Economics, landing an internship at Deloitte was really surreal. I was always inclined towards consultancy and getting a first-hand experience really helped me be more certain about my hunch. I worked as a trainee in the Strategy & Operations Department in New Delhi. During my short six-week internship, I was primarily required to execute individual analysis of RPA and its applicability in Accounts Payable Processes. It was quite an interesting individual project to understand how the digitization of organizations are executed and the capacity to which processes and tasks can be automated using AI. The internship was an eye opener about the effort and handwork required to make as a consultant in one of the “Big Four” companies.

What I learnt during my internship

The three main things I learnt during my internship at Deloitte are as follows:

  • I gained information about the structure and working environment at Deloitte.
  • I learnt about digital transformation, particularly Robotics Process Automation.
  • I acquired an insight about the soft and hard skills required to make as an intern at Deloitte.

Related posts in the SimTrade blog

Looking for an internship? Looking for a job? You may find useful information by reading other posts where students share their professional experience:

All posts about Professional experiences

▶ Suyue MA Expeditionary experience in a Chinese investment banking boutique

▶ Raphaël ROERO DE CORTANZE
In the shoes of a Corporate M&A Analyst

▶ Youssef LOURAOUI My experience as a portfolio manager in a central bank

▶ Alexandre VERLET Classic brain teasers from real-life interviews

About the author

The article was written in June 2021 by Anant JAIN (ESSEC Business School, Grande Ecole Program – Master in Management, 2019-2022).

Government debt

Government debt

Rodolphe Chollat-Namy

In this article, Rodolphe CHOLLAT-NAMY (ESSEC Business School, i>Grande Ecole – Master in Management, 2019-2023) introduces you to government debt.

A government debt is a debt issued and guaranteed by a government. It is then owed in the form of bonds bought by investors (institutional investors, individual investors, other governments, etc.).

According to the OECD: “Debt is calculated as the sum of the following liability categories (as applicable): currency and deposits; debt securities, loans; insurance, pensions and standardized guarantee schemes, and other accounts payable.”

Before the Covid-19 crisis, the government debt of all countries in the world was estimated at $53 trillion. According to the IMF, it is expected to rise from 83% to 96% of world GDP as a result of the crisis.

In order to better understand debt, it is necessary to go back to several points. How does a government issue debt? Who holds government debt? How is government debt measured?

How does a government issue debt?

There are two principal ways to issue bonds: syndication and auction.

Syndication

Syndication is the most common way to issue debt. It is when several financial institutions join together to ensure the placement of a bond with investors in order to reduce their risk exposure. However, since the 1980’s, governments tend to use the auction method.

Auction

The auction can be “open”, i.e. all direct participants in public securities auctions (credit institutions, management and intermediation companies, etc.) have the possibility of acquiring part of the security put up for auction. It can also be “targeted”, i.e. the issue is reserved only for the primary dealers – banks or other financial institutions that has been approved to trade securities – of the issuing State.

A few days before the planned date of an auction, the State makes an announcement, confirming, postponing or cancelling the operation. It also gives the characteristics of the securities to be issued, i.e. the type of securities, the maturity and the amount it wishes to raise. Buyers can then submit several bids, each specifying the desired quantity and price. The issue lines are then auctioned to the highest bidders. The higher the demand is, the lower the issue rate is.

Auction is used because it provides investors, among other things, with transparency and free competition on an investment product with an attractive benefit in relation to a low risk level.

Each country that issues bonds uses different terms for them. UK government bonds, for example, are referred to as gilts. In the US, they are referred to as treasuries: T-bills (that expire in less than one year), T-notes (that expire in one to ten years) and T-bonds (that expire in more than ten years). In France, the government issues short-term liabilities (“Bons du Trésor”) and long-term liabilities (“OAT for “Obligations Assimilables du Trésor”) with maturity between 2 and 50 years.

Who holds government debt?

Government debt can be broken down into domestic and external debt depending on whether the creditors are residents or non-residents.

Domestic debt

Domestic debt refers to all claims held by economic agents (households, companies, financial institutions) resident in a sovereign state on that state. It is mostly denominated in the national currency. A government can call for savings, but savings used to finance the deficit can no longer be used to finance private activity and in particular productive investment. This is known as the crowding-out effect. A government must therefore deal with this limit.

External debt

External debt refers to all debts owed to foreign lenders. A distinction must be made between gross external debt (what a country borrows from abroad) and net external debt (the difference between what a country borrows from abroad and what it lends abroad). A level of debt that is too high can be dangerous for a country. In the event of fluctuations in the national currency, the interest and principal amounts of the external debt, if denominated in foreign currency, can quickly become a burden leading to default.

The case of France

In France, non-residents are the main holders of French public debt. They hold 64% of the bonds issued by the government. They are institutional investors, but also sovereign investment funds, banks and even hedge funds. In addition, as regards domestic debt, French insurance companies hold nearly 20% of French securities. They are used for life insurance investments. Finally, French banks and French mutual funds hold 10% and 2% respectively.

How to measure government debt?

While the French debt has risen from 2000 billion euros in 2014 to 2700 billion in 2021, the debt burden has fallen from 40 billion to 30 billion. What do these two ways of looking at a country’s debt mean?

In the European Union, the current measure of public debt is the one adopted by the Maastricht Treaty. It takes into account the nominal amount borrowed. This is a relevant criterion for measuring the government’s budgetary misalignments, i.e. its financing needs. It also makes it possible to introduce debt rules: the debt must be less than 60% of GDP.

Another way of measuring debt is to take into account the interest charges on public debt. This criterion makes it possible to account for the cost of the debt and not its amount. It is this criterion that must be considered in order to anticipate future financing needs, to plan taxes and interest charges in the government budget.

Useful resources

Rating agencies

S&P

Moody’s

Fitch Rating

Related posts on the SimTrade blog

   ▶ Rodolphe CHOLLAT-NAMY Why do governments issue debt?

   ▶ Rodolphe CHOLLAT-NAMY Bond valuation

   ▶ Rodolphe CHOLLAT-NAMY Bond markets

   ▶ Bijal GANDHI Credit Rating

   ▶ Jayati WALIA Credit risk

About the author

Article written in June 2021 by Rodolphe CHOLLAT-NAMY (ESSEC Business School, i>Grande Ecole – Master in Management, 2019-2023).

Examples of companies issuing bonds

Examples of companies issuing bonds

Rodolphe CHOLLAT-NAMY

In this article, Rodolphe CHOLLAT-NAMY (ESSEC Business School, Grande Ecole Program – Master in Management, 2019-2023) provides you with examples of companies issuing bonds.

In order to better understand corporate bonds, it is appropriate to look at recent issues to see their different characteristics: Veolia, Essilorluxottica and LVMH.

Véolia: EUR 700 million 6-year bond issuance with negative interest rate

The company

Veolia is a French multinational utility company. It markets water, waste and energy management services for local authorities and companies.

It employs more than 163,000 employees and had revenues of €27 billion in 2019.

The company recently made headlines in the financial news with its takeover bid for Suez. After months of financial, political and media battle, the French giants finally agreed on a merger. The new group is expected to have a 5% share of the world market with 230,000 employees.

The bond issuance

On Monday, January 11, 2021, Veolia issued €700 million of bonds maturing in January 2027 at a negative rate of -0.021%.

This is the first time that a BBB-rated issuer has obtained a negative rate for this maturity. This was due to strong demand from investors who welcomed the transaction. As a result, the order book reached up to 2 billion euros, which allowed for a negative yield. This reflects the very positive perception of Veolia, as well as the credibility of its proposed merger with Suez.

This example is quite symptomatic of the low-rate period we are currently in. Indeed, we see here that a company can take on debt at negative rates.

Essilorluxottica: €3 billion bond issuance

The company

EssilorLuxottica is a Franco-Italian multinational company, resulting from the 2018 merger of the French company Essilor and the Italian company Luxottica. It is one of the leading groups in the design, production and marketing of ophthalmic lenses, optical equipment, prescription glasses and sunglasses.

The group employs more than 153,000 people and had sales of EUR 14 billion in 2002.

The bond issuance

On Thursday, May 28, 2020, EssilorLuxottica issued €3 billion of bonds. The bonds have maturities of 3.6 years, 5.6 years and 8 years, with rates of 0.25%, 0.375% and 0.5% respectively.

Demand was very high as the order book reached almost 11 billion euros, reflecting investors’ confidence in EssilorLuxottica’s model.

This example allows us to notice that during an issue, bonds of different maturities can be issued at the same time. This allows us to respond adequately to financing needs by allowing us to play on the maturity and therefore on the rates. Here, the rates increase with time. In fact, outside of recessionary periods, this correlation is observed because the risks for investors increase with time. In the same way, their money is immobilized for a longer period of time and therefore must be remunerated for that.

LVMH: 9.3-billion-euro bond issuance

The company

LVMH is a French group of companies, today a world leader in the luxury goods industry. The firm has a portfolio of seventy brands including Moët, Hennessy, Louis Vuitton, Dior, Céline, …

The group employs more than 163,000 employees and had a turnover of 53 billion euros in 2019.

Announced in November 2019, then canceled because of Covid-19, the takeover of Tiffany finally took place in January 2021 for a total amount of $ 15.8 billion.

The bond issuance

On February 6, 2020, LVMH issued €9.3 billion in bonds, denominated in euros and pounds sterling. This was the largest bond issue in Europe since AB inBev in 2016. The maturities of the bonds issued range up to 11 years with a yield of 0.45%. Some tranches, including the four-year euro tranche, have a negative yield. The overall cost of this financing is estimated at 0.05%.

The purpose of this issue was to refinance the acquisition of Tiffany. It received strong interest from investors with an order book of nearly 23 billion euros. In addition, LVMH benefited from very favorable market conditions. Indeed, January had been rather weak in terms of the volume of issues by companies in the investment grade category and had been dominated by those in the high yield category. Thus, investors had a lot of liquidity to invest in more secure investments. Finally, LVMH issues few bonds even though the group is highly rated. Investors were therefore looking to acquire its debt.

This example allows us to understand the conditions of a record issue. Moreover, it also allows us to underline that it is possible to resort to borrowing to finance new projects, current expenses or, in this case, an acquisition.

Useful resources

Rating agencies

S&P

Moody’s

Fitch Rating

Related posts

   ▶ Rodolphe CHOLLAT-NAMY Bond valuation

   ▶ Rodolphe CHOLLAT-NAMY Bond risks

   ▶ Rodolphe CHOLLAT-NAMY Bond markets

   ▶ Bijal GANDHI Credit Rating

   ▶ Jayati WALIA Credit risk

About the author

Article written in June 2021 by Rodolphe CHOLLAT-NAMY (ESSEC Business School, Grande Ecole Program – Master in Management, 2019-2023).

The rise in corporate debt

The rise in corporate debt

Rodolphe Chollat-Namy

In this article, Rodolphe CHOLLAT-NAMY (ESSEC Business School, Grande Ecole Program – Master in Management, 2019-2023) analyzes the rise in corporate debt.

Since the financial crisis of 2007-2008, the level of debt in the world has increased significantly. Global debt, which includes the debt of (non-financial) corporations, financial institutions, governments and households, has risen from 292% of global GDP in 2008 to 318% in 2018. This increase in global debt is primarily driven by the growth of non-financial corporate debt after the subprime crisis. Indeed, the debt of non-financial companies rose from 78% to 92% of GDP between 2008 and 2018. What are the reasons for this increase? How did the coronavirus crisis impact debt levels? What are the consequences of rising debt levels?

Growth in corporate debt through the bond markets, mainly driven by emerging countries

An increase linked to an increase in bond issues

Until the 2008 crisis, the banking sector was the fastest growing corporate financing tool, notably through international banks. Since the 2008 crisis, there has been a shift. Companies then began to take on more debt on the financial markets (bonds) than from banks (credit). Thus, the increase in corporate debt since the 2008 crisis has been mainly through the bond markets. The main driver of this increase is the accommodating monetary policies pursued by the developed economies.

An increase driven by developing countries

Moreover, the rise in non-financial corporate debt has not been uniform across the world. It has actually been concentrated in emerging economies. Between 2008 and 2018, this type of debt in emerging economies grew from $9 trillion to $28 trillion. This growth is much faster than the growth of the GDP of these countries. Indeed, over the same period, the debt of non-financial companies has increased from 56% to 96% of GDP. At the same time, the debt of non-financial corporations has grown at the same rate as GDP since 2008 in the developed economies (with the exception of China).

The growing share of bond markets, in the case of emerging economies, is noteworthy. Indeed, between 2008 and 2018, the share of bonds in the total debt of non-financial companies in emerging economies rose from 19% to 32%, effectively increasing by 13 percentage points.

A rise in non-financial private sector debt with the Covid-19 pandemic

The exceptional measures taken by governments around the world eased financial conditions to support the economy of their own country. This response to the pandemic helped maintain the flow of credit to households and businesses, facilitated the recovery and contained financial risks. Nevertheless, this support has increased private non-financial sector indebtedness in both advanced and emerging economies.

While we saw above that the debt-to-GDP ratio of firms in developed countries was constant between 2008 and 2018, it worsened with the Covid-19 pandemic. The debt of private non-financial firms in developed countries rose from 149% of GDP in Q3 2019 for the US to 160% in Q3 2020. Similarly, debt of private non-financial firm in the Eurozone rose from 120% to 129% over the same period. Debt levels are not uniformly high as it depends on the size of the company and its sector of activity.

Companies have had massive recourse to borrowing first of all to cope with their cash flow difficulties, between a fall in activity and marked tensions in terms of payment. In addition to this, there is also a precautionary attitude which is pushing companies to use their borrowing capacity to the maximum in order to build up an extra cash cushion. Finally, large companies will also take advantage of borrowing facilities for other purposes. In particular, they will use debt to conduct share buyback programs and pay dividends.

What are the consequences of increased debt?

The growth in debt financing can have a number of positive aspects. It may indicate that firms are less constrained in their financing, allowing them to raise more funds to pursue profitable investment projects and expand. Similarly, it may mean that firms are obtaining new financing outside the traditional banking system, which helps them grow by diversifying their sources of funding.

However, it also poses a number of risks. In the aftermath of the Covid-19 crisis, corporate debt reached a worrying level. The question is: how will companies manage the repayment of their debt?

The accumulation of high levels of debt in a period of weak economic growth and declining corporate profits has been accompanied by increased default risks.

In addition, refinancing risks may have increased, as the fastest growth in corporate debt has been through bond financing, which is more difficult to refinance.

Finally, the post-covid recovery is likely to be asynchronous and divergent across countries. Financial conditions are likely to tighten in developed country markets, making it more difficult to finance companies in emerging economies.

Useful resources

Rating agencies

S&P

Moody’s

Fitch Rating

Related posts on the SimTrade blog

   ▶ Rodolphe CHOLLAT-NAMY Why do companies issue debt?

   ▶ Rodolphe CHOLLAT-NAMY Corporate debt

   ▶ Bijal GANDHI Credit Rating

   ▶ Jayati WALIA Credit risk

   ▶ Louis DETALLE A quick review of the DCM (Debt Capital Market) analyst’s job…

About the author

Article written in June 2021 by Rodolphe CHOLLAT-NAMY (ESSEC Business School, Grande Ecole Program – Master in Management, 2019-2023).

Credit analyst

Credit analyst

Rodolphe Chollat-Namy

In this article, Rodolphe CHOLLAT-NAMY (ESSEC Business School, Grande Ecole Program – Master in Management, 2019-2023) introduces you to the job of credit analyst.

Within an investment bank, several jobs are directly linked to bonds. Among them is that of credit analyst. What does a credit analyst do? What are the qualities required to be a credit analyst?

The missions of a credit analyst

Within a bank, the role of the credit analyst is to study in depth the financial situation of companies (risk assessment, analysis of strengths and weaknesses, analysis of financial accounts, etc.) in order to determine their solvency.

More concretely, analysts have three main tasks:

Firstly, as mentioned above, analysts conduct in-depth analyses of the financial statements and credit applications of the companies under their responsibility. They keep abreast of their current situation and closely monitor any developments that may affect their debt capacity.

Secondly, analysts provide recommendations related to the analysis and evaluation of the credit risk. If they think that the company is solid, they can for example propose to buy bonds of this company, which would thus constitute a safe investment. On the other hand, if they believe that the risk of default is increasing, they will propose to sell.

Finally, a significant part of analysts’ job is to present their results. This may take the form of a daily summary publication, or a more in-depth quarterly or annual publication. In addition, analysts may have to meet with the bank’s clients, mainly investors, to present their recommendations.

In addition, there may be ancillary tasks. For example, analysts may seek to develop new mathematical and statistical models to improve their understanding of bond risks.

What is the day-to-day life of a credit analyst like?

Analysts’ day starts early, before the financial markets open, so that he has time to brief investors on the latest bond news in the sectors they follow.

After that, their day depends very much on the calendar of the companies he or she follow. During the quarterly publications of these companies, they will spend time reading them and collecting the information contained in them. Similarly, they will attend the various conferences organized by these companies to explain the published results. The rest of the time, they will analyze this information, update their projection models and update their recommendations.

As the end of the semester or the year approaches, credit analysts’ days can become longer because they have to produce a semiannual or annual publication in which their recall the economic context and their recommendations. Following the publication of this, they will often make a tour of their clients to present it. This is known as a roadshow.

The qualities required to be a good credit analyst

Several qualities are necessary to be a good credit analyst.

First of all, credit analysts have strong corporate finance skills. In particular, they have a good understanding of corporate debt and liquidity ratios. The main ratios are: the debt-to-equity ratio which informs on the financial structure of the company, the interest coverage ratio which measures the capacity of a company to pay its interests and the debt-to-EBITDA ratio which measures the capacity of the company to repay its debt with the money generated by its activity.

Secondly, it is imperative to be very rigorous. Indeed, the quality of the analyses depends on the data collected. Analysts cannot afford to make mistakes in the figures they report. To this end, they have recourse to several sources of information: companies’ annual reports, press releases, financial statements, as well as market analyses produced by other players. It is important to note that all this information is public. Indeed, for legal reasons, to avoid insider trading, analysts have limited access to the information.

In addition, analysts must have strong synthesis skills. It is their analysis that investors will buy. It must therefore be as relevant as possible in order to present the best possible guidance. Moreover, the format of these analyses must also be carefully designed. They must be easily understandable by its readers. Analysts must therefore have presentation skills in order to sell them. It is important to take care of the content and the form.

Finally, analysts improve over time. They usually cover a particular sector. For example, he or she will be a specialist in the automotive sector. The better their knowledge of the sector, the more relevant their analysis. To do this, they must be familiar with the general environment of the sector they are following in order to identify future trends. Secondly, they must build up a database of the companies they follow.  The more accurate and long-standing the database, the better they will be able to put the new information they collect into perspective.

Related posts on the SimTrade blog

All posts about jobs in finance

   ▶ Jayati WALIA My experience as a credit analyst at Amundi Asset Management

   ▶ Aamey MEHTA My experience as a credit analyst at Wells Fargo

   ▶ Louis DETALLE My professional experience as a Credit Analyst at Societe Generale

   ▶ Jayati WALIA Credit risk

Useful resources

Rating agencies

S&P

Moody’s

Fitch Rating

About the author

Article written in June 2021 by Rodolphe CHOLLAT-NAMY (ESSEC Business School, Grande Ecole Program – Master in Management, 2019-2023).

Why do companies issue debt?

Why do companies issue debt?

Rodolphe Chollat-Namy

In this article, Rodolphe CHOLLAT-NAMY (ESSEC Business School, Grande Ecole Program – Master in Management, 2019-2023) provides insights into why companies issue bonds.

A company can finance its activities in different ways: by internal financing (self-financing) and by external financing comprising debt and equity. Often, internal funds are not sufficient. The company must therefore make a choice between raising debt and raising equity. So, it is necessary to ask what might lead a company to prefer one over the other.

The advantages of debt over equity for a company

Debt is often preferred to equity because it is structurally less costly for the following reasons:

– The interest on the debt is tax deductible. The debt therefore costs the interest minus the tax savings (assuming that the company makes profit and pays taxes…).

– Investing in stocks is riskier than investing in bonds because of a number of factors. For instance, the stock market has a higher volatility of returns than the bond market, capital gains are not a guarantee, dividends are discretionary, stockholders have a lower claim on company assets in case of company default. Therefore, investor expect higher returns to compensate it for the additional risk.  Thus, for the company, financing itself through debt will be less expensive than through equity.

– The remuneration of the debt is not strictly proportional to the increase of the risk taken by the company, because there are multiple ways for lenders to take guarantees: leasing, mortgage….

Debt has other advantages over equity:

Debt can be used to gain leverage. It provides a leverage effect for shareholders who contribute only part of the sums mobilized in the investment. This effect is all the more important when the interest rate at which the debt is subscribed is low and the economic profitability of the investment is high.

Raising equity dilutes ownership of existing stockholders. When a company sells equity, it gives up ownership of its business. This has both financial and day-to-day operational implications for the business. Debt does not imply such a dilution effect.

There is a practical benefit for using debt. Issuing debt is easier than issuing equity in practice.

Finally, the terms of repayment of principal and interest payments are known in advance. This allows companies to anticipate future expenses.

The disadvantages of debt over equity

First, unlike equity, debt must be repaid at some point. This is because equity financing is like taking a share in the company in exchange for cash. Thus, where cash outflows are required to pay interest on debt and repay principal, this is not useful for equity.

Moreover, in equity financing, the risk is carried by the stockholders. If the company fails, they will lose their stake in the company. In contrast, in debt financing, creditors often require assets to be secured. Thus, if the company goes bankrupt, they can take the collateral.

Finally, the debt capacity of a company is limited. Indeed, the more debt a company takes on, the higher the risk of default. Thus, creditors will ask an already highly leveraged company for higher interest rates to compensate for the risk they are taking. Conversely, equity financing allows companies to improve their capital structure, and thus present better debt ratios to investors.

Useful resources

Rating agencies

S&P

Moody’s

Fitch Rating

Related posts on the SimTrade blog

   ▶ Rodolphe CHOLLAT-NAMY The rise in corporate debt

   ▶ Rodolphe CHOLLAT-NAMY Corporate debt

   ▶ Louis DETALLE A quick review of the DCM (Debt Capital Market) analyst’s job…

About the author

Article written in June 2021 by Rodolphe CHOLLAT-NAMY (ESSEC Business School, Grande Ecole Program – Master in Management, 2019-2023).

Expeditionary experience in a Chinese investment banking boutique

Expeditionary experience in a Chinese investment banking boutique

Anna Barbero

In this article, Suyue MA (ESSEC Business School, Global Bachelor of Business Administration, 2017-2021) shares his experience as an intern at InvesTarget, an investment banking boutique in China focusing on capital raising and M&A.

About myself

I have been interested in finance ever since I started my study at ESSEC Business School in 2017. By acknowledging more about finance, during my 2nd year of study, I decided to build up my career in corporate finance, focusing on the primary market. By sending around 400 resumes to different companies and banks, I finally received my first internship offer in a top 10 securities company doing Real Estate Investment Trusts (REITs) and Commercial Mortgage-Backed Securities (CMBS) projects in China. Until now, I have finished 4 internships in the field of corporate finance, private equity, capital-raising advisory, and Mergers and acquisitions (M&A).

In this article, I would like to share with you about my internship in a capital-raising advisory team of a Chinese new-type investment banking boutique. This company mainly focuses on M&A and fundraising advisory; some of those companies will also play a role as venture capital if they have their own money to invest or they find some profitable projects.

My mission

In this internship, my primary exposure covered in Technology & Industrial sector, including Industrial Drone, Intelligence Vehicle, and Advanced Materials.

Main tasks

As an intern, my main tasks were mainly as followed:

  • Perform pro forma financing consequences, capitalization table, Discounted Cash Flows (DCF) analysis, and accretion/dilution analysis
  • Perform in-depth financial, accounting, and operation due diligence, which includes financial analysis, team’s background, and technology support on client companies
  • Prepare materials for internal business plan, business proposal, and financial advisory presentation
  • Conduct reports of industry research and company analysis on Telecom Media and Technology (TMT) specific sectors.

Details of a deal

Since a round of fundraising process is normally around six months, I had a chance to close two live deals. Let me take one of the deals as an example: we had a client company that is a top intelligent driving-technology startup with valuation around US$250m. The company was looking for US$30m Series B round funding (round of growth stage financing). Our role as a fundraising advisor was to screen potential investors (normally they are Venture Capitals (VCs), since B round is still in growth stage) who are interested in such field at first. We also helped and guided the client company to prepare the material needed for the fundraising, such as business plan, business contract, and company’s financial analysis. Subsequently, if VCs are interested, we will assist VCs to do the due diligence on the client company. It usually includes financial, accounting, law, and compliance documents. After the valuation of VCs, if they agree to invest in company’s shares, both VCs and client company will sign a Term Sheet and finish the transaction within a period mentioned by the contract.

Preparatory work

We also need to do industry and company research report in Technology and Industrial sector, in which industry research report should include the industry’s definition, category, history, political trends, market analysis, competition status, core technology, industry development trend, capital market research, etc. For the company research report, we should present the company’s background information, capitalization table, business category and products, team, financing history, cooperation relationship, etc.

Takeaway from my internship

Thus, by doing such work, as an intern, I could have a deep understanding regarding specific sectors and build up relationship with some top VCs and Private Equity (PE) firms. This is quite important for the students who want to work in the investment field of primary market.

Financial concepts

Venture Capital

Venture capital (VC) is a form of private equity and a type of financing that investors provide to startup companies and small businesses that are believed to have long-term growth potential. Venture capital generally comes from well-off investors, investment banks, and any other financial institutions. However, it does not always take a monetary form; it can also be provided in the form of technical or managerial expertise. Venture capital is typically allocated to small companies with exceptional growth potential, or to companies that have grown quickly and appear poised to continue to expand.

Though it can be risky for investors who put up funds, the potential for above-average returns is an attractive payoff. For new companies or ventures that have a limited operating history (under two years), venture capital funding is increasingly becoming a popular – even essential – source for raising capital, especially if they lack access to capital markets, bank loans, or other debt instruments. The main downside is that the investors usually get equity in the company, and, thus, a say in company decisions.

Capital funding

Capital funding is the money that debt and equity holders provide to a business for daily and long-term needs. A company’s capital funding consists of both debt (bonds and loans) and equity (stock). The business uses this money for both capital expenditures (Capex) and operating expenditures (Opex). The debt and equity holders expect to earn a return on their investment. The form of returns is interests for debt holders, and dividends and capital gains for equity holders. However, in my internship, since the company is still a startup at growth stage, so it only includes equity financing, which means that the investors will directly own the company’s share rights by investment money.

Discounted Cash Flow (DCF)

The discounted cash flow (DCF) method is a valuation method used to estimate the value of an investment based on its expected future cash flows. DCF analysis attempts to figure out the value of an investment today (present value) based on projections of how much money it will generate in the future. This applies to investment decisions of investors in companies, such as acquiring a company, investing in a technology startup, or buying stocks in the secondary market. For business, owners and managers are looking to make capital budgeting or operating expenditures decisions such as opening a new factory, purchasing or leasing new equipment.

The DCF formula is shown below:

Present value of a series of cash flows

where PV is the present value of the investment, CF the series of cash flows generated by the investment (CF1 is for year 1, CF2 is for year 2, …, CFT is for the last year T) and r the discount rate.

Relevance to the SimTrade certificate

The experience shared above is strongly related to the SimTrade Certificate. The primary market is where securities are created, while the secondary market is where those securities are traded by investors. The boundary between primary and secondary market is the IPO. Once stocks are traded in public, it comes to secondary market. From my perspective, most parts of the investment analysis and logic are the same, such as fundamental analysis, DCF, P/E ratio, etc. so we can benefit from SimTrade by learning how business factors will affect the company’s stock performance and why and when should we make the right investment.

Related posts

   ▶ All posts about Professional experiences

Useful resources

InvesTarget

Investopedia Venture Capital

Investopedia Private Equity

About the author

Article written in June 2021 by Suyue MA (ESSEC Business School, Global Bachelor of Business Administration, 2017-2021).

Career in finance

Career in finance

Anna Barbero

In this article, Anna BARBERO (ESSEC Business School, Master in Strategy & Management of International Business (SMIB), 2020-2021) discusses various aspects of a financial career.

I had the opportunity to talk with Alexis Fontana (ESSEC Alumni and Board member of ESSEC Alumni-Club Finance) who has worked in many fields related to corporate finance (audit, private equity, and mergers and acquisitions, etc.) Alexis currently works at EY as a “Strategy and Transactions” manager.

Interview with Alexis Fontana

Question: First, your curriculum and your engagement at Club ESSEC Finance show a real passion for corporate finance. When did you decide you would take this orientation? And why?

Corporate Finance is indeed a field in which I really enjoy being involved and here are the reasons why:

  • The analytical aspect of Corporate Finance, as a transaction due diligence professional on a day-to-day basis
  • The investment side, I was once a private equity professional and continue to work with small and large Private Equity (PE) funds
  • The theoretical approach, I have just finished my certified accountant thesis. The subject deals with the impacts of the working capital requirements on the value of industrial small medium enterprises (SMEs) in the context of a sell-side process.

When I joined ESSEC in 2012, I initially wanted to work for the Autorité des Marchés Financiers (the French financial regulator). The multiple professional experiences required to fulfil the ESSEC curriculum helped me in the design of my professional career I am still building today.
I think that one of the key encounters that made me discover my passion for corporate finance was Albert Aidan, a Senior Partner at Deloitte, who was once my professor of accounting at ESSEC Business School but also, back then, the treasurer of ESSEC Alumni.

Question: The financial sphere is often criticized for being profit oriented. What would you respond to those critics?

The financial sphere is mandated or has in its very statutory purpose the aim of making sustainable profit. One of the key aspects I learned over the recent years is that no company can be durable without being profitable.

During my curriculum at ESSEC Business School, I have been privileged to work in a pan-European French Private Equity fund, attending each week the investment committee with some of the sharpest investment minds I have had the opportunity to meet so far.

What I understood, is that these professionals work to safeguard the interests of the Limited Partners (LP) of the fund (institutions, family offices, individuals which decide to invest money in an investment fund managed by a General Partner (GP) and its team of investment professionals). To that extent the actions taken are aimed to achieve resilient returns through investments in high potential companies which are, by the way, embarked in value creation journeys which bring (i) new jobs, (ii) economic activity to region, (iii) growth and ambition on a national or international scale.

More recently in the context of the COVID-19 crisis, the financial sphere has been faced with a call for greater purpose that is still being translated in concrete actions: (i) extra-financial reporting measuring impact and Environmental, Social, and Governance (ESG) related metrics, (ii) tighter reporting and communication standards, (iii) stronger compliance. I really do believe that today is a good time to start a career in corporate finance. So many fields and uncharted territories are being addressed by the industry which is in high need of bright minds and pioneers!

Question: You have worked in several finance fields: audit, private equity and more recently even M&A. Which one did you like most? Do you feel that an experience in one field can help in another? For a young professional, which one do you advise to start with?

I am really passionate about my current responsibilities as a transaction due diligence professional, it offers me the opportunity to always be working on the most strategic corporate events (acquisition, divestiture, capital reorganization, refinancing and even restructuring). It gives me also the opportunity to work on daily basis with Chief Executive Officers (CEOs), Chief Financial Officers (CFOs), Private Equity (PE) professionals, Merger and Acquisitions (M&A) bankers, lawyers (corporate, law, tax) on top of a broad ecosystem of experts.

My past experiences gave me the tools to advise my clients on very technical aspects of a deal with the aim of always giving them the more acute advice in a timely manner. What I really like is the negotiation phase of the deals – the final word is to convince the other party to get the deal done. Each deal is unique, and I would even say that cross-border deals are the most fascinating as you add the cultural aspects on top of the already complex deal challenges you must solve.

Should you consider a career in Corporate Finance, I recommend performing an introductory experience in Audit as it gives you all the keys to understand how financial information is sourced, processed and then communicated.

My advice to young professionals is to learn and gather soft skills, but to also bring a broader focus on a domain of expertise. Hard skills are keys in the current business environment we are navigating through and it will become more and more sought after. It can be law, accounting (please do write me directly if this field interest you) and other fields of interest but do be curious and keep learning things even after finalizing your curriculum at ESSEC Business School, you always to remain at the top of the game.

Key concepts

Audit

According to the Dictionary of Cambridge, financial audit is “the process of checking a company’s or organization’s financial statements to make certain they are correct and complete, and then providing this information in an official report”. Financial audits are conducted internally and externally by consulting firms. The major audit experts are called the “Big Four”: Deloitte, EY, KPMG & PwC.

Private Equity

“Private equity is an alternative investment class and consists of capital that is not listed on a public exchange” (Investopedia). There are two types of investors in private equity:

  • Limited Partners (LP) that generally hold 99% of shares and have limited liability;
  • General Partners (LP) who hold 1% of shares and have full liability.

Private equity allows companies & startups to gain liquidity without necessarily contracting expensive loans or listing on public markets. Yet, it is more difficult to find & negotiate private equity funds than making a match in the public market order book.

Merger and Acquisitions

According to the CFI (Corporate Finance Institute), “Mergers and acquisitions (M&A) refer to transactions between two companies combining in some form”:

  • Mergers are the combinations of two companies of comparable size. The largest in history was the merger of American Online & Time Warner Inc. The $360 billion deal was closed in 2000 (Investopedia).
  • Acquisitions occur when a bigger company acquires a smaller one. Vodafone acquired Mannesman AG for $180.95 billion. However promising, the deal was a failure (Investopedia).

Working in M&A can mean several things: leading the strategy to proceed M&A, advising on the target company, proceeding the financial transaction, examining the legal side, etc. M&A is treated internally in corporations and externally by consulting firms, banks, etc. Morgan Stanley and Goldman Sachs are two famous M&A firm.

Related posts on the SimTrade blog

   ▶ All posts about Professional experiences

Useful resources

Corporate Finance Institution, Mergers & Acquisitions.

Shobit Seth reviewed by Eric Estevez, 2021. The 5 biggest Mergers in History, Investopedia.

Shobit Seth reviewed by David Kindness, 2021. The 5 biggest Acquisitions in History, Investopedia.

About the author

Article written by Anna BARBERO (ESSEC Business School, Master in Strategy & Management of International Business (SMIB), 2020-2021) .

Credit Rating Agencies

Credit Rating Agencies

img_SimTrade_Photo1_Raphael_Roero_de_Cortanze

In this article, Raphaël ROERO DE CORTANZE (ESSEC Business School, Grande Ecole Program – Master in Management, 2019-2022) explains how credit rating agencies work.

What are Credit Rating Agencies?

Credit Rating Agencies are private companies whose main activity is to evaluate the capacity of debt issuers to meet their financial commitments. The historical agencies (Moody’s, Standard & Poor’s and Fitch Ratings) hold about 85% of the market. But national competitors have emerged over the years, such as Dagong Global Credit Rating in China. Nonetheless, there is little competition in this market as the barriers to entry are very high. The rating agencies’ business model is based on remuneration paid by the rated entities, consulting activities, and the dissemination of rating-related data.

The rating gives an opinion (in the form of a grade) on the ability of an issuer to meet its obligations to its creditors, or of a security to generate the capital and interest payments in accordance with the planned schedule. The rated entities are therefore potentially all financial or non-financial agents issuing debt: governments, public or semi-public bodies, financial institutions, non-financial companies. The rating may also relate not to an issuer in general, but to a security.

S&P, Moody’s, and Fitch rating scales S&P, Moody's, and Fitch rating scales
Source: internet.

Rating agencies are key players in the markets. Indeed, ratings are widely used in the regulatory framework on the one hand, and also in the strategies of many investors. For instance, to be eligible for central bank refinancing operations, securities must have a minimum rating. Similarly, the management objectives of many investors are based on ratings: for example, a mutual fund may have as one of its objectives to hold 80% of assets issued by issuers rated at least “BBB”. Credit risk monitoring indicators in corporate and investment banks are also based on ratings.

Credit Rating Agencies: judges & parties during the subprime crisis?

Rating agencies played a crucial role in securitization (“titrisation” in French), a financial technique that transforms rather illiquid assets, such as real-estate loans, into easily tradable securities. The agencies rate both the securitized credit packages and the bonds issued as counterparts according to the different risk levels.

The securitization technique appeared in the 70’ in the US, and allowed banks to grant more loans. During the 1990’ and 2000’, banks used securitization as a way to remove from their balance sheet the loans they granted. Indeed, banks would package loans in vehicles labelled as “Asset Backed Securities” (securities which the collateral is an asset). Banks would then sell these securities, or sell the risk associated with these securities. In the case of subprimes, the loans were packaged inside vehicles called “Mortgage Backed Securities”, as these securities had as counterpart the mortgage loans. There was a shift from the previous “originate-to-hold” bank model (where banks originated the loans and kept them in their balance sheet) to the new “originate-to-distribute” model (where banks originated the loans and then took them out of their balance sheet).

Michel Aglietta explains that in the case of securitized loans (such as MBS), the rating agencies rate and are at the same time stakeholders in the securitization. Indeed, the constitution of the product and the rating are completely intertwined. “Without the rating, the security has no existence”. The investment banks that structure and market the product and the agencies work together to determine the specificities of each loan packages or “pools” and obtain the desired rating.

It is now recognized that rating agencies often overrated the securitized packages compared to the intrinsic risk they were carrying. By granting high grades to many securitized packages (the highest being AAA), they have contributed to the formation of a speculative bubble. In addition, when the housing market collapsed, the rating agencies reacted too late and downgraded MBS abruptly, which inevitably worsened the crisis. For example, 93% of the MBS rated AAA marketed in 2006 had their grade scaled down to “junk bond” ratings (BB+/Ba1 and below) later on.

Rating agencies have been accused of conflict of interest, as they are paid by those they rate. The emails revealed by the US Senate Investigations Subcommittee in April 2010 during its work on the Goldman Sachs affair reveal a system in which the marketing teams of structured products of investment banks tended to choose the agency most inclined to give the most favorable rating. Furthermore, the Senate subcommittee found that rating decisions were often subject to concerns about losing market share to competitors.

Key concepts

Mortgage loan

A mortgage loan has the specificity of putting the purchase property (a house for instance) as the counterpart of a loan. In the case of a payment default, the property is seized.

Related posts on the SimTrade blog

▶ Jayati WALIA Quantitative Risk Management

▶ Jayati WALIA Credit risk

▶ Rodolphe CHOLLAT-NAMY Credit analyst

▶ Jayati WALIA My experience as a credit analyst at Amundi Asset Management

Useful resources

La Finance pour Tous

Aglietta M. (2009) La crise : Pourquoi en est arrivé là ? Michalon Editions.

Ministère de l’Economie et des Finances Quel rôle ont joué les agences de notation dans la crise des subprimes ?

Marian Wang (2010) Banks Pressured Credit Agencies, Then Blamed Them Later on Blog.

About the author

Article written in May 2021 by Raphaël ROERO DE CORTANZE (ESSEC Business School, Master in Management, 2019-2022).

The Internal Rate of Return

The Internal Rate of Return

img_SimTrade_Photo1_Raphael_Roero_de_Cortanze

In this article, Raphaël ROERO DE CORTANZE (ESSEC Business School, Grande Ecole Program – Master in Management, 2019-2022) explains the financial concept of internal rate of return (IRR).

What is the Internal Rate of Return?

The Internal Rate of Return (IRR or “TRI” – “taux de rendement interne” in French) of a sequence of cash flows is the discount rate that makes the Net Present Value (NPV or “VNP” or “VAN” for “valeur nette présente” or “valeur actuelle nette” in French) of this sequence of cash flows equal to zero.

Screenshot 2021-05-31 at 21.59.49

In order to calculate the IRR, two methods can be used. First of all, use the Excel “IRR” formula on the sequence of cash flows, which will automatically display an approximate value for the IRR. Nonetheless, if Excel is not available for performing the IRR calculation, you can use the dichotomy method (which is indeed used by Excel). The dichotomy method uses several iterations to determine an approximation of the IRR. The more iterations are performed, the more accurate the final IRR output is. For each iteration, the table below assesses whether the NPV using the “Average” discount rate is positive or negative. If it is negative (resp. positive), it means the IRR is somewhere in between the “Lower bound” (resp. “Upper bound” and the “Average”) and the next iteration will thus keep the same “Lower bound” (resp. use the “Average” as the new lower bound) and use the “Average” as the new “Upper bound” (resp. keep the same “Upper bound”). After 10 iterations, the table displays an IRR of 18,457%, which is an approximation to the nearest hundredth of the 18,450% IRR calculated with the Excel formula.

Screenshot 2021-05-31 at 22.08.50

The IRR criterion

In the same way as the NPV, the IRR can be used to evaluate the financial performance of:
A tangible investment: the IRR criterion can be used to evaluate which investment project will be the most profitable. For instance, if a firm hesitating between Project A (buying a new machine), Project B (upgrading the existing machine) and Project C (outsourcing a fraction of the production), the firm can calculate the IRR of each project and compare them.
A financial investment: whether it is a bank investment or a private equity investment (purchase of a company) the IRR criterion can be used to sort different projects according to their financial performance.

Disaggregating the IRR

Investors and especially Private Equity firms often rely on the IRR as one measure of a project’s yield. Projects with the highest IRRs are considered the most attractive. The performance of Private Equity funds is also measured through the IRR criterion. In other words, PE firms use the IRR to select the most profitable projects and investors look at the IRR of PE funds when choosing to which PE firms’ fundraising campaign, they will participate in.

Nonetheless, IRR is the most important performance benchmark for PE investments, the IRR does not go into detail. Indeed, disaggregating the IRR can help better understand which are the different components of the IRR:

  • Unlevered IRR components:
    • Baseline return: the cash flows that the acquired business was expected to generate without any improvements after acquisition.
    • Business performance: value creation through growth by improving the business performance, margin increase and capital efficiency improvements.
    • Strategic repositioning: value creation through by increasing the opportunity for future growth and returns (innovation, market entries etc.).
  • Leveraged IRR: PE investments heavily rely on high amounts or debt funding (hence the wide use of Leverage Buy-Out or LBO). Debt funding allows to resort to less equity funding, thus mechanically increasing the IRR of the investment.

Each of these components can have different proportions in the IRR. As an example, we can consider two PE funds A and B displaying the same IRR of 30%. After disaggregating each fund’s IRR, we come up with the following table, showing the weight of each IRR component in the total IRR (or “Levered IRR”). From this table, we understand that Fund A and Fund B have very different strategies. Fund A focuses in its PE operations on improving the business performance and carrying out strategic repositioning’s. Only 23% of the total IRR comes from financial engineering. In contrast, Fund B draws most of its performance from financial engineering, while only 23% of the total IRR comes from the unlevered IRR.

Screenshot 2021-05-31 at 22.09.00

Through this example we understand that PE funds and firms can have very different strategies, while disclosing the same IRR. Thus, disaggregating the IRR can reveal the positioning of PE funds. Finally, disaggregating the IRR also allows to assess whether PE funds are true to the strategy they display: for instance, a fund can be specialized in strategic repositioning and business performance improvements on the paper, but drawing most of its value creation through financial engineering.

Related posts on the SimTrade blog

   ▶ Jérémy PAULEN The IRR function in Excel

   ▶ Léopoldine FOUQUES The IRR, XIRR and MIRR functions in Excel

   ▶ William LONGIN How to compute the present value of an asset?

   ▶ Maite CARNICERO MARTINEZ How to compute the net present value of an investment in Excel

   ▶ Sébastien PIAT Simple interest rate and compound interest rate

Useful resources

Prof. Longin’s website Calcul de la VNP et du TRI d’une séquence de flux (in French)

Prof. Longin’s website Méthode de dichotomie pour le calcul du TRI (in French)

McKinsey A better way to understand internal rate of return

About the author

Article written in June 2021 by Raphaël ROERO DE CORTANZE (ESSEC Business School, Grande Ecole Program – Master in Management, 2019-2022).

Corporate debt

Corporate debt

Rodolphe Chollat-Namy

In this article, Rodolphe Chollat-Namy (ESSEC Business School, Grande Ecole – Master in Management, 2019-2023) introduces you to corporate debt.

Investors seek to determine how the different characteristics of a bond can influence its intrinsic value in order to know whether it is a good investment or not. To do this, they will look at the theoretical value of a bond, i.e. its present value. How can this be determined? How to interpret it?

Composition of a company’s debt

The debt of a company is composed of short-term liabilities and of long-term liabilities.

Short-term liabilities: accounts payable, deferred revenues, wages payable, short-term notes, current portion of long-term debt.

Long-term liabilities: Bonds payable, capital leases, long-term loans, pension liabilities, deferred compensation, deferred income taxes.

Let us have a look to the long-term liabilities:

  • Bonds payable: A bond payable is a form of long-term debt issued by the company.
  • Capital leases: A capital lease is a contract entitling a renter to the temporary use of an asset.
  • Long-term loans:  A long-term loan involve borrowing money over a specified period with a pre-planned payment schedule.
  • Pension liabilities: A pension liability is the difference between the total amount due to retirees and the actual amount of money the company has on hand to make those payments.
  • Deferred compensation: Deferred compensation is an arrangement in which a portion of an employee’s income is paid out at a later date after which the income was earned.
  • Deferred income taxes: Deferred income taxes result from a difference in income recognition between tax laws and the company’s accounting methods.

When looking at a company’s debt, analysts often look at net debt. It is equal to the sum of the short-term liabilities and of the long-term liabilities minus the cash and the cash equivalents, that are liquid investments with a maturity of 90 days (certificates of deposit, treasury bills, commercial paper, …). It is a metric that measures a company’s ability to bay all its debts if they were due today.


For example, assume that a company has a line of credit of $5,000, a current portion of long-term debt of $25,000, a $60,000 long-term bank loan, and $40,000 in bonds. Moreover it has $10,000 in cash and $5,000 in Treasury bills.

The short-term debt would be equal to $5,000 + $25,000 = $30,000

The long-term debt would be equal to $60,000 + $40,000 = $100,000

And the cash and cash equivalents would be equal to $10,000 + $5,000 = 15,000

So the net debt of the company would be equal to $115,000.

Debt Ratios

Nevertheless, an absolute value will not give us much indication of the health of the company. In order to understand the company’s indebtedness, we need to compare the amount of debt with other metrics. To do this, we will use what are called ratios.

We will focus here on three important ratios: the debt-to-equity ratio, the EBIT-to-interest expenses ratio and the debt-to-EBITDA ratio.

Debt-to-equity ratio (D/E)

The D/E ratio, also known as gearing, is a ratio that measures the level of debt of a company in relation to its equity. Simply put, it tells us about the financial structure of the company.

Capture d’écran 2021-05-30 171132

Changes in long-term liabilities have more influence on the D/E ratio than changes in short-term liabilities. Thus, investors will use other ratios if they want information on short-term liabilities.

The higher the ratio, the more indebted the company is. The risk is therefore higher. Between 0 and 0.1, the ratio is theoretically excellent. Above 1, the ratio is theoretically bad.

Beware, this ratio has its limitations. First of all, the reading of this ratio depends on the industries. Capital intensive industries, such as TMT or oil and gas, will tend to have higher ratios. It is therefore necessary to compare the ratios of companies in the same sector. On the other hand, a low D/E ratio can also mean that a company is afraid to invest. In the long run, this can present a risk of downgrading compared to its competitors.

It is therefore important to keep in mind, and this is also true for other ratios, that it is one indicator among others and that it cannot be perfect. It is important to put it into context and to compare comparable companies.

Interest Coverage ratio (ICR)

The ICR is the ratio of financial expenses to operating income. It measures a company’s ability to pay the interest on its debt.

Capture d’écran 2021-05-30 171146

A low ICR means that less profit is available for interest payments and that the company is more vulnerable to rising interest rates.

Usually, the ICR is considered low when it is below 3. However, it varies according to the type of industry. On the other hand, we can also look at the trends that are emerging. A falling ICR is worrying for investors.

Debt-to-EBIDTA ratio

This ratio measures the company’s ability to repay its debt with the money generated by its activity. It tells us how many years of profit it would take to pay off the entire debt. It is often referred to as leverage.

Capture d’écran 2021-05-30 171157

Analysts often use this ratio, which is easy to calculate. The lower the ratio, the healthier the company. A good ratio is between 2 and 4. However, again, it depends on the industry.

Related posts on the SimTrade blog

   ▶ Rodolphe CHOLLAT-NAMY Why do companies issue debt?

   ▶ Rodolphe CHOLLAT-NAMY Corporate debt

   ▶ Louis DETALLE A quick review of the DCM (Debt Capital Market) analyst’s job…

About the author

Article written in May 2021 by Rodolphe Chollat-Namy (ESSEC Business School, Grande Ecole – Master in Management, 2019-2023).

Bond risks

Bond risks

Rodolphe Chollat-Namy

In this article, Rodolphe CHOLLAT-NAMY (ESSEC Business School, Grande Ecole Program – Master in Management, 2019-2023) introduces you to bond risks.

Holding bonds exposes you to fluctuations in its price, both up and down. Nevertheless, bonds offer the guarantee of a coupon regularly paid during for a fixed period. Investing in bonds has long been considered one of the safest investments, especially if the securities are held to maturity. Nevertheless, a number of risks exist. What are these risks? How are they defined?

Default risk

Default risk is the risk that a company, local authority or government fails to pay the coupons or repay the face value of the bonds they issued. This risk can be low, moderate or high. It depends on the quality of the issuer.

For a given product, the default risk is mainly measured by rating agencies. Three agencies share 95% of the world’s rating requests. Moody’s and Standard & Poor’s (S&P) each hold 40% of the market, and Fitch Ratings 14%. The highest rated bonds (from Aaa to Baa3 at Moody’s and from AAA to BBB- at S&P and Fitch) are investment-grade bonds. The lowest rated bonds (Ba1 to Caa3 at Moody’s and BB+ to D at S&P and Fitch) are high yield bonds, otherwise known as junk bonds.

It should be noted that the opinions produced by an agency are advisory and indicative. Moreover, some criticisms have emerged. As agencies rate their clients, questions may be asked about their independence and therefore their impartiality. The analysis done aby rating agencies is most of the time paid by the entities that want their product to be rated.

In addition, companies issuing bonds are increasingly using the technique of “debt subordination”. This technique makes it possible to establish an order of priority between the different types of bonds issued by the same company, in the event that the company is unable to honor all its financial commitments. The order of priority is senior, mezzanine and junior debt. The higher the risk is, the higher the return is. It should also be noted that bonds have priority over equity.

To highlight the level of risk of an issuer, one can compare the yield of its bonds to those of a risk-free issuer. This is called the spread. Theoretically, it is the difference between the yield to maturity of a given bond and that of a zero-coupon bond with similar characteristics. The spread is usually measured in basis points (0.01%).

Liquidity risk

Liquidity risk is the degree of easiness in being able to buy or sell bonds in the secondary market quickly and at the desired price (i.e. with a limited price impact). If the market is illiquid, a bondholder who wishes to sell will have to agree to a substantial discount on the expected price in the best case, and will not be able to sell the bonds at all in the worst case.

The risk depends on the size of the issuance and the existence and functioning of the secondary market for the security. The liquidity of the secondary market varies from one currency to another and changes over time. In addition, a rating downgrade may affect the marketability of a security.

On the other hand, it may be an opportunity for investors who want to keep their illiquid bonds. Indeed, they usually get a better return. This is called the “liquidity premium”. It rewards the risk inherent in the investment and the unavailability of funds during this period.

Interest rate risk

The price of a bond fluctuates with interest rates. The price of a bond is inversely correlated to interest rates (the discount rate used to compute its present value). Indeed, the nominal interest rates follow the key rates. Thus, if rates rise, the coupons offered by new bonds will be higher than those offered by older bonds, issued with lower rates. Investors will therefore prefer the new bonds, which offer a better return, which will automatically lower the price of the older ones.

The interest rate risk is increasing with the maturity of the bond (more precisely its duration). The risk is low for bonds with a life of less than 3 years, moderate for bonds with a life of 3 to 5 years and high for bonds with a life of more than 5 years. However, interest rate risk does not impact investors who hold their bonds to maturity.

Inflation risk

Inflation presents a double risk to bondholders. Firstly, if inflation rises, the value of an investment in bonds will necessarily fall. For example, if an investor purchases a 5% fixed-rate bond, and inflation rises to 10% per year, the bondholder will lose money on the investment because the purchasing power of the proceeds has been greatly diminished. Secondly, high inflation can lead central banks to raise rates in order to tackle it, which, as we can see above, will depreciate the value of the bond.

To protect against this, some bonds, floating-rates bonds, are indexed to inflation. They guarantee their holders a daily readjustment of the value of their investment according to the evolution of inflation. However, these bonds have a cost in terms of return.

As with interest rate risk, the risk increases with the maturity of the bond. Also, the risk rises as the coupon decreases. The risk is therefore very high for zero-coupon bonds.

Currency risk

An investor can buy bonds in a currency other than its own. However, as with any investment in a foreign currency, the return on the bond will depend on the rate of that currency relative to the investor’s own currency.

For example, if an investor holds a $100 US bond. If the EUR/USD exchange rate is 1.30, the price of the bond will be €76.9. If the euro appreciates against the dollar and the exchange rate rises to 1.40, the price of the bond will be €71.4. Thus, the investor will lose money.

Useful resources

Rating agencies

S&P

Moody’s

Fitch Rating

Related posts

   ▶ Rodolphe CHOLLAT-NAMY Bond valuation

   ▶ Rodolphe CHOLLAT-NAMY Bond markets

   ▶ Bijal GANDHI Credit Rating

   ▶ Jayati WALIA Credit risk

About the author

Article written in May 2021 by Rodolphe CHOLLAT-NAMY (ESSEC Business School, Grande Ecole Program – Master in Management, 2019-2023).

Bond valuation

Bond valuation

Rodolphe Chollat-Namy

In this article, Rodolphe CHOLLAT-NAMY (ESSEC Business School, i>Grande Ecole – Master in Management, 2019-2023) introduces you to bond valuation.

Investors seek to determine how the different characteristics of a bond can influence its intrinsic value in order to know whether it is a good investment or not. To do this, they will look at the theoretical value of a bond, i.e. its present value. How can this be determined? How to interpret it?

Present value of a bond

The price of a bond is equal to the present value of the cash flows it generates. The holder of a bond will, by definition, receives a set of cash flows that will be received over a period of time. These flows are not directly comparable. A euro at time t1 does not have the same value as a euro at time t2. It is therefore necessary to determine the present value of future cash flows generated by the bond. This is calculated by multiplying these flows by a discount factor.

The discount rate chosen for this operation is determined by observing those already applied on the market to bonds comparable in duration, liquidity and credit risk. The convention is to discount all flows at a single rate, even if this does not reflect reality.

The present value of a bond is equal to the sum of the present value of the nominal amount and the present value of future coupons.

Capture d’écran 2021-05-30 165852

Where:

  • C = coupon payment
  • r = discount rate
  • F = face value of the bond
  • t = time of cash flow payment
  • T = time to maturity

This formula shows that the present value of the security varies with the discount rate. In addition, the longer a bond has to mature, the greater the impact of discounted income on the value. This is known as the bond’s sensitivity.

Note that this formula includes the accrued coupon. This is known as the <i>gross</i> price. Most often the price in question is the price at the coupon footer. This is known as the clean price.

Now, let us see an application of this formula:

Consider a 2-year coupon bond with a 5% coupon rate and a nominal value of €1,000. We assume that coupons are paid semi-annually. A 3% discount rate is used. What is its present value?

Capture d’écran 2021-05-30 165911

The result is PVbond = €1,038.54

Yield To Maturity (YMT)

The YTM (“taux de rendement actuariel” in French) represents the rate of return on a bond for someone who buys it today and holds it to maturity. This is equivalent to the internal rate of return (IRR) of an investment in a bond if the investor holds the bond until maturity, with all payments made as scheduled and reinvested at the same rate.

To calculate the yield to maturity of a bond, the compound interest – in other words “interest on interest” – method is used. This method takes into account the fact that the interest from holding a bond is added back to the principal each year and itself generates interest.

The YTM is the rate that equates the price of the bond with the present value of the future coupons and the final repayment.

We therefore have the following relation:

Capture d’écran 2021-05-30 165928

Where y corresponds to the YTM.

Example

Let us take an example:

Consider a 3-year coupon bond with a 10% coupon rate and a nominal value of €1,000. We assume that the present value of the bond is €980. What is the yield to maturity?

To find out the yield to maturity, you have to solve the following equation:

Capture d’écran 2021-05-30 165947

The YMT is 10.82%.

If a bond’s coupon rate is less than its YMT, then the bond is selling at a discount. If a bond’s coupon rate is more than its YMT, then the bond is selling at a premium. If a bond’s rate is equal to its YTM, then the bond is selling at par.

Related posts on the SimTrade blog

   ▶ Rodolphe CHOLLAT-NAMY Introduction to bonds

   ▶ Rodolphe CHOLLAT-NAMY Government debt

   ▶ Rodolphe CHOLLAT-NAMY Corporate debt

   ▶ Rodolphe CHOLLAT-NAMY Bond markets

   ▶ Rodolphe CHOLLAT-NAMY Bond risks

Useful resources

longin.fr Evaluation d’obligations à taux fixe

About the author

Article written in May 2021 by Rodolphe CHOLLAT-NAMY (ESSEC Business School, i>Grande Ecole – Master in Management, 2019-2023).

WallStreetBets

WallStreetBets

Shruti Chand

In this article, Shruti CHAND (ESSEC Business School, Grande Ecole Program – Master in Management, 2020-2022) explains what WallStreetBets is about.

This read will help you get started with understanding WallStreetBets and understand its impact in the stock market.

Meaning of WallStreet Bets

On the social media website Reddit, there are specific online communities that are dedicated to discussion on a particular topic, these are known as subreddits. And, WallStreetBets (r/wallstreetbets), or WSB, is one such subreddit. On WSB, the members discuss stock markets and options trading.

WSB has gained notice due to its aggressive trading strategies, indecent nature, and its role in the GameStop short squeeze. Members of the WSB are often young retail traders who are said to have a highly speculative style of trading that ignores the traditional investment practices and risk-management techniques. Their activity is even considered to be on the lines of gambling.

wallstreetbets

The growth of such individual investors has been powered by the rise of no-commission brokers and mobile online trading platforms (like Robinhood) which have made trading easy and accessible to everyone. Members of these communities like WSB often use high-risk day trading as an opportunity to make quick financial gains and obtain additional income.

The GameStop Short Squeeze

It would be unfair to talk about WSB and not discuss the GameStop Short Squeeze, an incident that threw the market into chaos and disrupted trading.

GameStop, a struggling company in the video games business, had become one of the most bet-against stocks on the market. Many big investors (hedge funds like Melvin Capital et Citron Capital) had taken large short positions on the stock, hoping to cash in on the company’s inevitable failure. Short selling is an incredibly risky strategy as the loss can be infinite when the stock price is going up. Members of WSB are said to have an aversion towards short sellers because of how it affects the financial system.

In January 2021, harnessing the power of the internet, Redditors on WallStreetBets started encouraging each other to buy the GameStop stock to drive the price up, which would adversely affect the short-sellers. This coordinated effort led the GameStop stock price to begin to rise. Eventually, GameStop had become a movement, which was not just about making money but about taking down ‘the man’ and punishing short sellers. It even led to the coining of the term ‘meme stock’. It attracted a huge amount of media attention and the number of members of WSB rose from 2 million to 6 million in a matter of days. As a result, in a mere few weeks, GameStop stock prices increased by a whopping 1700%.

Previously, it was believed that individual investors (also called ‘retail’ investors) have no real impact on the market and that such a thing was only within the capability of the big players of the game. This notion was successfully challenged by this incident. It was seen as the ‘little guys’ taking down the giants of Wall Street. It is believed that this trend of democratization of investing is here to stay.

Epilogue

After the GameStop short squeeze, it was anticipated that such manipulation in stock prices could happen again when groups like WSB target more companies. It turned out to be true as many stocks like AMC, Blackberry, etc. saw a surge in prices in an apparent Reddit-fuelled short squeeze.

In the financial world, WallStreetBets has received varied reactions. Trading platforms like Robinhood have tried to curb the power of Redditors by limiting transactions on the grounds of protecting customers. Many analysts and investors have derided and leveled insults at the WallStreetBets investors.

Whatever the future may hold, it is apparent that together, these amateur investors are changing some long-held beliefs about investing and they are gaining influence in the market in the process. Their online interactions have led to the reshaping of the power dynamic between retail and institutional investors.

Related posts on the SimTrade blog

   ▶ Shruti CHAND Robinhood

   ▶ Raphaël ROERO DE CORTANZE Gamestop: how a group of nostalgic nerds overturned a short-selling strategy

   ▶ Akshit GUPTA Short Selling

   ▶ Alexandre VERLET The GameStop saga

Useful resources

WallStreetBets

Relevance to the SimTrade certificate

This post deals with WallStreetBets in the Stock Market. More so, we learnt that retail investors can also have a real impact in the market.

Take SimTrade courses

About practice

  • By launching the series of Trading Exercises, you will practice how investors can become an investor in the stock market.

Take SimTrade courses

About the author

Article written in May 2021 by Shruti CHAND (ESSEC Business School, Grande Ecole Program – Master in Management, 2020-2022).

Consumer Confidence Index

Consumer Confidence Index

Bijal Gandhi

In this article, Bijal Gandhi (ESSEC Business School, Master in Management, 2019-2022) elaborates on the concept of Consumer Confidence Index.

This reading will help you understand the meaning, calculation, and importance of consumer confidence index.

Introduction

The consumer confidence index (CCI) is a statistical estimation that measures the current and future economic conditions. This indicator provides estimates based on households’ expectations and view of their financial situation like employability, saving capacity, consumption, etc.

It is a barometer that mainly measures the optimistic/pessimistic nature of the consumers regarding their future financial situation. The CCI is based on the concept that when consumers are optimistic about the future, they are likely to spend more currently and stimulate the economy but if the consumers are pessimistic about the future, then they are likely to save more in the present and hence this could lead to a recession. This index tells you about the optimal levels of the households about the economy and their ability to find jobs.

Measuring Consumer Confidence Index

The Consumer Confidence Index measures the degree of optimism/pessimism of the households for the future state of the economy by measuring household current saving and spending patterns. While the Consumer Confidence Index is measured differently in every economy based on various underlining factors, we talk about how it is measured in the U.S. economy to provide an understanding of its calculation process.

In the U.S. economy, the Conference Board calculates the Consumer Confidence Index. It was first calculated in 1985 and is now used as a benchmark to assess the CCI. The value of CCI is calculated monthly based on the results of a household survey of (1) consumers’ opinions on the current conditions as well as their (2) future economic positions. The former constitutes 40% of the index, while the latter constitutes the remaining 60%.

When the confidence increases, consumers spend more money in the present time ,and as a result, indicates the sustainability of an economy. And when the confidence decreases, consumers are prone to save more in the present time, and as a result, indicates the possibility of future economic turmoil.

Each month, the Conference Board conducts a survey for 5,000 U.S. households the survey participants are asked to answer each question in any of the three forms as positive, negative, or neutral. The survey is comprised of five questions about the following:

Present Situation Index

  • Current business conditions
  • Current employment conditions

Expectations Index

  • Business situation for the next six months
  • Employment situation for the next six months
  • Total family income situation for the next six months

A relative value is calculated separately for each question, it is then compared to the relative value from the 1985 survey. This comparison of the relative value is used to calculate the “index value” for each question.

Finally, the average of all five index values forms the final consumer confidence index. In the U.S. Economy, this data is calculated for the economy as a whole. In the following graph, we can see the impact of the corona virus pandemic on the consumer confidence index in April 2020.

Bijal Gandhi

Source: The Conference Board

Interpreting Consumer Confidence Index

The consumer confidence index measures the spending/savings pattern of the consumers currently and their response to the economy’s future growth prospects.

Higher index value means that the consumers have confidence in the future of the economy and its growth and as a result will be spending more currently. On the contrary, a lower index value means that consumers have low confidence in the future of the economy and as a result will be likely to save more in the present. Therefore, the consumer confidence index does not only help to interpret the household’s opinion on the future of the economy’s growth but also helps businesses, banks, retailers, and government to factor in and adapt to the changes in the household’s future consumption/saving patterns.

For example, if the consumer confidence index shows a consistent decrease in its value, it means that the consumers are currently saving more and, in the future, as well. As a result, consumers will be less willing to spend. Based on these manufacturers’ can adapt to their production of retail goods, banks can interpret a decrease in the lending activity and credit card usage, the government can adapt its fiscal or monetary policies to stimulate the economy. On the contrary, if the consumer confidence index shows a consistent increase in its value it means that the consumers are willing to spend more currently and, in the future, because they have confidence that the economy will boost. As a result, the manufacturers can increase their supply of non-essential goods and luxury goods, banks can expect the increase of withdrawal from the consumers saving accounts, etc.

The consumer confidence index is a lagging indicator, as mentioned by many economists. This means that the indicator is not necessarily good at predicting future economic trends. On the contrary, it is more like the index follows the future economic conditions after they have occurred. For example, even after a regressive period is over, the impacts will remain. There will still be an increased unemployment rate in the economy. This simply means that the consumer confidence index is more like the aftershocks of an earthquake that already happened in the economy.

CCI therefore helps get an idea of the consumer spending/saving pattern and the degree with which it will increase/decrease. An increase in spending can increase the growth of businesses and therefore result in higher earnings in stock market prices for businesses. Hence, investors are more likely to buy stocks if the consumer confidence index rises. As a result, the stock market may move drastically during the publication date of the confidence index.

Useful resources

About the author

Article written in May 2021 by Bijal Gandhi (ESSEC Business School, Master in Management, 2019-2022).

Purchasing Managers’ Index

Purchasing Managers’ Index

Bijal Gandhi

In this article, Bijal GANDHI (ESSEC Business School, Grande Ecole Program – Master in Management, 2019-2022) elaborates on the concept of Purchasing Managers’ Index

This read will help you understand the formulation of PMI and it’s importance for each of the stakeholders.

Introduction

The Purchasing Managers’ Index (PMI) is a statistical estimation used to determine the economic directions in which the manufacturing and service sectors are moving forward. The PMI consists of a diffusion index that locates whether the market conditions for a particular sector are expanding, remaining the same, or contracting. The main goal of this index is to provide information about the present and future business conditions to decision-makers, analysts, investors, and the government.

The Purchasing Managers’ Index is an economic indicator formulated via surveys conducted for businesses in a particular sector.

PMI is formulated by three main institutions:

  • Institute for Supply Management (ISM): This institute originated the manufacturing and non-manufacturing metrics produced for the United States.
  • Singapore Institute of Purchasing and Materials Management (SIPMM): This institute formulates the Singapore PMI.
  • IHS Markit Group: This institute formulates metrics based on ISM’s metrics for more than 30 countries worldwide.

Calculation of PMI

The Purchasing Managers’ Index is formulated by several different surveys of purchasing managers at businesses in a different sector but mainly revolving around manufacturing and service sectors. All the surveys are amalgamated into a single numerical result depending on several possible answers to each question.

The calculation mentioned below is the methodology of the PMI being calculated and released by the Institute for Supply Management (ISM). The PMI is formulated from a monthly survey sent to senior executives at more than 400 companies in 19 primary industries (which are selected and weighted via their contribution to the U.S. GDP). The PMI is formulated around five main survey areas: (1) new orders, (2) inventory levels, (3) production, (4) deliveries, and (5) employment. All the survey areas are equally weighed while computing the PMI. This always consists of questions about business conditions regarding the sector and if any possible changes are occurring, whether be expanding, stagnant, or contracting.

The Purchasing Managers’ Index is an index indicating whether the economic conditions are better or worse for the companies surveyed by comparing it to the previous PMI. The methodology used to calculate the PMI assigns weight to each common element. The common element is multiplied by the following for a certain situation: multiplied by 1 for improvement, multiplied by 0.5 for stagnation, and multiplied by 0 for deterioration.

The PMI is calculated as:

PMI = (P1 x 1) + (P2 x 0.5) + (P3 x 0) where,

P1 = % of answers indicating an expansion
P2 = % of answers indicating no change
P3 = % of answers indicating a contraction

The PMI is a number ranging between 0 and 100. The formulated PMI is then compared to the previous month and if the PMI is greater than 50 represents an improvement/expansion while a PMI which is less than 50 represents a contraction/deterioration. A PMI equal to 50 represents no change/stagnation. It is also important to note that the greater the difference from the midpoint of 50, the greater is the expansion/contraction.

Importance of PMI

The PMI is turning out to be one of the most tracked indicators of business activity across the globe. It provides a good picture of how an economy is functioning particularly in the manufacturing sector. It is a good representative of the boom-and-bust cycles in the economy and hence it is closely administered by investors, businesses, traders, and financial professionals including economists. Furthermore, the PMI acts as a leading indicator of economic activity. It is important to various entities as explained below.

For Manufacturers

The PMI and its relevant data formulated every month by the ISM are crucial decision-making tools for managers in various roles ranging from different sectors. For example, if a smartphone manufacturer makes their production decisions based on the expected new orders from customers in the future months. These new orders drive the management’s purchasing decisions about multiple components and raw materials. Therefore, the PMI helps manufacturers in predicting the possibility for an expansion or unexpected contraction in their sector and them to make decisions for an anticipated future.

For Suppliers

The PMI also facilitates suppliers in making their decisions. A supplier from the manufacturing sector would follow the PMI to predict the market to estimate the amount of future demand for its products. PMI’s ability to inform about supply and demand, in turn, helps the supplier adjust the prices that they can charge. For example, if the manufacturer’s new orders are growing, it might result in increased customer prices and as a result, accept a price increase from its suppliers as well. On the contrary, if the new orders are declining, the manufacturers might reduce their prices and as a result demand lower prices for the parts that they procure from suppliers.

For Investors

Investors can also utilize the data from the PMI to their advantage because the PMI acts as an indicator of economic conditions. The direction in which the PMI tends to follow is usually preceded by changes in the trends of major economic activities and outputs such as the GDP, Industrial Production, and Employability. Therefore, paying attention to the value of PMI and its movement can result in profitable foresight for the investors.

For Government

The Purchasing Managers’ Index is an important indicator for economic growth. It is used by international investors who try to formulate an opinion on the economic growth and hence consider PMI as a leading indicator for the GDP’s growth or deterioration. Central banks also utilize the results of PMI to formulate monetary policies.

Why should one be concerned about PMI?

PMI is a good indicator to provide a direction in which the economy is moving forward. If you are a potential employee, it will help you determine the increase or decrease in employability in an economy. If you are an investor, PMI helps you determine changes in the macro fundamentals of the economy and their impact on the equity market. If you are a business owner, it could help formulate and guide in making more informed and certain decisions related to the sourcing of raw materials, inventory levels, etc.

The following graph from tradingview.com depicts the PMI from 2017 to 2021. The PMI ranges between the value 0 and 100 with values below 50 showing contraction and values above 50 showing expansion in the economy. As of April 2021, the PMI was 60.70 as depicted in the chart below.

Bijal Gandhi

Source: www.tradingview.com

Related posts on the SimTrade blog

   ▶ Bijal GANDHI Economic Indicators

   ▶ Bijal GANDHI Leading and Lagging Indicators

   ▶ Bijal GANDHI GDP

   ▶ Bijal GANDHI Interest Rates

   ▶ Bijal GANDHI Inflation Rate

Useful resources

Institute for supply management

Trading View

About the author

Article written in May 2021 by Bijal GANDHI (ESSEC Business School, Grande Ecole Program – Master in Management, 2019-2022).

Credit Rating

Credit Rating

Bijal GANDHI

In this article, Bijal GANDHI (ESSEC Business School, Grande Ecole Program – Master in Management, 2019-2022) elaborates on the concept of Credit Rating.

This reading will help you understand the meaning, types, and importance of credit rating.

Introduction

Credit rating is the measurement of ability of the entity that seeks to borrow money to repay its financial obligation. Credit rating is based on the earning capacity of an entity as well as the history of the repayment of their past obligations. The entity seeking to borrow money can be an individual, a corporation, a state (at a national or federal level for some countries like the US), or a government agency. Credit ratings are used by banks and investors as one of the factors to determine their decision to lend money or not. Banks would develop their own credit analysis to decide to lend or not while investors would rely on the analysis by rating agencies to invest in credit products like commercial papers or bonds.

Rating agencies

The credit agency calculates the credit rating of an entity by analyzing its qualitative and quantitative attributes. Information can be procured from internal information directly provided by the entity such as financial statements, annual reports, etc. as well as external information such as analyst reports, published news articles, overall industry, etc.

A credit agency is not a part of the deal and therefore does not have any role involved in the transaction and, therefore, is assumed to provide an independent and honest opinion on the credit risk associated by a particular entity seeking to raise money through various means.

Now, three prominent credit agencies contribute 85% to the overall rating market:
1. Moody’s Investor Services
2. Standard and Poor’s (S&P)
3. Fitch Group

Each agency mentioned above utilizes a unique yet similar rating style to calculate credit ratings like described below,

Bijal Gandhi

Types of Credit Rating

Credit rating agencies use their terminology to determine credit ratings. Even so, the terminology is surprisingly similar among the three credit agencies mentioned above. Furthermore, ratings are grouped into two main categories:

Investment grade

These ratings indicate the investment is considered robust by the rating agencies, and the issuer is likely to complete the terms of repayment. As a result, these investments are usually less competitively priced when compared to speculative-grade investments.

Speculative grade

These investments are of a high-risk nature and hence offer higher interest rates to reflect the quality of the investments.

Users of Credit Rating

Credit Ratings are used by multiple entities like the following:

Institutional investors

Institutional investors like pension funds or insurance companies utilize credit ratings to assess the risk associated to a particular investment issuance, ideally with reference to their entire portfolio. According to the rate of a particular asset, it may or not include it in its portfolio.

Intermediaries

Credit ratings are used by intermediaries such as investment bankers, which utilize these ratings to evaluate credit risk and therefore derive pricing for debt issues.

Debt Issuers

Debt issuers like governments, institutions, etc. use credit ratings to evaluate their creditworthiness and to measure the credit risk associated with their debt issuance. These ratings can furthermore provide prospective investors in these organizations with an idea of the quality of the instruments issued by the organization and the kind of interest rate they could expect from such instruments.

Businesses & Corporations

Business organizations can use credit ratings to evaluate the risk associated with certain other organizations with which the business plans to have a future transaction/collaboration. Credit ratings, therefore, help entities that are interested in partnerships or ventures with other businesses to evaluate the viability of their propositions.

Understanding Credit Rating

A loan is a debt, which is the financial obligation with respect to its future repayment by the debtor. A credit rating helps to distinguish between debtors who are more liable to repay the loan compared to debtors who are more likely to be defaulters.

A high credit rating indicates the repayment of the loan by the entity without any possible defaults. A poor credit rating indicates the possibility of the entity defaulting the repayment of loans due to their past patterns with respect to loan repayments. As a result of the strong emphasis on credit rating, it affects an entity’s chance of being approved for a loan and receiving favorable terms for that loan.

Credit ratings apply to both businesses and the government. For example, sovereign credit ratings apply to the national government whereas corporate credit ratings apply for cooperation. On the other hand, credit scores apply only to individuals and are calculated by agencies such as Equifax, Experian, and TransUnion for the citizens of the United States.

Credit ratings can be short-term or long-term. A short-term credit rating reflects the history of an entity’s rating with respect to recent loan repayments and therefore poses a possibility for this borrower to default with its loan repayment when compared to entities with long-term credit ratings.

Credit rating agencies usually assign alphabet grades to indicate ratings. For example, S&P Global has a credit rating scaling from AAA (excellent) to C and D. They consider a debt instrument with a rating below BB to be a speculative-grade or junk bond, indicating they are more likely to default on loans.

Importance of Credit Ratings

Credit ratings for entities are calculated based on due diligence conducted by the rating agencies. While a borrowing entity will aim to have the highest possible credit rating, the rating agencies aim to take a balanced and objective view of the borrowing entity’s financial situation and capacity to honor/repay the debt. Keeping this in mind, mentioned below are the importance of credit ratings for various entities:

For Lending Entities

Credit ratings give an honest image of a borrowing entity. Since no money lender would want to risk giving their money to a risky entity with a high possibility of default from their part, credit ratings genuinely help money lenders to assess the worthiness of the following entity and the risk associated with that entity, therefore helping them to make better investment decisions. Credit ratings act as a safety guard because higher credit ratings assure the safety of money and timely repayment of the same with interest.

For Borrowing Entities

Since credit ratings provide an honest review of a borrower’s ability to repay a loan, borrowers with high credit ratings find it easier to get loans approved by money lenders at interest rates that are more favorable to them. A considerable rate of interest is very important for a borrowing entity because higher interest rates make it more difficult for a borrower to repay the loan and fulfill their financial obligations. Therefore, maintaining a high credit rating is essential for a borrower as it helps them get a considerable amount of relaxation when it comes to a rate of interest for the loan issued to them. Finally, it is also important for a borrower to ensure that their credit rating has a long history of high rating. Just because a credit rating is all about longevity. A credit rating with a long credit history is viewed as more attractive when compared to a credit rating with a short credit history.

For Investors

Credit ratings play a very crucial role when it comes to a potential investor’s decision to invest or not in a particular bond. Now, investors have different risk natures associated with them. In general, investors, who are generally risk-averse in nature, are more likely to invest in bonds with higher credit ratings when compared to lower credit ratings. At the same time, credit ratings help investors, who are risk lovers to differentiate between bonds that are riskier due to the lower credit ratings and invest in them for higher returns at the risk of higher defaults associated with them. Overall, credit ratings help investors make more informed decisions about their investment schemes.

Related posts on the SimTrade blog

   ▶ Jayati WALIA Credit risk

   ▶ Bijal GANDHI Interest Rates

   ▶ Rodolphe CHOLLAT-NAMY Credit analyst

   ▶ Aamey MEHTA My experience as a credit analyst at Wells Fargo

   ▶ Jayati WALIA My experience as a credit analyst at Amundi Asset Management

   ▶ Louis DETALLE My professional experience as a Credit Analyst at Société Générale

Useful resources

S&P Global Ratings

Moody’s

Fitch Ratings

About the author

Article written in May 2021 by Bijal GANDHI (ESSEC Business School, Grande Ecole Program – Master in Management, 2019-2022).

Bond Markets

Bond markets

Rodolphe Chollat-Namy

In this article, Rodolphe CHOLLAT-NAMY (ESSEC Business School, Grande Ecole Program – Master in Management, 2019-2023) introduces you to bond markets.

The bond market allows the financing of medium and long-term needs of States, local authorities and companies. In return, it offers opportunities to invest medium and long-term financing capacities. In order to understand the bond market, it is necessary to distinguish two markets. The primary market, where bonds are issued, and the secondary market, where they are traded. What are their characteristics?

The primary market

When an organization issues new bonds, it uses the primary bond market, where its securities are acquired by various investors.

The issue price of a bond is expressed as a percentage of the face value of the security. If the issue price is 100%, the price is said to be at par.  If the issue price is above 100%, the price is said to be above par. If the issue price is below 100%, the price is said to be below par.

The nominal interest rate is used to calculate the coupon that will be paid to the bondholder. The interest rate at the issuance date depends on the default risk of the issuer reflecting its financial quality. This default risk is usually evaluated by rating agencies (S&P, Moody’s, Fitch).

There are two principal ways to issue bonds: syndication and auction.

Syndication

Syndication is the most common way to issue debt, widely used by companies, governments and other organizations. Syndication is when several financial institutions join together to ensure the placement of a bond with investors in order to reduce their risk exposure.

In a syndication, there are two types of financial institution: the lead bank, which arranges the transaction and manages the loan syndication, and the so-called “junior” banks, which participate in the transaction without setting the terms.

There are two types of syndication. “Full commitment” is where the lead bank commits to providing the company with the capital it needs and then subcontracts part of the financing to the other members of the syndicate to limit its exposure. “Best effort” is when the amount of the loan is determined by the commitments that the banks are willing to make in a financing transaction.

Auction

Auction is used by governments only. It is their preferred method of issuing sovereign debt. It allows the acquisition of a debt security through an auction system.

The auction can be “open”, i.e. all direct participants in public securities auctions (credit institutions, management and intermediation companies, etc.) have the possibility of acquiring part of the security put up for auction. It can also be “targeted”, i.e. the issue is reserved only for the primary dealers – banks or other financial institutions that has been approved to trade securities – of the issuing State.

A few days before the planned date of an auction, the State makes an announcement, confirming, postponing or cancelling the operation. It also gives the characteristics of the securities to be issued, i.e. the type of securities, the maturity and the amount it wishes to raise. Buyers can then submit several bids, each specifying the desired quantity and price. The issue lines are then auctioned to the highest bidders. The higher the demand is, the lower the issue rate is.

Auction is used because it provides investors, among other things, with transparency and free competition on an investment product with an attractive benefit in relation to a low risk level.

The secondary market

Once issued, a bond can be traded on the secondary bond market. It then becomes a tradable financial instrument, and its price fluctuates over time.

On entering the market, a bond will compete with other bonds. If it offers a higher return than other bonds for the same risk, the bond will be in demand, which will drive up its price. For the most part, transactions are conducted over the counter (OTC). Buyers and sellers interrogate several “market makers” who give them buying or selling prices, and then choose the intermediary who makes the best offer.

A number of bond indices exist for the purposes of managing portfolios and measuring performance, similar to the CAC40 for stocks. The most common American benchmarks are the Barclays Capital Aggregate Bond Index and Citigroup BIG.

A bond is quoted as a percentage of its face value. Thus, if it is trading at 85% of its nominal value of €1,000, it is quoted at €850. In addition, the bond is quoted at the coupon footer, i.e. without the accrued coupon.

The accrued coupon is the interest that has been earned but not yet paid since the most recent interest payment. It is calculated as follows: accrued coupon = (number of days/365) x face rate – with the face rate being the rate on the basis of which interest is calculated at the end of a full year for the nominal value of the bond -.

To better understand this mechanism, let us take an example:

Consider a 6% bond with a nominal value of €1,000, with an entitlement to dividends on 12/31 (coupon payment date). It is assumed that the bond is worth €925 on 09/30.

Gross annual interest: 1,000 x 6% = €60.

The accrued coupon on 09/30 is: 60 x 9/12 = 45 €.

Quotation at the foot of the coupon: 925 – 45 = €880.

Percentage quotation: 880 x 100/ 1000 = 88%.

The quoted price will be: 88%.

In the market, bondholders are subject to risks (interest rate risk, exchange rate risk, inflation risk, credit risk, etc.). We will come back to this in a future article.

Useful resources

Rating agencies

S&P

Moody’s

Fitch Rating

Related posts

   ▶ Rodolphe CHOLLAT-NAMY Bond valuation

   ▶ Rodolphe CHOLLAT-NAMY Bond risks

   ▶ Bijal GANDHI Credit Rating

   ▶ Jayati WALIA Credit risk

About the author

Article written in May 2021 by Rodolphe CHOLLAT-NAMY (ESSEC Business School, Grande Ecole Program – Master in Management, 2019-2023).

The 2007-2008 subprime crisis

The 2007-2008 subprime crisis

Mark Rahme

In this article, Mark RAHME (ESSEC Business School, Global Bachelor of Business Administration, 2017-2021) explores the 2007-2008 subprime crisis.

Finance in 2021 was unlike anything imagined: cryptocurrencies going up and down, vaccines, trading restrictions, … all and all, it is safe to say that the year is a very particular one. Despite the losses and the misericord that the pandemic has brought upon us, perhaps it would be interesting to take a look back at how humanity managed to plummet its financial status without the intervention of an infectious virus. As such, we cannot but invoke the 2007-2008 world financial crisis. So, what are the reasons behind this dark event in financial history?

Front pages from then and now: 14 years apart, yet the same end: financial crash.

The Washington Post: Markets in disarray

Source: The Washington Post.

The Guardian: The economy could shrink

Source: The Guardian.

How ABS was the New Sexy for Bankers:

Starting 2000, the US was experiencing strong economic growth, and so bankers were easing up regulation on giving out loans and advances (corporate, retail, …) seeing things were going well, having as collateral to the real estate or asset bought with the loan. These collaterals were known as Collateralized Debt Obligations (CDO) or Assets Backed Securities (ABS).

Sub-Primers and Primers: Why Give to One, when you can Give to Both?

At the same period, there was a debt increase for real estate appropriation. Effectively, banks started having more structured and different loan offers for housing acquisition. This enabled banks supply more people with loans with the same periodic settlements as the amount of rent they were paying. In other words, instead of paying rent for the house you were in, you could pay the same amount and buy it for no additional cost. This process was spread even more because of the increase in people’s income, resulting from the economic growth. However sometimes loans were granted to individuals who could not afford it. These individuals, who evidently had a high risk of defaulting, were dubbed as “sub-primers”, but were ironically the prime target for bankers. As such, the demand for the real estate increased, thus the price of the houses as well.

It should be noted that, because of the way long term debt contract deals written by banks, loaners were paying the interest payment on their loan first, and their actual loan was to be paid later (while not all loaners were necessarily always aware of this). Despite this, there was no real problem at this point.

Transforming Assets into Financial Vehicles: The Role of SPVs:

Perhaps the real cause of what led to this international crisis was the securitization of Special Product Vehicles (SPV), or the process of externalizing assets into a fund (the SPVs in question) by financial institutions and selling it as shares. The basic idea is that an asset is transformed, or liquidized, into a financial product, that is sold on the market. Effectively, the underlying asset behind the real estate (that is now transformed into a fund) were the credit loans that were used to buy real estate. Naturally, seeing the economic growth, financial institutions that created these funds, like Lehman-Brothers, were promising high returns seeing the high demand for real estate. And so started the sale of financial securities to international investors outside of the US. Banks started adopting an “Originate-to-distribute” model, which involves lenders creating loans with the objective of selling them to other institutions and entities, instead of holding on to them until maturity (originate-and-hold).

Simultaneously, there was:
• A decrease in interest rates in the US from 2000 to 2004:
o 2000: 6.50%
o 2001: 1.75%
o 2002: 1.25%
o 2003: 1.00%

which prompted people to go get even more loans and advances, when they couldn’t particularly afford paying it back.

• An increase in inflation from 2004 to 2006:
o 2004: 2.25%
o 2005: 4.00%
o 2006: 5.00%
o 2007: 5.25%

and it is around this time that interest rates started increasing.

The Final Countdown:

It was finally in 2006 that the US real estate market collapsed because of an economic slowdown due to unemployment increase (so absence or decrease of income, by consequence inability to pay back loans), and the other factors mentioned above (increase of interest rates, inflation rates). This economic slowdown resulted in the inability of loaners to pay back their obligations, and so banks started acquiring and selling the real estate collaterals (CDOs or ABS). But it is because of this sudden “crash” that there was a sharp decrease in the price of real estate. Keeping in mind that financial institutions had created funds (SPVs) deriving from these assets, and that investors from all around the world that had invested and bought shares in these funds, the collapse of the US real estate market was exported to all those investors, which led to the world financial crisis.

This led to a default in the 1st semester of 2007, as well as social crisis in the US (Approx. 1 million of American householders lost their homes and are still indebted). Even a federal bailout of Approx. 700 Billion USD was not enough to avoid the collapse of (like City Bank).

As such, we can summarize the economic reasons of the crisis were inflation, unemployment, interest rates increase, … But the financial reasons were that investors did not care/read about what was behind the funds created by financial institutions like Lehman-Brothers. The investors in question, which included big foreign intuitions did not care on the nature of the funds that were complex and opaque, but rather on the potential returns it presented them. Further, some blame the responsibility of this whole crisis on such financial institutions, without whose intervention, the collapse would have limited exclusively to the housing sector in the US.

Conclusion

One would think that after such an event, it would be sometime until humanity would face another similar economic or financial crisis. Usually, this would be true, as the major crises in the 20th century can be counted on your fingers (The Great Depression of 1929, Petrol Choc of 1973, …), and have some lapse of time between one another. But 21 years into the 21st century, and we have already faced 2 world crises. One could think that Kondratiev would not have come up with his famous wave were he living nowadays.
All and all, hard times will come and go, just as prosperous times will come and go. But the fact remains it is up to us to decide what to do: Opportunities are everywhere, even in dark times. One only has to have the wit and courage to go search for opportunity, and seize it.

Key Concepts to Understand the Subprime Crisis

Subprime and prime borrowers

Subprime indicates having or being an interest rate that is higher than a prime rate and is extended chiefly to a borrower who has a poor credit rating or is judged to be a potentially high risk for default (as due to low income). Lenders classify potential borrowers into two general categories: prime and subprime. Having a credit score between 580 and 669 is considered subprime according to the FICO scale and these borrowers are considered a higher risk to lenders. Prime borrows typically have a score greater than 669 and are consider to have the least risk of defaulting on a credit card or loan. Being a prime borrower makes you an attractive customer for banks and justifies your demand for the lowest possible interest rates. Prime borrowers are generally approved for higher loan amounts, higher credit limits, and lower down payments. In general, a good credit score gives prime borrowers more negotiating power when shopping for a credit card or loan.

Collateralized Debt Obligations (CDO)

A Collateralized Debt Obligation (CDO) is a synthetic investment product that represents different loans bundled together and sold by the lender in the market. The holder of the collateralized debt obligation can, in theory, collect the borrowed amount from the original borrower at the end of the loan period. A collateralized debt obligation is a type of derivative security because its price (at least notionally) depends on the price of some other asset.

Assets Backed Securities (ABS)

Asset-backed securities, also called ABS, are pools of loans that are packaged and sold to investors as securities—a process known as “securitization.” The type of loans that are typically securitized includes home mortgages, credit card receivables, auto loans (including loans for recreational vehicles), home equity loans, student loans, and loans for boats.

Useful Resources

Amadeo, Kimberly (20/10/2020) Subprime Mortgage Crisis and Its Aftermath The Balance.

Dam, Kenneth (2010) The Subprime Crisis and Financial Regulation: International and Comparative Perspectives, University of Chicago Law School.

Kenny, Thomas (01/04/2020) Asset-Backed Securities (ABS) The Balance.

The Corporate Finance Institute: CDO

S&P Global

The Federal Reserve

BSI Economics

Related posts on the SimTrade blog

   ▶ Jayati WALIA Credit risk

   ▶ Raphaël ROERO DE CORTANZE Credit Rating Agencies

   ▶ Bijal GANDHI Credit Rating

About the author

Article written in May 2021 by Mark RAHME (ESSEC Business School, Global Bachelor of Business Administration, 2017-2021).