My experience of Account Manager in the office real estate market in Paris

My experience of Account Manager in the office real estate market in Paris

Photo Clément KEFALAS

In this article, Clément KEFALAS (ESSEC Business School, Global Bachelor of Business Administration, 2021) shares his working experience as an Account Manager at Ubiq.

Ubiq: A company disrupting the market

Ubiq was founded in 2012. At that time, it was known as “Bureaux A Partager” (a French expression meaning “office to share”). This digital startup comes from the brilliant mind of Clément Alteresco when he faced a problem of unoccupied seats in its offices at Fabernovel (a strategic consulting firm). He thought that it was a real waste of space and even if he did not think of making profits from it, he could at least try to create value!

Ubiq logo

Source: Ubiq

This is why, Clément began by conceiving a shared Excel File with a planning and spread it amongst his network. The idea was to enable people to come to work for free in Fabernovel’s office and who knows, maybe creating synergies through exchanges and shared moments. It was then non-lucrative and totally selfless. However, it generated lot of interest and Clément wanted more than a standard employee’s life. Therefore he decided to launch his own digital platform: “Bureaux A Partager”.

The concept was easy: a website on which people would try to find their coworkers or on which people would be looking for their new offices. It was basically the “Airbnb” of the Flex office. You could forget your 3/6/9 bail, now was the time for the day-to-day contract that you could end in less than a month!

Ubiq motto

Source: Ubiq

It worked out well and in 2017, a team of about 15 people were working on the project. Clément then decided to diversify and launched Morning, the main concurrent of Wework in Paris. If he was not working on Bureaux A Partager anymore, the project kept going and became more and more mature.

Needless to say that the Covid crisis hit hard the office real estate market. The home office is definitely a restraint to the rent of offices, it also became a huge opportunity for Ubiq and a big step forward for the Flex office.

Indeed, since March 2020, we have been talking about the new methods of working and about the new role of the office in the world of tomorrow.

It is not a reflex anymore to go to the office on a working day. There must be more than just creating an environment dedicated to work. Now, the workplace is more about generating synergies, bonds and company culture than about providing an efficient and professional atmosphere.

What a great opportunity for a marketplace that offers every kind of offices with every kind of contracts than such a disorganized market which is reinventing itself.

Thus, Bureaux A Partager could not miss such an opportunity! This is why, with the help of its main shareholder, Nexity, Bureaux A Partager changed its name in “Ubiq” in June 2021.
It also changed its value proposition and recruited new talents to carry such an ambitious project.

In July and September 2021, Ubiq peaked with its 2 biggest records of revenues !

My recruitment as an account manager

Thanks to ESSEC, I had the opportunity to join Ubiq (at that time Bureaux A Partager) in January 2020 for a two-year apprenticeship in the sales team. Indeed, in the Global BBA program, the students are allowed to sign a 24 months apprenticeship contract instead of doing a 6 months internship. It results in them making one more semester in a professional environment and thus, ending with a Master 1 Degree in 4,5 years of studies.

This specific path gives the student the opportunity to involve himself in a long-term professional mission. He will get considered by its company as a normal employee and will be responsible for key missions. This is a really professionalizing program that I would definitely recommend. It also has the advantage of being a real asset on the CV when companies are asking for a professional experience longer than a single internship.

The job I was recruited for was: Account Manager. It is a function that is key in every sales team. The Account Manager will be responsible for the existing clients while the Business Developer will seek for new clients.

The main objective is to build a long term, professional, trust-based relationship with its B2B
clients.

Most of the requirements for the job are soft skills. The Account Manager works in Customer service which means that the mission consists mainly in communicating with clients.

Expected skills from the Account Manager would be:

  • curious
  • open-minded
  • motivated
  • excellent interpersonal skills
  • autonomy
  • rigor

In terms of hard skills, the Account Manager must master Excel, understand sales dashboards, write, and talk clearly and professionally.

My experience as an Account Manager

At first, I had to get to learn the job and to understand the market. This is why I was assigned in the prospect team, seeking for new clients willing to find offices. In other words, I was trying to stimulate the traffic on the platform through looking for the demand side of the market. It was not why I had been recruited for and this mission surprised me, but I then understood that it was part of the training. How could I work on the offer side of the market and help our partners to market their real estate assets if I did not understand the need of their own customers? I spent few months in the “Demand” team and if it could be at some point repetitive and tough, it was definitely formative, and helped me a lot in the continuation of my mission.

At some point, I finally reached my final position: account manager towards the Offer. It was mainly business-to-business (B2B) since the actors that wanted to rent their places, were most of the time companies and not private individuals.

The idea of creating a long-term relationship with the clients was really satisfying. Every customer had its own problematic and its own needs and still the final objective remained the same. The path to reach it though, was always different from one company to another.

Most of my interactions were by phone and email but I still had few opportunities to meet my clients. It was always interesting to have a quick talk with them in person. These meetings were most of the time the beginning of a stronger partnership based on mutual trust. Inspiring, I wish I had the opportunity to meet all of my clients this way.

I learned a lot throughout this professional experience.

First, I learned a lot about myself. It is really tough to know if you like customer service until you do it. The first sales call is always frightening and stressful but in the end, it is only a conversation with a stranger. It might not be a good experience but it can’t hurt.

The most satisfying aspect of the job is to see yourself getting better from a sales call to another. After few weeks, you do not ask yourself twice before picking up the phone. It is part of your job and you’re used to it. Unexpected problems might always happen but most of the interactions are smooth. At the end of this 24months apprenticeship, every sales call was a real delight. I knew my speech perfectly, could answer any question and managed to lead the conversation where I needed it to go. Handling the pressure was the trickiest and the funniest part.
Once an Account Manager masters his job, he faces constant self-esteem boosts. Indeed, his daily mission consists in leading discussions in a known environment about a mastered topic and with clients that require his help.

This mission enlightened me on the fact that being good at his job is not about intrinsic skills but more about perseverance. My learning was permanent, and I kept being better and better until my last day.

The different archetypes of clients

Through these two years of customer service, I had the opportunity to talk with many different actors of the office real estate market. My clients were from different ages, gender, origins, etc. And yet, we could classify each of them in four different major types.

The Satisfied

The most pleasant customer and the most common one. The satisfied client enjoys the service proposed by the account manager and has nothing to complain about. He doesn’t always get straight to the point because the Satisfied enjoys exchanging with the account manager. He is a loyal client that will not hesitate to solicit the account manager every time he requires help.

The Negotiator

Nor satisfied or unsatisfied, the negotiator will try to grab any opportunity to find himself a better deal than proposed at first. If it is not through monetary gain, this customer will seek for an exclusive treatment or relationship. At some point, we could be wondering if the final objective is to get a real benefit or just to feel special. If the account manager can most of the time propose a solution to his request, the negotiator would not necessarily end the relationship in a situation of an unmet need.

The Busy

Certainly the most boring customer, this archetype just doesn’t have time to give to the account manager. Every interaction comes with the feeling of bothering the client and thus, the exchanges are really short. Only the required information is given. Once the contract between both parts is signed, the client expects everything to work fine without further interventions. At least there is no waste of time.

The Unsatisfied

Fortunately, this is the profile that is the least met by the account manager. Basically, the client is not happy with our services and whatever the efforts the account manager might try to do, they will never meet the client’s needs. This discontent often comes from a misunderstanding of the partnership or from a request that cannot be fulfilled. Sometimes, the conflict might begin with a mistake from the account manager. Although, once the error is recognized, then everything possible will be done to repair the damage. This is by far the most interesting archetype that requires a lot of patience and diplomacy.

Related posts on the SimTrade blog

   ▶ All posts about Professional experiences

   ▶ Louis DETALLE A quick review of the M&A – Real Estate job…

   ▶ Ghali EL KOUHENE Asset valuation in the Real Estate sector

   ▶ Akshit GUPTA Sales – Job description

   ▶ Suyue MA Expeditionary experience in a Chinese investment banking boutique

   ▶ Raphaël ROERO DE CORTANZE In the shoes of a Corporate M&A Analyst

   ▶ Bijal GANDHI Operating profit

Useful resources

Ubiq www.ubiq.fr

About the author

The article was written in October 2021 by Clément KEFALAS (ESSEC Business School, Global Bachelor of Business Administration, 2021).

For any further information about the office real estate market or about client relationship management, feel free to email Clément Kéfalas at: b00730327@essec.edu.

A New Angle in M&A E-Commerce

A New Angle in M&A E-Commerce

Photo Antoine PERUSAT

In this article, Antoine PERUSAT (ESSEC Business School, Global Bachelor of Business Administration, 2019-2023) shares his working experience as an M&A Analyst at a start-Up.

The Company

Last summer, I worked for two months in London at a company specializing in Venture Capital (VC) of digital assets in the e-commerce market. The company was headed by financial specialists coming from a range of backgrounds such as hedge funds and investment banks. Yet, there were also many on-board programmers with expertise in finance because of prior experience in areas such as algorithmic trading.

The company had recently acquired a website for $1 million. After considering the slim margins attributed to affiliate schemes in which we provided this website’s online traffic on a commission basis, we decided to start backlinking the website to a drop shipping website which provided accessories at ‘cheap’ prices. For instance, we would write posts on the website we acquired, and their active audience would read articles with titles such as “top 10 vision equipment”, and 5 of those 10 would be linked to our drop shipping platform.

My Job as an M&A Analyst

My main job within this startup was to do the financial appraisal and forecasting of the potential of this new drop shipping venture. Obviously the first hindrance was that there were barely any historic data (17 days of data) and prior budgets to leverage in the forecasting.

I shadowed a former PwC Vice President specialized in M&A and I learnt a lot from the ‘learning by doing’ process which is concurrently one of ESSEC’s main values. The forecast and model provided the board of investors with an overview of our cash-generating projects.

All these figures are based on inputs that were placed into the forecasts.

Figure 1 – Forecasts based on 17-day data input values.

GGD Forecasts

Source: GGD Forecasts

My work

The surrounding macro-variables are instrumental to the success of this project because these products are manufactured in China and shipped all the way to the U.S. I drew up a detailed PESTEL specific to arms and its accessories. I chose to make it as detailed as possible by also applying a base scenario, an upside scenario and a downside scenario to the P&Ls which would forecast the next 24 months. I used color coding which is a simple but instrumental and valuable method to present data in a tidy manner: assumptions in blue, hard coded input in blue, drivers in green and formulae in black. Other simplifiers include shortcuts and skills such as not using the mouse. The P&L’s all had to follow the traditional accounting format so that any financial analyst could quickly skim over it without issue. Although it was mainly for the board of investors, they could check back to the detailed sheet if they had further questions.

Figure 2 – Detailed Forecasts (Inputs).

GGD detailed forecasts

Source: GGD Forecasts

This kind of complexity is great if you are willing to put a few hours into studying the forecasts at great length.

Figure 3 – P&L (Upside).

GGD PL

Source: GGD Forecasts

However, this is much faster and simpler. The element of choice is what the investor wants.

Side Projects

The start-up nature of the company meant that I had to complete other tasks than just forecasting. I conducted internal presentations of the company stock option policy to all new recruits. This taught me a lot about the value of equity in a world structured with salaries and bonuses.

Another side project was writing the prospectus of over 300 bicycle websites ranging from forums, magazines, and e-commerce platforms. This prospectus would be used to discover investment opportunities.
Research also formed a substantial part of my internship, and I undertook market research on our e-commerce competitors and their Key Performance Indicators (KPIs) like revenue figures and cash cow assets as well as their different investors and funding in initial rounds.
Here are a few KPIs on who the market leaders are in terms of e-commerce sellers and the materials sold as well as the overall revenue figures of the market.

Figure 4 – Overview of E-commerce competitors in the UK mattress market.

Ecommerce competitors

Source: Company – European Mattress Market Analysis

M&A valuation methods

On my first day during lunch, the Chief Executive Officer (CEO) of the company told me that fundamental analysis and traditional financial evaluation methods were all pretty much useless for our M&A operations. You can imagine this quite shocking to hear as an intern who came in to specialize in M&A, but I understood why he said this soon enough. Most of the prospectus portfolio we were involved with included internet platforms with little historical data (sometimes less than one year) which was of no use. So, from a financial aspect, we would usually just take a multiple of their Earnings Before Interest, Taxes, Depreciation, and Amortization (EBITDA) like X3 and sometimes X4.
To do the valuation work of the different prospects of interest, we would use Ahrefs (Search Engine Optimization audit software).

Figure 5. Ahrefs Audit Software.

Ahrefs Audit Softwares

Source: https://www.blogdumoderateur.com/tools/ahrefs/

Not only is this a great tool in order to see how lucrative the acquisition is but its true value came into play after the acquisition. We could see general KPI’s such as traffic value and portfolio website health so that we could apply the required SEO mechanisms to maximize the investment’s value.

Final Message

My main message is that we mainly all come from academic institutions and families which force us down a structured and standardized route. For example, in finance, you can usually kick off your career in a range of routes like asset management, investment banking, trading, etc. The growth in new-age financial roles may incorporate more risk exposure in your career but they can provide a more stimulating and rewarding route!

Related posts on the SimTrade blog

   ▶ All posts about Professional experiences

   ▶ Raphaël ROERO DE CORTANZE In the shoes of a Corporate M&A Analyst

   ▶ Suyue MA Expeditionary experience in a Chinese investment banking boutique

   ▶ Anna BARBERO Career in finance

Useful resources

Ahrefs

WallStreetOasis (WSO) Financial Modeling Best Practices: Color Conventions

SPS commerce E-Commerce and the New Age of Retail

Le coin des Entrepreneurs Analyse PESTEL : définition, utilité et présentation des 6 composants (in French)

Philippe Gattet Comprendre l’analyse PESTEL Xerfi video (in French).

About the author

The article was written in October 2021 by Antoine PERUSAT (ESSEC Business School, Global Bachelor of Business Administration, 2019-2023).

Programming Languages for Quants

Programming Languages for Quants

Jayati WALIA

In this article, Jayati WALIA (ESSEC Business School, Grande Ecole Program – Master in Management, 2019-2022) presents an overview of popular programming languages used in quantitative finance.

Introduction

Finance as an industry has always been very responsive to new technologies. The past decades have witnessed the inclusion of innovative technologies, platforms, mathematical models and sophisticated algorithms solve to finance problems. With tremendous data and money involved and low risk-tolerance, finance is becoming more and more technological and data science, blockchain and artificial intelligence are taking over major decision-making strategies by the power of high processing computer algorithms that enable us to analyze enormous data and run model simulations within nanoseconds with high precision.

This is exactly why programming is a skill which is increasingly in demand. Programming is needed to analyze financial data, compute financial prices (like options or structured products), estimate financial risk measures (like VaR) and test investment strategies, etc. Now we will see an overview of popular programming languages used in modelling and solving problems in the quantitative finance domain.

Python

Python is general purpose dynamic high level programming language (HLL). It’s effortless readability and straightforward syntax allows not just the concept to be expressed in relatively fewer lines of code but also makes it’s learning curve less steep.

Python possesses some excellent libraries for mathematical applications like statistics and quantitative functions such as numpy, scipy and scikit-learn along with the plethora of accessible open source libraries that add to its overall appeal. It supports multiple programming approaches such as object-oriented, functional, and procedural styles.

Python is most popular for data science, machine learning and AI applications. With data science becoming crucial in the financial services industry, it has consequently created an immense demand for Python, making it a programming language of top choice.

C++

The finance world has been dominated by C++ for valid reasons. C++ is one of the essential programming languages in the fintech industry owing to its execution speed. Developers can leverage C++ when they need to programme with advanced computations with low latency in order to process multiple functions fasters such as in High Frequency Trading (HFT) systems. This language offers code reusability (which is crucial in multiple complex quantitative finance projects) to programmers with a diverse library comprising of various tools to execute.

Java

Java is known for its reliability, security and logical architecture with its object-oriented programming to solve complicated problems in the finance domain. Java is heavily used in the sell-side operations of finance involving projects with complex infrastructures and exceptionally robust security demands to run on native as well as cross-platform tools. This language can help manage enormous sets of real-time data with the impeccable security in bookkeeping activity. Financial institutions, particularly investment banks, use Java and C# extensively for their entire trading architecture, including front-end trading interfaces, live data feeds and at times derivatives’ pricing.

R

R is an open source scripting language mostly used for statistical computing, data analytics and visualization along with scientific research and data science. R the most popular language among mathematical data miners, researchers, and statisticians. R runs and compiles on multiple platforms such as Unix, Windows and MacOS. However, it is not the easiest of languages to learn and uses command line scripting which may be complex to code for some.

Scala

Scala is a widely used programming language in banks with Morgan Stanley, Deutsche Bank, JP Morgan and HSBC are among many. Scala is particularly appropriate for banks’ front office engineering needs requiring functional programming (programs using only pure functions that are functions that always return an immutable result). Scala provides support for both object-oriented and functional programming. It is a powerful language with an elegant syntax.

Haskell and Julia

Haskell is a functional and general-purpose programming language with user-friendly syntax, and a wide collection of real-world libraries for user to develop the quant solving application using this language. The major advantage of Haskell is that it has high performance, is robust and is useful for modelling mathematical problems and programming language research.

Julia, on the other hand, is a dynamic language for technical computing. It is suitable for numerical computing, dynamic modelling, algorithmic trading, and risk analysis. It has a sophisticated compiler, numerical accuracy with precision along with a functional mathematical library. It also has a multiple dispatch functionality which can help define function behavior across various argument combinations. Julia communities also provide a powerful browser-based graphical notebook interface to code.

Related posts on the SimTrade blog

   ▶ Jayati WALIA Quantitative Finance

   ▶ Jayati WALIA Quantitative Risk Management

   ▶ Jayati WALIA Value at Risk

   ▶ Akshit GUPTA The Black-Scholes-Merton model

Useful Resources

Websites

QuantInsti Python for Trading

Bankers by Day Programming languages in FinTech

Julia Computing Julia for Finance

R Examples R Basics

About the author

The article was written in October 2021 by Jayati WALIA (ESSEC Business School, Grande Ecole Program – Master in Management, 2019-2022).

Decentralized finance (DeFi)

Decentralized finance (DeFi)

Youssef EL QAMCAOUI

In this article, Youssef EL QAMCAOUI (ESSEC Business School, Master in Strategy & Management of International Business (SMIB), 2020-2021) discusses decentralized finance (DeFi).

From cryptocurrencies to decentralized finance

As you may know, Bitcoin is a form of money (cryptocurrency) that isn’t controlled by any central bank or government. It can be transferred to anyone from anyone around the world, without the need of a bank or a financial institution. Bitcoin is decentralized money.

However, transferring money is only the first of many building blocks in a financial system. Aside from sending money to one another, there are a variety of financial services we use today. For example, loans, saving plans, insurance and stock markets are all services that are built around money and together create our financial system.

Today, our financial system and all its services are completely centralized. Banks, stock markets, insurance companies and other financial institutions all have someone in charge, whether it be a company or a person, that controls and offers these services. This centralized financial system has its risks – mismanagement, fraud and corruption to name a few. But what if we could decentralize the financial system as a whole in the same way Bitcoin decentralized money?

That’s exactly what DeFi is all about. DeFi is a term given to financial services that have no central authority or someone in charge. Using decentralized money, like some cryptocurrencies, that can also be programmed for automated activities, we can build exchanges, lending services, insurance companies and other organizations that don’t have any owner and aren’t controlled by anyone.

How to build decentralized finance

Platform based on Ethereum

In order to create a decentralized financial system, the first thing we need is an infrastructure for programming and running decentralized services. That is the main objective of Ethereum. Ethereum is a Do-It-Yourself platform for writing decentralized programs also known as decentralized apps. By using Ethereum we can write automated code, also known as smart contracts, that manage any financial service we’d like to create in a decentralized manner. This means that we determine the rules as to how a certain service will work, and once we deploy those rules on the Ethereum network, we no longer have control over them – they are immutable.

Once we have a system in place like Ethereum for creating decentralized apps, we can start building our decentralized financial system.

Now let’s take a look at some of the building blocks that comprise it. The first thing any financial system needs is of course money. “why not use Bitcoin or Ether, which is Ethereum’s currency?” Whilst Bitcoin is indeed decentralized, it has only very basic programmable functionality and is not compatible with the Ethereum platform. Ether, on the other hand, is compatible and programmable. However, it is also highly volatile.

Figure 1 presents a map of the DeFi ecosystem broken down by category: payments, custodial services, infrastructure, exchanges and liquidity, investing, know you customer (KYC) and identity, derivatives, marketplaces, stablecoins, prediction markets, insurance, and credit and lending.

Figure 1. A map of the DeFi ecosystem, broken down by category.

Ethereum’s DeFi
Source: The Block

Stablecoins

If we’re looking to build reliable financial services that people will want to use, we’ll need a more stable currency to operate within this system. This is where stablecoins come in. Stablecoins are cryptocurrencies that are pegged to the value of a real-world asset, usually some major currency like the US dollar.

For the purpose of DeFi, we’ll want to use a stablecoin that doesn’t use fiat money reserves for maintaining a peg, since this will require some sort of central authority. This is where the stablecoin DAI comes into play. DAI is a decentralized cryptocurrency pegged against the value of the US dollar, meaning one DAI equals one US dollar. Unlike other popular stablecoins whose value is backed directly by US Dollar reserves, DAI is backed by crypto collaterals that can be viewed publicly on the Ethereum blockchain. DAI is over collateralized, meaning if you lock up in a deposit $1 worth of Ether, you can borrow 66 cents worth of DAI. As soon as you want your Ether back, just pay back the DAI you borrowed and the Ether will be released.

If you don’t have any Ether to lock up as collateral, you can just buy DAI on an exchange. Because DAI is over collateralized, even if Ether’s price becomes extremely volatile, the value of the locked Ether backing the DAI in circulation will most likely still remain at 100% or more. In essence, the DAI stablecoin is actually also a smart contract that resides on the Ethereum platform. This makes DAI a truly a decentralized stablecoin which cannot be shut down nor censored, hence it’s a perfect form of money for other DeFi services.

Financial ecosystem

Now that our decentralized financial system has stable decentralized money, it’s time to create some additional services. The first use case that we’ll discuss is the decentralized exchange (DEX). DEXes operate according to a set of rules, or smart contracts, that allow users to buy, sell, or trade cryptocurrencies. Just like DAI they also reside on the Ethereum platform which means they operate without a central authority. When you trade on a DEX, there is no exchange operator, no sign-ups, no identity verification, and no withdrawal fees. Instead, the smart contracts enforce the rules, execute trades, and securely handle funds when necessary. Also, unlike a centralized exchange, there’s often no need to deposit funds into an exchange account before conducting a trade. This eliminates the major risk of exchange hacking which exists for all centralized exchanges. But the range of decentralized financial services doesn’t stop there. When it comes to decentralized money markets – services that connect borrowers with lenders – Compound is an Ethereum based borrowing and lending decentralized app. This means you can lend your crypto out and earn interest on it. Alternatively, maybe you need some money to pay the rent or buy groceries, but the only funds you have are cryptocurrencies. If that’s the case you can deposit your crypto as collateral and borrow against it. The Compound platform automatically connects the lenders with borrowers, enforces the terms of the loans, and distributes the interest. The process of earning interest on cryptocurrencies has become extremely popular lately, giving rise to “yield farming” – A term given to the effort of putting crypto assets to work while seeking to generate the most returns possible.

So we have decentralized stablecoins, decentralized exchanges and decentralized money markets.

How about decentralized insurance?

All of these new financial products definitely entail some risks. That is where insurance comes in in case something goes wrong: a decentralized platform that connects people who are willing to pay for insurance with people who are willing to insure them for a premium, while everything happens autonomously without any insurance company or agent in the middle, DeFi services work in conjunction with one another, making it possible to mix and match different services to create new and exciting opportunities.

DeFi: money legos

The term ‘money legos’ has been coined to refer to DeFi services as it reminds of building structures out of Lego blocks. For example, you can build the following service from different money legos:

  • You start out by using a decentralized exchange aggregator to find the exchange with the best rate for swapping Ether for DAI.
  • You then select the DEX you want and conduct the trade. Then you lend the DAI you received to borrowers to earn interest.
  • Finally, you can add insurance to this process to make sure you’re covered in case anything goes wrong.

That’s just one example out of the many opportunities DeFi offers. Some of the main advantages that have driven interest towards DeFi are understandably transparency, interoperability, decentralization, free for all services and flexible user experience, among others. However, there are also some risks you should be aware of. The most important risk is that DeFi is still in its infancy, and this means that things can go wrong due to operational risks. Smart contracts have had issues in the past where people didn’t define the rules for certain services correctly and hackers found creative ways to exploit existing loopholes in order to steal money.

Additionally, you should remember that a system is decentralized only as its most central component. This means that some services may be only partially decentralized while still keeping some centralized aspects that can act as a weakness to the project. It’s important to understand exactly how a product or service works before investing in it so you can be aware of any issues that may come up.

Conclusion

To sum it up, it seems that the DeFi revolution has reached its early adopter stage and the coming years will tell if it manages to cross the chasm into mainstream adoption. There’s no doubt that a decentralized financial system can benefit a huge portion of the population that currently suffers from financial discrimination, high fees, and inefficiencies in managing their funds.

Why should I be interested in this post?

This might be of interest to you if you are trying to get to know the ecosystem of Decentralized Finance and you are interested in cryptocurrencies and getting slowly your assets out of the traditional centralized finance (banks, fund managements, etc.).

Related posts on the SimTrade blog

   ▶ Alexandre VERLET Cryptocurrencies

   ▶ Alexandre VERLET The NFTs, a new gold rush?

Useful resources

Forbes Decentralized finance will change your understanding of financial systems

Investopedia Decentralized finance

The conversation What is decentralized finance? An expert on bitcoins and blockchains explains the risks and rewards of DeFi

The Financial Times (29/12/2019) DeFi movement promises high interest but high risk

About the author

The article was written in October 2021 by Youssef EL QAMCAOUI (ESSEC Business School, Master in Strategy & Management of International Business (SMIB), 2020-2021).

The Warren Buffett Indicator

The Warren Buffett Indicator

Youssef EL QAMCAOUI

In this article, Youssef EL QAMCAOUI (ESSEC Business School, Master in Strategy & Management of International Business (SMIB), 2020-2021) discusses the Warren Buffett Indicator.

It is no secret that stock prices are all-time highs and people have been asking the important question: are we in a stock market bubble? According to the Warren Buffett Indicator, the answer to that question is YES.

Let’s discuss what exactly the Warren Buffett Indicator is, why it is showing that this stock market is the most overvalued in history and why the stock market would have to fall by more than 50% to be considered fairly valued based on historical averages.

Definition and origin of the Warren Buffett Indicator

The Warren Buffett Indicator is defined as the ratio between the US Wilshire 5000 index to US Gross Domestic Product (GDP). In other words, it is the American stock market valuation to US GDP divided by the size of the American economy.

It is used to determine how cheap or expensive the stock market is at a given point in time. It was named after the legendary investor Warren Buffett who called in 2001 the ratio “the best single measure of where valuations stand at any given moment”. It is widely followed by the financial media and investors as a valuation measure for the US stock market and has hit an all-time high in 2021.

To calculate the Warren Buffett Indicator, we need to get data for both metrics: the US Wilshire 5000 index and the US GDP.

The US Wilshire 5000 index

To determine the total stock market value of the US, Warren Buffett uses the Wilshire 5000 index. This index is a broad-based market capitalization weighted index composed of 3,451 publicly traded companies that meet the following criteria:

  • The companies are headquartered in the United States.
  • The stocks are listed and actively traded on a US stock exchange.
  • The stocks have pricing information that is widely available to the public.

The Wilshire 5000 index is a better measure of the total value of the US stock market than other more popular stock market indices such as the S&P500 the Dow Jones or the NASDAQ. In the case of the S&P500, it only measures the 500 largest US companies. The Dow Jones has only 30 component companies and the NASDAQ consists of mostly tech companies and excludes companies listed on the NYSE. On the other hand, the Wilshire 5000 is often used as a benchmark for the entirety of the US stock market and is widely regarded as the best single measure of the overall US equity market.

In 2021, the market capitalization of the Wilshire 5000 is approximately 47.1 trillion dollars.

The US GDP

The US GDP which represents the total production of the US economy. It is measured quarterly by the US Government’s Bureau of Economic Analysis. The GDP is a static measurement of prior economic activity meaning it does not forecast the future or include any expectation or evaluation of future economic activity or growth. In 2021, the US GDP is 22.7 trillion dollars.

The Warren Buffett Indicator

Knowing the value of the US Wilshire 5000 index and the value of the US GDP, we can compute the value of the Warren Buffett Indicator:

(47.1 / 22.7)*100 = 207.5%.

Without any historical context this number doesn’t say anything so let’s dive into it.

Evolution of the Warren Buffett Indicator

Figure 1 gives the evolution of the Warren Buffett Indicator over the period 1987-2021. This figure underlines how extremely high the Warren Buffett Indicator currently is compared to historical averages.

Figure 1. The Warren Buffett Indicator (1987-2021).

 History Warren Buffet Indicator
Source: www.longtermtrends.net

The Warren Buffett Indicator at 207% is tremendously higher than periods that turned out to be huge market bubbles such as “.com” bubble in March of 2000 where the Warren Buffett Indicator topped out at 140%. Even at the top of the housing bubble in October 2007 looks significantly tame at 104% compared to today’s level of nearly double that.

Since 1970, the average Warren Buffett Indicator reading has been at around 85%. In fact, for the stock market to be considered fairly valued based on historical averages, the total value of the stock market would have to fall to 19.3 trillion, far from the current value of 47.1 trillion. This means it would take a 60% stock market crash for the Warren Buffett Indicator to fall back to its historical average of 85%.

Use of the Warren Buffett Indicator for investment

But what does this mean for future investing returns? Over the last 10 years the S&P500 returns have been extremely strong at an average of 12.5% per year – well above historical trends.

Let’s look at how Warren Buffett used the thinking around the Warren Buffett Indicator to help make predictions about future returns from the stock market during these crazy times. Warren Buffett has been known to be hesitant about making predictions about the stock market but there have been a few times where Buffett used the Warren Buffett Indicator to help make accurate predictions about the future returns of the stock market in November 1999 when the Dow Jones was at 11,000 – and just a few months before the burst of the dot-com bubble – the stock market gained 13% a year from 1981 to 1998. The Warren Buffett Indicator was at 130% significantly higher than ever before in the past 30 years.

Warren Buffett said at the time that 13% return is impossible if you strip out the inflation component from this nominal return which you would need to do. However, inflation fluctuates that’s 4% in real terms and if 4%.

Two years after the November 1999 article when the Dow Jones was down to 9,000, Warren Buffett stated: “I would expect now to see long-term returns somewhat higher [around] 7% after costs”. He revised his expectations for future returns higher because the Warren Buffett Indicator had come down significantly from its high of 130% in November 1999 to 93% just two years later – meaning stocks were more fairly valued and as a result prospective future returns were higher.

In October 2008, after the S&P500 had fallen from a high of greater than 1,500 in July 2007 to around 900, Warren Buffett wrote “Equities will almost certainly outperform cash over the next decade probably by a substantial degree. At that moment, the indicator was at around 60%. This was not a popular prediction and people were selling out of stocks because they were worried about the future. They had seen stock prices fall consistently and wanted to sell out of stocks before they kept falling more. Since Warren Buffett made this call in October 2008, the S&P500 has returned an average annualized return of 14.7% with dividends reinvested. This return is significantly higher than the long-term historical return of the stock market.

To grasp the Warren Buffett Indicator has been a good gauge of future stock market returns, it is needed to understand the reason stocks can’t rise 25% or more a year forever. This is because over the long term, stock market returns are determined by the following:

Interest rate

The higher the interest rate, the greater the downward pole. This is because the rate of return that investors need from any kind of investment is directly tied to the risk-free rate that they can earn from government securities. As Warren Buffett explained: “If the government rate rises the prices of all other investments must adjust downward to a level that brings their expected rates of return into line. If government interest rates fall, the dynamic pushes the prices of all other investments upward”.

Long-term growth of corporate profitability

Over the long-term, corporate profitability reverts to its long-term trend (~6%). During recessions, corporate profit margins shrink and during economic growth periods corporate profit margins expand. Nonetheless, long-term growth of corporate profitability is closely tied to long-term economic growth.

Current market valuation

Over the long run, stock market valuation tends to revert to its historical average. A higher current valuation certainly correlates with lower long-term returns in the future. On the other hand, a lower current valuation correlates with a higher long-term return.

Discussion

That being said there are some points that we add to discuss this perspective.

Historically low interest rates

Figure 2 represents the history of interest rates in the US for the period 1960-2021.

Figure 2. History of interest rates in the US.

History US interest rates
Source: www.macrotrends.net

This figure shows that the current interest rate on 10-year US government bonds has never been so low. This extremely low level of interest rates partially helps to explain the high stock market valuation by historical standards. As Warren Buffet stated: “As interest rates rise stocks become less valuable and as interest rates decrease stock prices increase all else being equal”.

Companies are staying private for longer

As companies stay private for longer, these companies are not included in the value of the stock market. If these companies had decided to go public, the market cap of Wilshire 5000 would be higher as the index currently contains around 3,500 stocks. Since this index only counts publicly traded companies, if large non-publicly traded companies were also included in the value of the index, the value of the Warren Buffet Indicator would increase – although likely not by a large enough factor.

Why should I be interested in this post?

You might be interested in this topic if you are aware or are trying to get knowledge around the stock market and the possible crash that is being discussed in 2021. This might help you understand what the current situation is and why we are talking about this. But it also gives you insights to understand how important this topic can become in the very near future.

Useful resources

Data to compute the Warren Buffett Indicator

Federal Reserve Economic Data US GDP

Federal Reserve Economic Data Wilshire 5000 Full Cap Price Index

Other

Wilshire www.wilshire.com

Current market valuation Buffet Indicator

Related posts on the SimTrade blog

   ▶ Bijal GANDHI Gross Domestic Product (GDP)

   ▶ Rayan AKKAWI Warren Buffet and his basket of eggs

About the author

The article was written in October 2021 by Youssef EL QAMCAOUI (ESSEC Business School, Master in Strategy & Management of International Business (SMIB), 2020-2021).

Smart Beta industry main actors

Youssef_Louraoui

In this article, Youssef LOURAOUI (ESSEC Business School, Global Bachelor of Business Administration, 2017-2021) presents the main actors of the smart beta industry, which is estimated to represent a cumulative market value of $1.9 trillion as of 2017 and is projected to grow to $3.4 trillion by 2022 (BlackRock, 2021).

The structure of this post is as follows: we begin by presenting an overview of the smart beta industry actors. We will then discuss the case of BlackRock, the 10 trillion dollar powerhouse of the asset management industry, which is the main actor in the smart beta industry segment.

Overview of the market

The asset management sector, which is worth 100 trillion dollars worldwide, is primarily divided into active and passive management (BCG, 2021). While active management continues to dominate the market, passive management’s proportion of total assets under managed (AUM) increased by 4 percentage points between 2008 and 2019, reaching 15%. This market transition is even more dramatic in the United States, where passive management accounted for more than 40% of the total market share in 2019. A new category has arisen and begun to acquire market share over the last decade. Smart beta exchange-traded funds (ETFs) are receiving fresh inflows and are the industry’s fastest-growing ETF product. Various players are entering the market by developing and releasing new products (Deloitte, 2021).

Active funds have demonstrated divergent returns when compared to passive funds, making the cost difference increasingly difficult to justify (Figure 1). The growing market share of passive funds in both the United States and the European Union is putting further pressure on active managers’ fees. When it comes to meeting the demands of investors, both active and passive management has shown shortcomings. Active management funds often fail to outperform their benchmarks because they lack clear indicators, charge expensive fees, and don’t always have clear indicators. As seen in Figure 1, active funds struggle to deliver consistent returns over a prolonged timeframe, as depicted in the European market. In this sense, the active funds success rate is divided by more than half between year one and year three (Deloitte, 2021). Concentration is a problem for passive funds that are weighted by market capitalization.. These limits have prepared the ground for smart beta funds to emerge (Figure 1).

Figure 1. Active funds success rates (% of funds beating their index over X years)
Active funds success rates
Source: Deloitte (2021).

The smart beta market is dominated by several players who have a strategic position with a large volume of assets under management. Figure 2 compares smart beta actors based on percentage of asset under management (%AUM), one the most important metric in the asset management industry. Some key elements can be drawn for the first figure. BlackRock is the provider with the largest market share, with over 40% of the smart beta industry in the analysis, followed by Vanguard and State Street Global Advisors with 30.66% and 18.44% respectively in this benchmark study underpinning nearly $1 trillion (Figure 2).

Figure 2. % AUM of the biggest Smart Beta ETF providers
Smart_Beta_benchmark_analysis
Source: etf.com (2021).

BlackRock dominance

The main powerhouses of the passive investing industry, BlackRock and Vanguard, are poised to capture the lion’s share of assets in the rapidly rising world of actively managed exchange-traded funds. The conclusion is likely to dissatisfy active fund managers, who have been squeezed by the fast development of passive ETFs in recent years and may have seen the introduction of active ETFs as a chance to fight back and get a piece of the lucrative pie (Financial Times, 2021).

According to a study of 320 institutional investors with a combined $12.9 trillion in assets, institutional investors prefer BlackRock and Vanguard to handle their active ETF investments. The juggernauts were expected to provide the best performance as well as the best value for money. With over a third of the global ETF market capitalization, BlackRock remains the dominant player (The Financial Times, 2021). BlackRock is unquestionably a major force in the ETF business, with an unparalleled market share in both the US and European ETF markets. BlackRock has expanded to become the world’s largest asset manager, managing funds for everyone from pensioners to oligarchs and sovereign wealth funds. It is now one of the largest stockholders in practically every major American corporation — as well as a number of overseas corporations. It is also one among the world’s largest lenders to businesses and governments.

Aladdin, the company’s technological platform, provides critical wiring for large portions of the worldwide investing industry. By the end of June this year, BlackRock was managing a stunning $9.5 trillion in assets, a sum that would be hardly understandable to most of the 35 million Americans whose retirement accounts were managed by the business in 2020. If the current rate of growth continues, BlackRock’s third-quarter reports on October 13 might disclose that the company’s market capitalization has surpassed $10 trillion. It’s expected to have surpassed that mark by the end of the year (FT, 2021). To put this in perspective, it is about equivalent to the worldwide hedge fund, private equity, and venture capital industries combined.

Industry-wide fee cuts had helped BlackRock maintain its dominance in the ETF sector. Its iShares brand is the industry’s largest ETF provider for both passive and actively managed products (CNBC, 2021).

Why should I be interested in this post?

If you are a business school or university undergraduate or graduate student, this content will help you in understanding the various evolutions of asset management throughout the last decades and in broadening your knowledge of finance.

Smart beta funds have become a trending topic among investors in recent years. Smart beta is a game-changing invention that addresses an unmet need among investors: a higher return for lower risk, net of transaction and administrative costs. In a way, these investment strategies create a new market. As a result, smart beta is gaining traction and influencing the asset management industry.

Related posts on the SimTrade blog

Factor investing

   ▶ Youssef LOURAOUI Factor Investing

   ▶ Youssef LOURAOUI Origin of factor investing

   ▶ Youssef LOURAOUI MSCI Factor Indexes

   ▶ Youssef LOURAOUI Smart beta 1.0

   ▶ Youssef LOURAOUI Smart beta 2.0

Factors

   ▶ Youssef LOURAOUI Size Factor

   ▶ Youssef LOURAOUI Value Factor

   ▶ Youssef LOURAOUI Yield Factor

   ▶ Youssef LOURAOUI Momentum Factor

   ▶ Youssef LOURAOUI Quality Factor

   ▶ Youssef LOURAOUI Growth Factor

   ▶ Youssef LOURAOUI Minimum Volatility Factor

Useful resources

Business analysis

BlackRock, 2021.What is factor investing?

BCG, 2021.The 100$ Trillion Machine: Global Asset Management 2021

CNBC, 2021. What Blackrock’s continued dominance means for other ETF issuers.

Deloitte, 2021. Will smart beta ETFs revolutionize the asset management industry? Understanding smart beta ETFs and their impact on active and passive fund managers

Etf.com, 2021.Smart Beta providers

Financial Times (13/09/2020) BlackRock and Vanguard look set to extend dominance to active ETFs

Financial Times (07/10/2021) The ten trillion dollar man: how Larry Fink became king of Wall St

About the author

The article was written in October 2021 by Youssef LOURAOUI (ESSEC Business School, Global Bachelor of Business Administration, 2017-2021).

MSCI Factor Indexes

Youssef_Louraoui

In this article, Youssef LOURAOUI (ESSEC Business School, Global Bachelor of Business Administration, 2017-2021) presents the MSCI Factor Indexes. MSCI is one of the most prominent actors in the indexing business, with approximately 236 billion dollars in assets benchmarked to the MSCI factor indexes.

The structure of this post is as follows: we begin by introducing MSCI Factor Indexes and the evolution of portfolio performance. We then delve deeper by describing the MSCI Factor Classification Standards (FaCS). We finish by analyzing factor returns over the last two decades.

Definition

Factor

A factor is any component that helps to explain the long-term risk and return performance of a financial asset. Factors have been extensively used in portfolio risk models and in quantitative investment strategies, and documented in academic research. Active fund managers use these characteristics while selecting securities and constructing portfolios. Factor indexes are a quick and easy way to get exposure to several return drivers. Factor investing aims to obtain greater risk-adjusted returns by exposing investors to stock features in a systematic way. Factor investing isn’t a new concept; it’s been utilized in risk models and quantitative investment techniques for a long time. Factors can also explain a portion of fundamental active investors’ long-term portfolio success. MSCI Factor Indexes use transparent and rules-based techniques to reflect the performance characteristics of a variety of investment types and strategies (MSCI Factor Research, 2021).

Performance analysis

Understanding portfolio returns is crucial to determining how to evaluate portfolio performance. It may be traced back to Harry Markowitz’s pioneering work and breakthrough research on portfolio design and the role of diversification in improving portfolio performance. Investors did not discriminate between the sources of portfolio gains throughout the 1960s and 1970s. Long-term portfolio management was dominated by active investment. The popularity of passive investment as an alternative basis for implementation was bolstered by finance research in the 1980s. Through passive allocation, investors began to effectively capture market beta. Investors began to perceive factors as major determinants of long-term success in the 2000s (MSCI Factor Research, 2021). Figure 1 presents the evolution of portfolio performance analysis over time: until the 1960s, based on the CAPM model, returns were explain by one factor only: the market return. Then, the market model was used to assess active portfolio with the alpha measuring the extra performance of the fund manager. Later on in the 2000s, the first evaluation model based on the market factor was augmented with other factors (size, value, etc.).

Figure 1. Evolution of portfolio performance analysis.
Evolution_portfolio_performance
Source: MSCI Research (2021).

MSCI Factor Index

MSCI Factor Classification Standards (FaCS) establishes a standard vocabulary and definitions for factors so that they may be understood by a wider audience. MSCI FaCS is comprised of 6 Factor Groups and 14 factors and is based on MSCI’s Barra Global Equity Factor Model (MSCI Factor Research, 2021) as shown in Table 1.

Table 1 Factor decomposition of the different factor strategies.
MSCI_FaCS
Source: MSCI Research (2021).

The MSCI Factor Indexes are based on well-researched academic studies. The MSCI Factor Indexes were identified and developed based on academic results, creating a unified language to describe risk and return via the perspective of factors (MSCI Factor Research, 2021).

Performance of factors over time

Figure 2 compares the MSCI factor indexes’ performance from 1999 to May 2020. All indexes are rebalanced on a 100-point scale to ensure consistency in performance and to facilitate factor comparisons. Over a two-decade period, smart beta factors have all outperformed the MSCI World index, with the MSCI World Minimum Volatility Index as the most profitable factor which has consistently provided excess profits over the long run while (MSCI Factor research, 2021).

Figure 2. Performance of MSCI Factor Indexes during the period 1999-2017.
MSCI_performance
Source: MSCI Research (2021).

Individual factors have consistently outperformed the market over time. Figure 2 represents the performance of the MSCI Factor Indexes for the last two decades compared to the MSCI ACWI, which is MSCI’s flagship global equity index and is designed to represent the performance of large- and mid-cap stocks across 23 developed and 27 emerging markets.

It is possible to make some conclusions regarding the performance of the investment factor over the previous two decades by dissecting the performance of the various factorial strategies. The value factor was the one that drove performance in the first decade of the 2000s. This outperformance is characterized by a movement towards more conservative investment in a growing market environment. The dotcom bubble crash resulted in a bear market, with the minimal volatility approach helping to absorb market shocks in 2002. When it comes to the minimal volatility approach, it is evident that it is highly beneficial during moments of high volatility, acting as a viable alternative to hedging one’s stock market exposure and moving into more safe-haven products. Several times of extreme volatility may be recognized, including the dotcom boom, the US subprime crisis, and the European debt crisis as shown in Figure 3.

Figure 3. Table of performance of MSCI Factor Indexes from 1999-2017.
MSCI_historical_performance
Source: MSCI Research (2021).

Why should I be interested in this post?

If you are a business school or university undergraduate or graduate student, this content will help you in understanding the evolution of asset management throughout the last decades and in broadening your knowledge of finance.

Smart beta funds have become a trending topic among investors in recent years. Smart beta is a game-changing invention that addresses an unmet need among investors: a higher return for lower risk, net of transaction and administrative costs. In a way, these investment strategies create a new market. As a result, smart beta is gaining traction and influencing the asset management industry.

Related posts on the SimTrade blog

Factor investing

   ▶ Youssef LOURAOUI Factor Investing

   ▶ Youssef LOURAOUI Origin of factor investing

   ▶ Youssef LOURAOUI Smart beta 1.0

   ▶ Youssef LOURAOUI Smart beta 2.0

Factors

   ▶ Youssef LOURAOUI Size Factor

   ▶ Youssef LOURAOUI Value Factor

   ▶ Youssef LOURAOUI Yield Factor

   ▶ Youssef LOURAOUI Momentum Factor

   ▶ Youssef LOURAOUI Quality Factor

   ▶ Youssef LOURAOUI Growth Factor

   ▶ Youssef LOURAOUI Minimum Volatility Factor

Useful resources

Business analysis

MSCI Factor Research, 2021.MSCI Factor Indexes

MSCI Factor Research, 2021. MSCI Factor Classification Standards (FaCS)

About the author

The article was written in October 2021 by Youssef LOURAOUI (ESSEC Business School, Global Bachelor of Business Administration, 2017-2021).

Carbon Disclosure Rating

Carbon Disclosure Rating

Anant Jain

In this article, Anant JAIN (ESSEC Business School, Grande Ecole Program – Master in Management, 2019-2022) talks about Carbon Disclosure Rating.

Introduction

Carbon disclosure rating (CDR) is a medium to measure the environment sustainability of a company. It is calculated based on the voluntarily disclosure by a company itself. This rating is useful for an ethical investor who wish to incorporate environmental, social, and governance (ESG) factors into their investment decision making process. It focuses on the environmental factor.

Environmental, social, and governance (ESG) criteria constitute a framework that helps socially conscious investors to screen potential investments which incorporate their personal values/agendas. The ESG criteria screen companies based on sound environmental practices, healthy social responsibilities and moral governance initiatives into their corporate policies and daily operations.

The most commonly used carbon disclosure rating is administered by Carbon Disclosure Project (CDP), a United Kingdom based non-profit organization. It is comparable with Global Reporting Initiative (GRI) which is a Netherlands based organization. GRI works with businesses and organizations while CDP works with individual companies.

Framework of Carbon Disclosure Rating

Carbon Disclosure Rating is calculated by a general framework based on questionnaire generated by CDP. About 6,800 companies, which participated as of year 2020, usually submit responses to a series of industry specific questions depending on the industry of a specific company. The responses are then evaluated, analyzed, and graded. They are finally made accessible to institutional investors and other interested parties as well.

The grading separate companies based on their comprehension and application of climate-related changes. The grading mention below is stated from CDP.

Figure 1. Carbon Disclosure Project (CDP) Scoring Board.
Carbon disclosure rating table
Source: Carbon Disclosure Project (CDP) .

A and A- | Leadership level
B and B- | Management level
C and C- | Awareness level
D and D- | Disclosure level
F | Failure to provide sufficient information to be evaluated

CDP then publishes a list of most favorable companies that were graded at “Leadership Level A and A-”. In the year 2020, 313 companies were features on the list. Majority of those companies were large multinational corporations who are a leader in their specific industry. It included many prominent companies, such as Ford Motor Company, Apple, Bank of America, Johnson & Johnson, and Walmart.

Benefits of CDR

There is a constant increasing demand for environmental disclosure due to rise in ethical investing. As a result, there are numerous tangible benefits gained by a company when it discloses the requested informed asked by the CDP. They are as follows:

  • Improve and protect a company’s reputation as it builds confidence via transparency and concern for environment
  • Helps gain a competitive edge while performing on the stock market
  • More preparedness for mandatory environmental reporting regulations
  • Discover new opportunities and mitigate potential risks by identifying emerging environmental risks and opportunities which might have been overlooked otherwise
  • Assessing and tracking progress in comparison to the competition in the same industry

Criticism

The biggest criticism of carbon disclosure rating is that the score does not reflect an honest depiction of the actions taken by a company to alleviate its impact on climate change or reduce its carbon footprint. It may simply reflect a that a company didn’t disclose information with CDP. For instance, Amazon in the year 2020 was given a score “F” by CDP because it did not respond to CDP’s request for information.

Therefore, an “F” score may simply mean that a company failed to provide enough information to receive an evaluation. It does not necessarily mean that company’s inability to reduce its carbon footprint. As a result, CDP’s rating is termed to be inconclusive since many companies do not provide information to CDP on thier actions to reduce their carbon footprint and actions to limit their impact on climate change.

Related posts on the SimTrade blog

Useful resources

Carbon Disclosure Project (CDP)

Global Reporting Initiative (GRI)

About the author

The article was written in October 2021 by Anant JAIN (ESSEC Business School, Grande Ecole Program – Master in Management, 2019-2022).

Carbon Trading

Carbon Trading

Anant Jain

In this article, Anant JAIN (ESSEC Business School, Grande Ecole Program – Master in Management, 2019-2022) talks about Carbon Trading.

Introduction

Carbon trading is a market-based system focused on alleviating greenhouse gases, particularly carbon dioxide which is emitted by burning fossil fuels. Carbon trading is essentially the purchasing and selling of credits that allows a country, company, or entity to emit a specific quantity of carbon dioxide. The credits are authorized by governments with the aim to gradually reduce the overall carbon emission and alleviate its contribution to climate changes.

China, in July 2021, started a national emission-trading program. The program currently involves 2,225 companies in the power sector. The program is designed to aid the country reach its goal of achieving carbon neutrality by 2060. This program will overtake the European Union Emissions Trading System to become the world’s largest carbon trade market.

How does Carbon Trade work?

The carbon trade commenced with the Kyoto Protocol. It was a United Nations treaty set in 2005 with the aim to alleviate the global carbon emission and mitigate climate change.

The carbon trade works in the following way. Each country is allocated with a certain number of permits to emit carbon dioxide. For instance, if a country does not utilize all of its permits, it can sell the unused permits to another country. However, a slightly small number of new permits is allocated to each country every year.

The main agenda is to motivate each country to cut back on its carbon emission as an incentive to sell its new permits. The bigger and wealthier nations used to buy the credit from the poor and higher polluting countries. But over time, those wealthier countries reduced their emissions. As a result, those nations don’t need to buy as many on the market now.

The Cap-and-Trade System

The cap-and-trade system is a variation on carbon trade, in which, the trade is conducted between companies and is authorized and regulated by the government. Each firm is given a maximum carbon pollution allowance and unutilized allowances can be sold to the other firms. The main aim is to ensure that companies as a whole do not exceed the baseline level of pollution, which is reduced annually.

In the U.S. and Canada, a group of states and provinces got together to start the Western Climate initiative while the state of California has its own cap-and-trade program.

Countries don’t pay for the harsh effects of burning the fossil fuels and producing carbon dioxide, they incur some costs such as the price of the fuel. While the price of the fossil fuel is a cost itself, there are other costs as well, which are known as externalities. Externalities are the cost or benefits received by the society at large who may or may not consume products that cause such externalities. Even though externalities can be positive in nature, they are usually negative which means that consumption causes adverse effects on third party. For example, using fossil fuel as a source of energy causes environmental harm and global warming which are negative externalities experienced by the almost everyone despite people who might not indulge in fossil fuel consumptions.

Does carbon trading work to reduce emission?

Carbon trading is extensively criticized, especially because of the carbon dioxide emissions in industrialized countries is not declining at the necessary rate to avert the catastrophic climate change.

Many scientists believe that the best way is to shift to a low carbon energy, transport, agriculture, and industrial world now. They believe that we don’t have time to wait on the high price on carbon, thus, we need to directly regulate the use of the fossil fuel. There has been no evidence to prove that carbon trading has provided us with any form of monetary gain. However, the concept of pollution trading keeps appearing in proposals to reduce the environmental harm, despite the flaws.

Advantages of Carbon Trading

The argument is that companies have a choice to use the most cost-effective method of meeting the requirements. For instance, these firms have incentives to reduce the carbon emissions and develop better technology to promote that. However, it is said to believe that if the price of permits is low, these companies might decide to buy more.

The main idea behind carbon trading is to gradually reduce the number of permits given every year by the government. Thus, forcing the companies to find more ways to reduce carbon emissions.

Disadvantages of Carbon Trading

  • Deciding the number of permits to allow is a complex task. For instance, in the initial period of 2005 – 2007, when the EU introduced the system of carbon trading, the price of the carbon permits came down to zero as the EU misinterpreted the number of permits.
  • It is very difficult to measure the carbon emissions of a company. Hence, making it a complicated system as well as difficult in measuring the constant transaction costs involved in the buying and selling of permits.
  • If carbon trading is effective in one country but not being followed in the other countries, it may cause a production shift to the others, known as the Free rider problem. Excess carbon emissions are a global issue and requires a global solution. Thus, countries don’t want to start carbon trading due to the fear of other countries free riding on their efforts.
  • Carbon tax might be a much simpler and easier to administer. Carbon trading might have greater impact on the low-income areas who have opportunities to change their lifestyle.

Useful resources

Related posts on the SimTrade blog

About the author

The article was written in October 2021 by Anant JAIN (ESSEC Business School, Grande Ecole Program – Master in Management, 2019-2022).

Green Investments

Green Investments

Anant Jain

In this article, Anant JAIN (ESSEC Business School, Grande Ecole Program – Master in Management, 2019-2022) talks about Green Investments.

Introduction

Green investments, also known as eco investments, are investment activities that target companies focusing on environmentally conscious business projects or practices. This includes, but is not limited to, protection of natural resources, production of clean energy resources, or execution of sustainable projects. Green investments are a type of Socially Responsible Investing (SRI) but they are much more specific than SRI.

Green investments, according to some investors, are investments in any company that has eco-friendly policies and practices guiding its day-to-day operations and future growth. Other investors argue that a company can only be considered a green investment if it is directly involved in environmentally beneficial products or services, such as renewable energy or compostable materials. However, the idea is simple: a green investment should have a positive environmental impact. As a result, green investments are becoming increasingly popular among those seeking to align their financial lives with their environmental values.

Green issues have taken the center stage in the financial world. Many investors started looking for companies that were “better than their competitors in terms of managing their environmental impact” in the 1990s. While some investors continue to concentrate their funds on avoiding only “the most atrocious polluters”, many investors have shifted their focus to using money in a positive, transformative way.

Since 2007, over $1.248 trillion has been invested in solar, wind, geothermal, ocean/hydro, and other green sectors, according to the Global Climate Prosperity Scoreboard, which was launched by Ethical Markets Media and The Climate Prosperity Alliance to track private investments in green companies. This figure includes investments from North America, China, India, and Brazil, as well as investments from other developing nations.

SRI, ESG, and green investing: what is the difference?

Environmental, Social, & Governance (ESG) criteria refers to healthy practices undertaken by firms. It helps investors to analyze potential investments that may have a prominent impact on the environment/society. ESG criteria are integrated to enhance the traditional financial analysis of investment by identifying potential risks and opportunities beyond purely financial valuations. The main objective of ESG evaluation remains financial performance, even though social performance is also taken into account.

Socially Responsible Investing (SRI) is a step up to ESG since the investment process actively eliminates or selects investments according to specific ethical agendas. SRI uses ESG criteria (which facilitate valuation) to apply negative or positive screens on the investments.

While green investing is often lumped together with SRI or ESG criteria, it is technically not the same thing. To be clear, green investing could be considered a type of SRI and ESG criteria. But while SRI and ESG criteria also includes companies that make quality choices with regards to human rights, social justice or other positive social impacts, green investing sticks solely to companies with environmentally beneficial policies and products.

Understanding Green Investing

Green investments that generate all or majority of their profits from green activities are termed as pure-play green investments. Despite its widespread use, the term “green” can be ambiguous. When people talk about “green investments,” they are referring to activities that, in a popular sense, are either directly or indirectly beneficial to the environment.

What qualifies as a “green investment” is a bit of a grey area because individual beliefs on what constitutes a “green investment” differ. Some investors prefer pure-play investments, such as companies that conduct research or manufacture renewable fuels and energy-saving technology. Other investors back businesses that not only follow good business practices in terms of how they use natural resources and manage waste but also generate revenue from a variety of sources.

For some, buying stock in a company that pioneers environmentally conscious business practices in a traditionally “ungreen” industry may be a green investment, but for others, it isn’t. For example, an oil company that has a good track record in terms of environmental practices. While it is environmentally sound for the company to take precautions to limit direct environmental damage, some people may object to buying its stock as a green investment because such companies are a primary cause of global warming since they indulge in burning of fossil fuels.

Advantages and disadvantages of green investing

Green investing is a fantastic way to financially support companies that share your environmental values. However, all investments have advantages and disadvantages, and green investing is no exception.

Advantages of green investing

Supports environmentally conscious businesses

When it comes to bringing positive environmental change, it can sometimes feel like an individual does not have much power as an individual. However, by investing in environmentally friendly businesses, an individual investor can, directly and indirectly, encourage them to make environmentally sound decisions.

Aids in the financing of new environmental innovation

As the climate changes, our world faces a slew of new challenges. Dealing with these issues requires a significant investment of financial resources. As a result, investing in environmentally friendly businesses can aid in the development of new green technologies.

Long-term growth potential

As countries around the world seek to mitigate the effects of climate change, renewable energies and other environmentally friendly products and services are well-positioned for long-term growth. This means that a small investment in a green business now could pay off handsomely in the future.

Disadvantages of green investing

The potential for short-term losses

While there is a lot of hope that green investments will be financially successful in the long run, they may not be as successful in the short term as other businesses. Green investments may result in losses or only modest gains in the near future, as eco-conscious companies will not compromise their values for financial gain.

Finding green investments is difficult

While many companies believe that slapping some green packaging on a product qualifies them as an environmentally conscious company, this is far from the case. This could make it more difficult for someone to find good green investments as an investor. To determine whether a company is truly committed to positive environmental policies and action, one must often conduct extensive research.

Policies and practices of a company can change at any time

It’s important to remember that policies and practices of a company can change at any time, and not always for the better. A new CEO or stakeholder pressure can cause a company to abandon its green initiatives, lowering the ethical value of your investments.

Useful resources

Related posts on the SimTrade blog

About the author

The article was written in October 2021 by Anant JAIN (ESSEC Business School, Grande Ecole Program – Master in Management, 2019-2022).

Conscious Capitalism

Conscious Capitalism

Anant Jain

In this article, Anant JAIN (ESSEC Business School, Grande Ecole Program – Master in Management, 2019-2022) talks about Conscious Capitalism.

Introduction

Conscious Capitalism is mainly focused on creating a more ethical business, whilst pursuing profits. The main premise behind conscious capitalism is to make businesses more socially responsible in their economic and political philosophies. Ideally, these businesses should consider benefitting all its stakeholders including employees, suppliers and customers, and the environment and society at large, not just the shareholders and the top management team.

Conscious capitalism is not only about funding charitable events or about the different programs. It is driven by an ongoing and integrated approach to self-awareness, social responsibility and purposeful decision making.

Comprehending Conscious Capitalism

The concept of Conscious Capitalism has been founded by John Mackey, co-founder and CEO of Whole Foods Market as well as Professor Raj Sisodia (Marketing department, Tecnológico de Monterrey, Mexico), who wrote a book together on this philosophy “Conscious Capitalism: Liberating the Heroic Spirit of Business” and founded a non-profit organization called “Conscious Capitalism” which has chapters in more than two dozen U.S. cities and 10 other countries.

While the conscious capitalism credo acknowledges free market capitalism being the most powerful system to ensure human progress and social cooperation, firms and other organizations can still achieve more. It does not mean that profit seeking will take a backseat in conscious capitalism, but it encourages to incorporate all common interests into the plan. Conscious capitalism includes competition, entrepreneurship, freedom to trade, and voluntary exchange. But the credo is also built on the foundation of traditional capitalism as well as elements including trust, compassion, value creation and collaboration. Although profit seeking is not minimized in conscious capitalism, the concept focuses on integrating the interests of all major stakeholders in a company.

There are four guiding principles behind this philosophy:

Higher Purpose

A company that sticks to the main principles of conscious capitalism focuses on profits as well as the purpose beyond this profit. This purpose inspires and engages with the key stakeholders.

Stakeholder Orientation

Companies have various stakeholders including customers, employees, suppliers, and investors among others. Some companies focus on return to their stakeholders, barring everything else. On the other hand, a conscious business, focuses on the business as a whole to create and optimize its value for all its shareholders.

Conscious Leadership

Conscious leaders focus on the value of “we” rather than “I” to drive their businesses. This in turn cultivates a culture of conscious capitalism in the company.

Conscious Culture

The sum of the values and principles that constitute the social and moral fabric of a business is known as corporate culture. A conscious culture, on the other hand, is where the policy of conscious capitalism enters a business and creates a spirit of trust and cooperation among all its shareholders.

What is the difference between Conscious Capitalism and Corporate Social Responsibility?

The main difference between conscious capitalism and Corporate Social Responsibility (CSR) is that conscious capitalism is rooted in a company’s philosophy, it is a more comprehensive and holistic approach connecting companies to the society. On the other hand, CSR employs the traditional business models to different entities.

Moreover, conscious capitalism works to create new ethics and values for its stakeholders. In their book, “Conscious Capitalism: Liberating the Heroic Spirit of Business”, Mackey and Sisodia explain how conscious companies do not necessarily have to do anything outside of its normal functions to become socially responsible, which in turn creates value for its internal and external stakeholders. But at times such businesses also employ various CSR initiatives.

Benefits of Conscious Capitalism

A growing number of businesses including Whole Foods Market, Starbucks, The Container Store, and Trader Joe’s have adopted the practices and principles of conscious capitalism, making it an increasingly popular concept in the business world. Companies that choose to reject this may notice an adverse effect on their profits and revenues.

Companies that have chosen to adopt this philosophy reap significant rewards. Nowadays, many investors and consumers consider the impact of businesses on the environment. These stakeholders look for businesses that give equal importance to moral principles as well as corporate values. According to Nielsen’s 2014 report titled, “Global Survey on Corporate Social Responsibility”, 55% of consumers worldwide, said they would prefer to spend more on products and services that support worthwhile causes.

Criticism of Conscious Capitalism

There has been an overall favorable sentiment towards the philosophy of conscious capitalism, but there has been some criticism as well. The critics are opposed to the philosophy that conscious capitalism can fix the issues within the corporate world. They also believe that adopting such practices might not sit well with the shareholders of the company who are solely after good returns. Some critics believe that the responsibility of conscious capitalism should not only fall on the private sector. They believe that through the collective efforts of the leaders and public policy the responsibility can be shared, and change can be brought out.

Useful resources

Related posts on the SimTrade blog

About the author

The article was written in October 2021 by Anant JAIN (ESSEC Business School, Grande Ecole Program – Master in Management, 2019-2022).
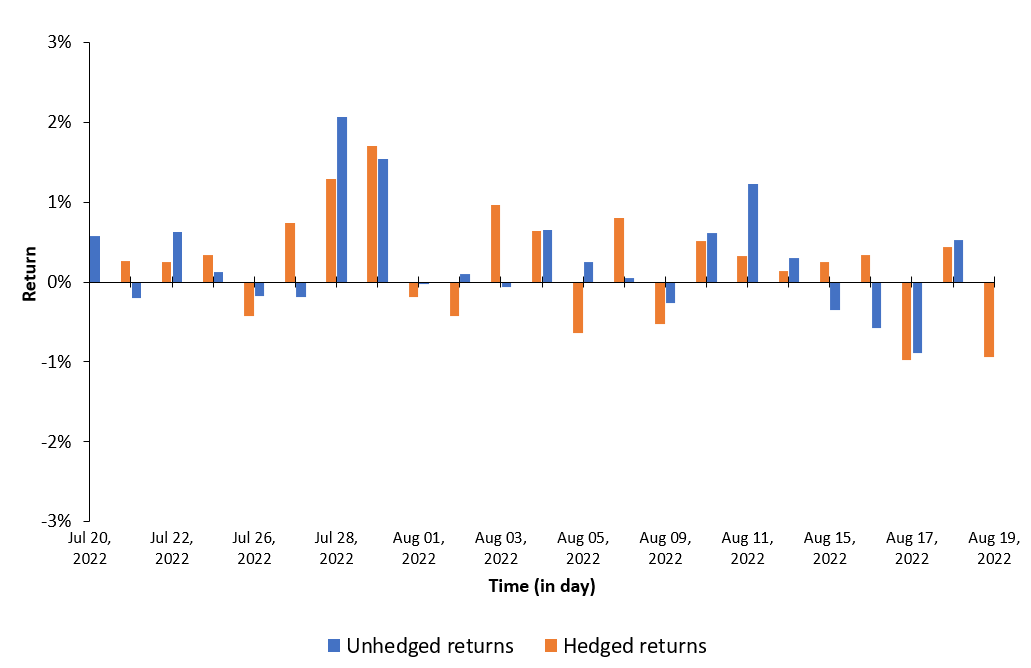
Sin Stocks

Sin Stocks

Anant Jain

In this article, Anant JAIN (ESSEC Business School, Grande Ecole Program – Master in Management, 2019-2022) talks about sin stocks.

Introduction

Sin stocks are shares of publicly traded companies that are indulged in business activities or industries considered unethical, corrupt, or unpleasant. It is referred for companies involved in sectors dealing with morally dubious actions. Traditionally, the sectors mainly included weaponry, alcohol, gambling, and tobacco. Ethical investors, that is investors who believe in socially responsible investing, exclude sin stocks since such companies tend to make money by exploiting society and the environment.

Diverse cultures have different opinions on what constitutes a sin, making it a relative concept. Generally, sin stocks include alcohol but for instance, brewing beer or making wine is considered a noble tradition in different parts of the world. While some investors disregard weapon production on account of ethical basis, serving in the military can be considered as an act of patriotism by others.

Understanding Sin Stocks

Sin stock sectors often include tobacco, alcohol, gambling, weapon manufacturers, and sex related industries. They can also be categorized by the regional and societal expectations of our society which varies across the world. Political beliefs can also influence what is considered as a sin stock. Some people include military contractors, while others consider supporting the military a sign of patriotism. Sin stocks, also known as “sinful stock”, are on the opposite side from ethical and socially responsible investing whose main aim is to find investments that give an overall benefit to the society.

It is difficult to categorize sin stocks, as sin relies on the personal feeling of the investor towards the industry. Alcohol producers like Anheuser-Busch and tobacco firms like Phillip Morris are often on the list of sin stock. Even weapon manufacturers like Smith & Wesson are on those lists. A company like General Dynamics may not make the list, depending upon the investor’s views on supplying weapon systems to the military. Many gambling stocks are linked to hotels, such as Caesars Entertainment Corporation or Las Vegas Sands Corp. Therefore, it can also be difficult to disentangle the sin portions of some businesses.

Benefits of Sin Stocks

Investing in sin stocks may be objectionable to some investors. However, many of these sin stocks are sound investments. The essence of their business ensures that they have a steady flow of customers. The demand for their products or services is relatively inelastic (an increase in the price of the good does not decrease the demand of that good to a great degree and vice versa), making their business more recession-proof than other companies. Due to the social and regulatory risks, competitors get discouraged from entering the market, thus adding to the downside protection. The lesser level of competition ensures big margins and stable profits for sin stocks.

Some researchers suggest that sin stocks may also be undervalued. The negative depiction of sin stocks causes analysts and institutional investors to avoid them, making them more attractive to investors willing to take the risk. Several of the biggest sin stocks generate amazing long-term record of shareholder value.

Disadvantages of Sin Stocks

Sin stocks face a greater political risk than most other stocks, which may translate into higher risk of declaring bankruptcy. Furthermore, sin stocks face a greater risk of being declared unethical and forced out of business. The first step towards outlawing an industry is directly related to its public perception. For instance, prohibitions on drugs and alcohol would’ve seemed very strange in the 18th century in the U.S. while, it seemed completely normal during parts of the 20th century. This is due to the public who began to associate alcohol and drugs with various crimes taking place in the 19th century before these bans.

Sin taxes are a threat that is faced by sin stocks even when they are not outlawed. This is due to the political and economic factors. Politically speaking, many conservatives who are generally opposed to taxes are willing to cast their vote for taxes on practices they consider immoral. From an economic standpoint, sin taxes are supported, resulting in higher taxes for sin stocks. Whenever a good or service is taxed, some people reduce its consumption in response to the tax, resulting in, not producing any tax revenue. Moreover, it decreases the happiness of people who would otherwise consume the good or service. Such a typical result of a tax is a deadweight loss for community. However, it can be argued that taxing a sin stock, for instance, tobacco, benefits the society as lower tobacco consumption eventually progresses health and lowers medical expenses.

Conclusion

In conclusion, the decision to invest in stocks questions the general issue of socially responsible and ethical investing – and whether you feel that your principles should influence your principal.

Some investors believe that it is up to individuals to decide whether they want to smoke, drink, or gamble, despite the risks. Other investors think that the companies producing these products are partly to blame for individuals’ consumption, especially when that consumption becomes addictive, and products are engineered to be addictive.

Useful resources

Related posts on the SimTrade blog

About the author

The article was written in October 2021 by Anant JAIN (ESSEC Business School, Grande Ecole Program – Master in Management, 2019-2022).

United Nations Global Compact

United Nations Global Compact

Anant Jain

In this article, Anant JAIN (ESSEC Business School, Grande Ecole Program – Master in Management, 2019-2022) talks about the United Nations Global Compact.

Introduction

The United Nations (UN) Global Compact is a worldwide initiative to assist and support companies devoted to responsible business practices in human rights, environment, labor, and corruption. This UN-led initiative supports activities that contribute to sustainable development goals to build a better world.

The UN Global Compact is formulated on Ten Principles that should define a company’s core value system and its approach to conducting business. Within the compact (an agreement between the UN and any company becoming a member), member companies are expected to engage in specific business practices that help people and the planet while seeking profitability with integrity. Beyond the agreement, the UN assist and support member companies in different ways:

  • Networking opportunities with other UN Global Compact participants from over 160 countries
  • Local network support by the UN Global Compact’s country specific teams in over 85 countries
  • Access for partnership with a range of stakeholders
  • Access to tools, resources, and training along with the best practical guidance by the UN Global Compact.

The Ten Principles of the United Nations Global Compact

The Ten Principles of the UN Global Compact, as stated on its website, are mentioned below:

Human rights

Principle 1: Businesses should support and respect the protection of internationally proclaimed human rights.

Principle 2: Make sure that they are not complicit in human rights abuses.

Labor

Principle 3: Businesses should uphold the freedom of association and the effective recognition of the right to collective bargaining.

Principle 4: The elimination of all forms of forced and compulsory labor.

Principle 5: The effective abolition of child labor.

Principle 6: The elimination of discrimination in respect of employment and occupation.

Environment

Principle 7: Businesses should support a precautionary approach to environmental challenges.

Principle 8: Undertake initiatives to promote greater environmental responsibility.

Principle 9: Encourage the development and diffusion of environmentally friendly technologies.

Anti-corruption

Principle 10: Businesses should work against corruption in all its forms, including extortion and bribery.

Companies that join the UN Global Compact initiative are expected to integrate the ten principles of the UN Global Compact into their corporate strategies, organizational culture, and daily logistics. The companies are also expected to promote the principles publicly. Any company may join the UN Global Compact and commit to uphold the principles, but it is not legally binding and purely voluntary.

Benefits for companies to join the UN Global Compact

Companies may choose to join the UN Global Compact because of the significance of corporate codes of conduct for growing and sustaining healthy relationships with clients, employees, and other stakeholders. It is also essential to avoid governing and judicial problems.

Moreover, companies that pledge to sustainability might gain the upper hand in untapped markets, attract and retain business partners, develop new products and services in a lower-risk environment, and boost employee satisfaction and efficiency.

UN Global Compact Strategy 2021-2023

The United Nations Global Compact is positioned to assist companies to align with their sustainable practices while recuperating from the COVID-19 pandemic. With the aid of all 193 participant countries of the United Nations General Assembly, the UN Global Compact continues to be the exclusive global regulating authority and the reference point for action and leadership within a developing global corporate sustainability transition. Its latest strategy intends to leverage this position and upgrade the expected outcomes of businesses to incorporate the principles laid down by UN Global Compact.

The UN Global Compact provides a blueprint to companies. The COVID-19 global pandemic and ongoing climate crisis already hindered the progress, the world attained by embracing the global goals in 2015. Therefore, this strategy aims to regain that lost grip and advance much further by persuading global businesses to scale up their contributions.

The 2021–2023 UN Global Compact Strategy is formulated around five chief elements. Each element follows a fixed set of preferences, engagement with specific personnel, programs to be emphasized, and operations methodology. The impact for this mission will be derived through two main media, which are as follows:

  • Accountable companies: Businesses dedicated to fastening their own individual company’s progress to implement and sustain the Ten Principles, and to contribute to the Global Goals.
  • Enabling ecosystems: Global and local communities and networks that inspire, support and aid combined effort to attain the goal.

The new global strategy for 2021–2023 covers five essential transformations to increase the actions and the scale of these actions of businesses. The five primary shifts are mentioned below:

1) Making Companies Accountable

One of the main elements of the new strategy is to fasten the pace and the growth rate of the participating companies’ corporate sustainability and responsible practices while keeping the companies accountable. The UN Global Compact will use explicit, measurable targets within an intensified reporting framework to hold the participating companies accountable.

2) A Harmonious Growth of Local and Regional Networks

The UN Global Compact will empower the Global Compact Local Networks and the base of all their work. They will also build more dynamic national ecosystems for business sustainability. This step should help start new national and regional Global Compact networks. The focus areas will be the Global South, the United States, and China.

3) Mapping Impact in Priority Areas

UN Global Compact programs will concentrate on the Ten Principles to direct action on five priority Global Goals. These programs will be co-created with the Local Networks that will finally deliver these programs. All programs will be adapted to country-specific requirements. The priority areas are as follows:

  • Gender Equality (SDG 5): to achieve gender equality and empower all women and girls.
  • Decent Work and Economic Growth (SDG 8): to promote sustained, inclusive and sustainable economic growth, full and productive employment and decent work for all.
  • Climate Action (SDG 13): to take urgent actions to combat climate changes and its impacts.
  • Peace, Justice and Strong Institutions (SDG 16): to promote peaceful and inclusive socities for sustainable development, provide access to justice for all and build effective, accountable and inclusive institutions at all levels.
  • Partnerships (SDG 17): to strengthen the means of implementation and revitalize the global partnership for sustainable development.

4) Harnessing the Combined Action of Small and Medium-Sized Businesses (SMEs)

The UN Global Compact includes most of the world’s businesses and employers. They will leverage this to establish targeted and cross-cutting SME programs that will utilize digital tools and value chains to improve the scale.

5) More active engagement with the United Nations and its partners

The UN Global Compact will increase their collaboration at the global and nation level with United Nations agencies and UN country-specific teams. The main agenda for this is to increase the outreach to promote responsible business practices around the world.

Useful resources

Related posts on the SimTrade blog

Jain A. Impact Investing

Jain A. Environmental, Social & Governance (ESG) Criteria

Jain A. Socially Responsible Investing

About the author

The article was written in October 2021 by Anant JAIN (ESSEC Business School, Grande Ecole Program – Master in Management, 2019-2022).

Smart beta 2.0

Youssef_Louraoui

In this article, Youssef LOURAOUI (ESSEC Business School, Global Bachelor of Business Administration, 2017-2021) presents the concept of Smart beta 2.0, an enhancement of the first generation of smart beta strategies.

The structure of this post is as follows: we begin by defining smart beta 2.0 as a topic. We then discuss then the characteristics of smart beta 2.0.

Definition

“Smart beta 2.0” is an expression introduced by Amenc, Goltz and Martellini (2013) from the EDHEC-Risk Institute. This new vision of smart beta investment intends to empower investors to maximize the performance of their smart beta investments while managing their risk. Rather than offering solely pre-packaged alternatives to equity market-capitalization-weighted indexes, the Smart beta 2.0 methodology enables investors to experiment with multiple smart beta indexes to create a benchmark that matches their own risk preferences, and by extension increase their portfolio diversification overall.

Characteristics of smart beta 2.0 strategies

The main characteristic of smart beta 2.0 strategies compared to smart beta 1.0 strategies is portfolio diversification.

If factor-tilted strategies (i.e., portfolios with a part specifically invested in factor strategies) do not consider a diversification-based goal, they may result in very concentrated portfolios in order to achieve their factor tilts. Investors have lately started to integrate factor tilts with diversification-based weighting methods to create well-diversified portfolios using a flexible strategy known as Smart beta 2.0 (EDHEC-Risk Institute, 2016).

This method, in particular, enables the creation of factor-tilted indexes that are also adequately diversified by using a diversification-based weighting scheme. Because it combines the smart weighting scheme with the explicit factor tilt (Amenc et al., 2014), this strategy is also known as “smart factor investment”. In order to achieve extra value-added, investors are increasingly focusing on allocation choices across factor investing techniques.

The basic foundation for the smart beta has been substantially outstripped by its success with institutional investors. It is clear that market-capitalization-weighted indices have no counterpart when it comes to capturing market fluctuations (Amenc et al., 2013). Even the harshest detractors of market-capitalization-weighted, in the end, use market-capitalization-weighted indices to assess the success of their own new indexes (Amenc et al., 2013). In fact, because smart beta strategies outperform market-capitalization-weighted indexes, the great majority of investors are likely to pick them. While everyone believes cap-weighted indexes provide the most accurate representation of the market, they do not always provide an efficient benchmark that can be used as a reference for a strategic allocation. It’s worth noting that smart beta 2.0 seeks to close the gap in terms of exposure to factors from the first generation, but it doesn’t guarantee outperformance over market-capitalization-weighted strategies (Amenc et al., 2013).

Why should I be interested in this post?

If you are a business school or university undergraduate or graduate student, this content will help you in understanding the evolution of asset management during the last decades and in broadening your knowledge of finance.

Smart beta funds have become a hot issue among investors in recent years. Smart beta is a game-changing invention that addresses an unmet need among investors: a higher return for lower risk, net of transaction and administrative costs. In a way, these strategies (smart beta 1.0 and then smart beta 2.0) have created a new market. As a result, smart beta is gaining traction and influencing the asset management industry.

Related posts on the SimTrade blog

Factor investing

   ▶ Youssef LOURAOUI Factor Investing

   ▶ Youssef LOURAOUI Origin of factor investing

   ▶ Youssef LOURAOUI Smart beta 1.0

   ▶ Youssef LOURAOUI Alternatives to market-capitalization weighting strategies

Factors

   ▶ Youssef LOURAOUI Size Factor

   ▶ Youssef LOURAOUI Value Factor

   ▶ Youssef LOURAOUI Yield Factor

   ▶ Youssef LOURAOUI Momentum Factor

   ▶ Youssef LOURAOUI Quality Factor

   ▶ Youssef LOURAOUI Growth Factor

   ▶ Youssef LOURAOUI Minimum Volatility Factor

Useful resources

Amenc, N., F., Goltz, F., Le Sourd, V., 2016. Investor perception about Smart beta ETF. EDHEC-Risk Institute working paper.

Amenc, N., F., Goltz, F., Martellini, L., 2013. Smart beta 2.0. EDHEC-Risk Institute working paper.

Amenc, N., F., Goltz, F., Martinelli, L., Deguest, R., Lodh, A., Shirbini, E., 2014. Risk Allocation, Factor Investing and Smart Beta: Reconciling Innovations in Equity Portfolio Construction. EDHEC-Risk Institute working paper.

About the author

The article was written in September 2021 by Youssef LOURAOUI (ESSEC Business School, Global Bachelor of Business Administration, 2017-2021).

My first experience in corporate finance inside a CAC40 group

My first experience in corporate finance inside a CAC40 group

Pierre BERGES

In this article, Pierre BERGES (ESSEC Business School, Master in Strategy & Management of International Business (SMIB), 2020-2021) shares with us his experience in the Finance Department at Bouygues (a French firm included in the CAC40 index).

About Bouygues

Born in 1952 under the impulsion of Francis Bouygues and now managed by his son Martin, the Bouygues group has become in 70 years a gigantic and well-oiled machine which diversified in many fields along the years such as construction (Bouygues Construction), Telecommunications (Bouygues Telecom), Real Estate (Bouygues Immobilier), Road (Colas) and Media (TF1). Operating in over 80 countries with 129,000 employees, Bouygues is one of the biggest actors of the building industry around the world and the second French building company behind Vinci. As a major actor of the CAC 40 index and because of its numerous actions in M&A (Colas in 1985, TF1 in 1987…), Bouygues has developed a strong financial expertise especially regarding corporate finance.

My experience at Bouygues

My goal as an ESSEC’s student was to develop my skills in finance in order to find a job that will challenge me and help me learn each day, that’s why I chose to search for an internship in corporate finance and, if possible, inside a French historic group. I had the chance to join the team of the Finance Department of Bouygues SA and work with the senior financial managers on two missions. The first mission was to report all the critical financial information of the Bouygues’s subsidiaries to the Chief Financial Officer (CFO) and Top Management Team (TMT) each month and monitor the results of the subsidiaries in order to adapt the strategy in case of unusual results. The second mission was the construction of the rating files dedicated to the two rating agencies, Moody’s and S&P, for the rating of Bouygues. I had also to work on more punctual missions related to Bouygues’s stocks (share buyback, stock options, employees saving plan, protection thought derivatives…).

The process of rating

My main mission was to support the managers during the construction of the rating files for the rating agencies Moody’s and S&P. The aim of those files was to help the agencies during their decision process by giving all the information needed under the best light possible to increase or at least maintain the rating of Bouygues. Even though it’s almost impossible for a company to influence the financial aspects of the rating, the company can still work on more flexible aspects of the rating process such as the country risk (risks of the countries where the firm operates), the industry risk (risk of the industry the firm chose to develop). For Bouygues some flexibility is possible regarding the repartition of the earnings coming from media, construction, telecommunication…) or the management governance for example. Our work was to find the best way to optimize those topics and therefore the best way to improve Bouygues’s rating for future market operations.

Figure 1: Structure of the S&P rating.
Structure of the S&P rating
Source: S&P.

What I’ve learnt during this internship

This internship taught me a lot about corporate finance and how companies use finance to maximize their profits and protect their assets. It also taught me about the central position of rating agencies in the strategy of a company, especially if this company plans to expand through bonds or other financial instruments. Finally, I’ve learnt the way a company can and have to interact with other actors and how the market can influence both the company strategy and its behavior on a daily basis.

Relevance to the SimTrade certificate

The SimTrade certificate is a powerful ally especially regarding the missions linked to Bouygues’s stocks. It allows me to quickly understand the concepts of stock-options or derivative and increase my effectiveness regarding those topics. The certificate is a very good way to learn the basics of financial markets and build on those basics to progress on more complex subjects

Related posts on the SimTrade blog

   ▶ All posts on Professional experiences

   ▶ Raphaël ROERO DE CORTANZE Credit Rating Agencies

   ▶ Bijal GANDHI Credit Rating

   ▶ Jayati WALIA Credit Risk

Useful resources

Academic articles

Louizi, A., Kammoun, R., 2016. Le positionnement des agences de Notation dans l’évaluation du système de gouvernance d’entreprise, Gestion 2000, 33(5-6):149-175.

Business

Bouygues Presentation and history of Bouygues group

S&P Global

Moody’s

About the author

The article was written in September 2021 by Pierre BERGES (ESSEC Business School, Master in Strategy & Management of International Business (SMIB), 2020-2021).

Smart Beta 1.0

Youssef_Louraoui

In this article, Youssef LOURAOUI (ESSEC Business School, Global Bachelor of Business Administration, 2017-2021) presents the concept of the smart beta 1.0, the first generation of alternative indexing investment strategies that created a new approach in the asset management industry.

This post is structured as follows: we start by defining smart beta 1.0 as a topic. Finally, we discuss an empirical study by Motson, Clare and Thomas (2017) emphasizing the origin of smart beta.

Definition

The “Smart Beta” expression is commonly used in the asset management industry to describe innovative indexing investment strategies that are alternatives to the market-capitalization-weighted investment strategy (buy-and-hold). In terms of performance, the smart beta “1.0” approach outperforms market-capitalization-based strategies. According to Amenc et al. (2016), the latter have a tendency for concentration and unrewarded risk, which makes them less appealing to investors. In finance, “unrewarded risk” refers to taking on more risk without receiving a return that is commensurate to the increased risk.

When smart beta techniques were first introduced, they attempted to increase portfolio diversification over highly concentrated and capitalization-weighted, as well as to capture the factor premium available in equity markets, such as value indices or fundamentally weighted indices which aim to capture the value premium. While improving capitalization-weighted indices is important, concentrating just on increasing diversity or capturing factor exposure may result in a less than optimal outcome. The reason for this is that diversification-based weighting systems will always result in implicit exposure to certain factors, which may have unintended consequences for investors who are unaware of their implicit factor exposures. Unlike the second generation of Smart Beta, the first generation of Smart Beta are integrated systems that do not distinguish between stock selection and weighting procedures. The investor is therefore required to be exposed to certain systemic risks, which are the source of the investor’s poor performance.

Thus, the first-generation Smart Beta indices are frequently prone to value, small- or midcap, and occasionally contrarian biases, since they deconcentrate cap weighted indices, which are often susceptible to momentum and large growth risk. Furthermore, distinctive biases on risk indicators that are unrelated to deconcentration but important to the factor’s objectives may amplify these biases even further. Indexes that are fundamentally weighted, for example, have a value bias because they apply accounting measures that are linked to the ratios that are used to construct value indexes.

Empirical study: monkeys vs passive mangers

Andrew Clare, Nick Motson, and Steve Thomas assert that even monkey-created portfolios outperform cap-weighted benchmarks in their study (Motson et al., 2017). A lack of variety in cap-weighting is at the foundation of the problem. The endless monkey theory states that a monkey pressing random keys on a typewriter keyboard for an unlimited amount of time will almost definitely type a specific text, such as Shakespeare’s whole works. For 500 businesses, there is an infinite number of portfolio weighting options totaling 100%; some will outperform the market-capitalization-weighted index, while others will underperform. The authors of the study take the company’s ticker symbol and use the following guidelines to create a Scrabble score for each stock:

  • A, E, I, O, U, L, N, S, T, R – 1 point. D and G both get two points.
  • B, C, M, P – 3 points ; F, H, V, W, Y – 4 points ; K – 5 points.
  • J, X – 8 points ; Q, Z – 10 points

The scores of each company’s tickers are then added together and divided by this amount to determine each stock’s weight in the index. As illustrated in Figure 1, the results obtained are astonishing, resulting in a clear outperformance of the randomly generated portfolios compared to the traditional market capitalization index by 1.5% premium overall.

Figure 1. Result of the randomly generated portfolio with the Cass Scrabble as underlying rule compared to market-capitalization portfolio performance.
Scrabble_performance
Source: Motson et al. (2017).

In the same line, the authors produced 500 weights that add up to one using this technique, with a minimum increase of 0.2 percent. The weights are then applied to a universe of 500 equities obtained from Bloomberg in December 2015 (Motson et al., 2017). The performance of the resultant index is then calculated over the next twelve months. This technique was performed ten million times. As illustrated in Figure 2, the results are striking, with smart beta funds outperforming nearly universally in the 10 million simulations run overall, and with significant risk-adjusted return differences (Motson et al., 2017).

Figure 2. 10 million randomly generated portfolios based on a portfolio construction of 500 stocks
Scrabble_performance
Source: Motson et al. (2017).

For performance analysis, the same method was employed, but this time for a billion simulation. This means they constructed one billion 500-stock indexes with weights set at random or as if by a monkey. Figure 9 suggests that the outcome was not accidental. The black line shows the distribution of 1 billion monkeys’ returns in 2016, while the grey line shows the cumulative frequency. 88 percent of the monkeys outperformed the market capitalization benchmark, according to the graph. The luckiest monkey returned 27.2 percent, while the unluckiest monkey returned just 3.83 percent (Motson et al., 2017) (Figure 3).

FFigure 3. Result of one billion randomly simulated portfolios based on a portfolio construction of 500 stocks.
Scrabble_performance
Source: Motson et al. (2017).

Why should I be interested in this post?

If you are a business school or university undergraduate or graduate student, this content will help you in understanding the various evolutions of asset management throughout the last decades and in broadening your knowledge of finance.

If you’re an investor, you’re probably aware that smart beta funds have become a popular topic. Smart beta is a game-changing development that fills a gap in the market for investors: a better return for a reduced risk, net of transaction and administrative costs. These strategies, in a sense, establish a new market. As a result, smart beta is gaining traction and having an impact on asset management.

Related posts on the SimSrade blog

Factor investing

   ▶ Youssef LOURAOUI Factor Investing

   ▶ Youssef LOURAOUI Origin of factor investing

   ▶ Youssef LOURAOUI Smart beta 2.0

   ▶ Youssef LOURAOUI Alternatives to market-capitalisation weighted indexes

Factor

   ▶ Youssef LOURAOUI Size Factor

   ▶ Youssef LOURAOUI Value Factor

   ▶ Youssef LOURAOUI Yield Factor

   ▶ Youssef LOURAOUI Momentum Factor

   ▶ Youssef LOURAOUI Quality Factor

   ▶ Youssef LOURAOUI Growth Factor

   ▶ Youssef LOURAOUI Minimum Volatility Factor

Useful resources

Academic research

Amenc, N., F., Goltz, F. and Le Sourd, V., 2016. Investor perception about Smart beta ETF. EDHEC Risk Institute working paper.

Amenc, N., F., Goltz, F. and Martinelli, L., 2013. Smart beta 2.0. EDHEC Risk Institute working paper.

Motson, N., Clare, A. & Thomas, S., 2017. Was 2016 the year of the monkey?. Cass Business School research paper.

About the author

The article was written in September 2021 by Youssef LOURAOUI (ESSEC Business School, Global Bachelor of Business Administration, 2017-2021).

Alternative to market-capitalization weighting strategies

Youssef_Louraoui

In this article, Youssef LOURAOUI (ESSEC Business School, Global Bachelor of Business Administration, 2017-2021) presents the different alternatives developed to the market-capitalization weighting strategy (buy-and-hold strategy).

The structure of this post is as follows: we begin by introducing alternatives to market capitalization strategies as a topic. We then will delve deeper by presenting heuristic-based weighting and optimization-based weighting strategies.

Introduction

The basic rule of applying a market-capitalization weighting methodology for the development of indexes has recently come under fire. As the demand for indices as investment vehicles has grown, different weighting systems have emerged. There have also been a number of recent projects for non-market-capitalization-weighted ETFs. Since the first basic factor weighted ETF was released in May 2000, a slew of ETFs has been released to monitor non-market-cap-weighted indexes, including equal-weighted ETFs, minimal variance ETFs, characteristics-weighted ETFs, and so on. These are dubbed “Smart Beta ETFs” since they aim to outperform traditional market-capitalization-based indexes in terms of risk-adjusted returns (Amenc et al. 2016).

The categorization approach will be the same as Chow, Hsu, Kalesnik, and Little (2011), with the following distinctions: 1) basic weighting techniques (heuristic-based weighting) and 2) more advanced quantitative weighting techniques (optimization-based weighting).

It’s an arbitrary categorization system designed to make reading easier by differentiating between simpler and more complicated approaches.

Heuristic-based weighting strategies

Equal-weighting

The equal weighting method assigns the same weight to each share making up the portfolio (or index)

EW_index

Where wi represents the weight of asset i in the portfolio and N the total number of assets in the portfolio.

Because each component of the portfolio has the same weight, equal weighting helps investors to obtain more exposure to smaller firms. Bigger firms will be more represented in the market-capitalization-weighted portfolio since their weight will be larger. The benefit of this technique is that tiny capitalization risk-adjusted-performance tends to be better than big capitalization (Banz, 1981).

In their study, Arnott, Kalesnik, Moghtader, and Scholl (2010) created three distinct indices in terms of index composition. The first group consists of enterprises with substantial market capitalization (as are capitalisation-weighted indices). Each business in the index is then given equal weight. This is how the majority of equally-weighted indexes are built (MSCI World Equal Index, S&P500 Equal Weight Index). The second is to create an index based on basic criteria and then assign equal weight to each firm. The third strategy is a hybrid of the first two. It entails averaging the ranks from the two preceding approaches and then assigning equal weight to the remaining 1000 shares.

Fundamental-weighting

The weighting approach based on fundamentals divides companies into categories based on their basic size. Sales, cash flow, book value, and dividends are all taken into account. These four parameters are used to determine the top 1,000 firms, and each firm in the index is given a weight based on the magnitude of their individual components (Arnott et al., 2005). The portfolio weight of the ith stock is defined as:

Fundamental_indexing

For a fundamental index that includes book value as a consideration, for example, the top 1,000 companies in the market with the most extensive book values are chosen. Firm xi is given a weight wi, which is equal to the firm’s book value divided by the total of the index components’ book values.

Fundamental indexation tries to address the following bias: in a cap-weighted index, if the market efficiency hypothesis is not validated and a share’s price is, for example, overpriced (greater than its fair value), the share’s weight in the index will be too high. Weighting by fundamentals will reduce the bias of over/underweighting over/undervalued companies based on criteria like sales, cash flows, book value, and dividends, which are not affected by market opinion, unlike capitalization.

Low beta weighting

Low-beta strategies are based on the fact that equities with a low beta have greater returns than those expected by the CAPM (Haugen and Heins, 1975). A beta of less than one indicates that the share price has tended to grow less than its benchmark index during bullish trends and to decrease less severely during negative trends throughout the observed timeframe. A low-beta index is created by selecting low-beta stocks and then giving each stock equal weight in the index. As a result, it’s a hybrid of a low-beta and an equal-weighting method. On the other side, high beta strategies enable investors to profit from the amplification of favourable market moves.

Reverse-capitalization weighting

The weight of an asset capitalization-weighted index can be defined as:

CW_index

where MC stands for “Market Capitalization”, and wi is the weight of asset i in the portfolio.

In a reverse market-capitalization-weighted index, the weight of an asset is defined as:

RCW

“Reverse market-capitalization” is abbreviated as RMC. This technique necessitates using a cap-weighted index to execute the approach. RCW methods, like equal-weight or low-beta strategies, are motivated by the fact that small caps have a greater risk-adjusted return than big caps. This sort of indexation requires constant rebalancing (Banz, 1981).

Maximum diversification

This technique aims to build a portfolio with as much diversification as feasible. A diversity index (DI) is employed to achieve the desired outcome, which is defined as the distance between the sum of the constituents’ volatilities and the portfolio’s volatility (Amenc, Goltz, and Martellini, 2013). Diversity weighting is one of the better-known portfolio heuristics that blend cap weighting and equal weighting. Fernholz (1995) defined stock market diversity, Dp, as

Diversity_Index(DI)_1

where p between (0,1) and x Market,i is the weight of the ith stock in the cap-weighted market portfolio, and then proposed a strategy of portfolio weighting whereby portfolio weights are defined as

Diversity_Index(DI)_2

where i = 1, . . . , N; p between (0,1); and the parameter p targets the desired level of portfolio tracking error against the cap-weighted index.

Optimization-based weighting strategies

The logic of Modern Portfolio Theory (Markowitz, 1952) is followed in Mean-Variance optimization. Theoretically, if we know the expected returns of all stocks and their variance-covariance matrix, we can construct risk-adjusted-performance optimal portfolios. However, these two inputs for the model are difficult to estimate precisely in practice. Chopra and Ziemba (1993) showed that even little inaccuracies in these parameters’ estimates may have a large influence on risk-adjusted-performance.

Minimum Variance

Chopra and Ziemba (1993) adopt the simple premise that all stocks have the same return expectation, based on the fact that stock return expectations are difficult to quantify. As a result of this premise, the best portfolio is the one that minimizes risk. The goal of minimal variance strategies, which have been around since 1990, is to provide a better risk-return profile by lowering portfolio risk without modifying return expectations. The low volatility anomaly justifies this technique. Low-volatility stocks have historically outperformed high-volatility equities. These portfolios are built without using a benchmark as a guide. The portfolio variance minimization equation for a two-asset portfolio is as follows:

MPT

In their research on the construction of this type of index, Arnott, Kalesnik, Moghtader and Scholl (2010) found that risk measures that take into account interest rates, oil prices, geographical region, sector, size, expected return, and growth, as calculated by the Northfield global risk model, a model for making one-year risk forecasts, reduce the portfolio’s absolute risk. This method is used in the MSCI World Minimum Volatility Index, which was released in 2008.

Global Minimum Variance, Maximum Decorrelation, and Diversified Minimum Variance are the three types of minimum variance techniques (Amenc, Goltz and Martellini, 2013). However, there are no indexes or exchange-traded funds (ETFs) based on the Maximum Decorrelation and Diversified Minimum Variance methods in actuality; they are still only theoretical notions.

Maximum Sharpe ratio

Because all stocks are unlikely to have the same expected returns, the minimum-variance portfolio—or any practical representation of its concept—is unlikely to have the highest ex-ante Sharpe ratio. Investors must incorporate useful information about future stock returns into a minimum-variance approach to improve it. Choueifaty and Coignard (2008) proposed a simple linear relationship between the expected premium, E(Ri) – Rf, for a stock and its return volatility, sigmai:

MSR_strategy

A related portfolio method proposed by Amenc, Goltz, Martellini, and Retkowsky (2010) implies that a stock’s expected returns are linearly related to its downside semi-volatility. They claimed that portfolio losses are more important to investors than gains. As a result, rather than volatility, risk premium should be connected to downside risk (semi-deviation below zero). The EDHEC-Risk Efficient Equity Indices are built around this assumption. Downside semi-volatility can be defined mathematically as

MSR_Semi_volatility

where Ri, t is the return for stock i in period t.

Maximum Sharpe ratio can be considered as an alternative beta technique that aims to solve the challenges of forecasting risks and returns for a large number of equities.

Why should I be interested in this post?

If you are a business school or university undergraduate or graduate student, this content will help you in understanding the various evolutions of asset management throughout the last decades and in broadening your knowledge of finance.

Smart beta funds have become a hot issue among investors in recent years. Smart beta is a game-changing invention that addresses an unmet need among investors: a higher return for lower risk, net of transaction and administrative costs. In a way, these investment strategies create a new market. As a result, smart beta is gaining traction and influencing the asset management industry.

Related posts on the SimTrade blog

Factor investing

   ▶ Youssef LOURAOUI Factor Investing

   ▶ Youssef LOURAOUI Origin of factor investing

   ▶ Youssef LOURAOUI Smart beta 1.0

   ▶ Youssef LOURAOUI Smart beta 2.0

Factors

   ▶ Youssef LOURAOUI Size Factor

   ▶ Youssef LOURAOUI Value Factor

   ▶ Youssef LOURAOUI Yield Factor

   ▶ Youssef LOURAOUI Momentum Factor

   ▶ Youssef LOURAOUI Quality Factor

   ▶ Youssef LOURAOUI Growth Factor

   ▶ Youssef LOURAOUI Minimum Volatility Factor

Useful resources

Academic research

Amenc, Noël, Felix Goltz, Lionel Martellini, and Patrice Ret- kowsky. 2010. “Efficient Indexation: An Alternative to Cap- Weighted Indices.” EDHEC-Risk Institute (February).

Amenc, N., Goltz, F., Le Sourd, V., 2016. Investor perception about Smart beta ETF. EDHEC Risk Institute working paper.

Amenc, N., Goltz, F., Martinelli, L., 2013. Smart beta 2.0. EDHEC Risk Institute working paper.

Arnot, R.D., Hsu, J., Moore, P., 2005. Fundamental Indexation. Financial Analysts Journal, 61(2):83-98.

Arnot, R.D., Kalesnik, V., Moghtader, P., Scholl, S., 2010. Beyond Cap Weight, The empirical evidence for a diversified beta. Journal of Indexes, January, 16-29.

Banz, R., 1981. The relationship between return and market value of common stocks. Journal of Financial Economics. 9(1):3-18.

Chopra, V., Ziemba, W., 1993. The Effect of Errors in Means, Variances, and Covariances on Optimal Portfolio Choice. Journal of Portfolio Management, 19:6-11.

Chow, T., Hsu, J., Kalesnik, V., Little, B., 2011. A Survey of Alternative Equity Index Strategies. Financial Analyst Journal, 67(5):35-57.

Choueifaty, Yves, and Yves Coignard. 2008. Toward Maximum Diversification. Journal of Portfolio Management, vol. 35, no. 1 (Fall):40–51.

Fernholz, Robert. 1995. Portfolio Generating Functions. Working paper, INTECH (December).

Haugen, R., Heins, J., 1975. Risk and Rate of Return of Financial Assets: Some Old Wine in New Bottles. Journal of Financial and Quantitative Analysis, 10(5):775-784.

Markowitz, H., 1952. Portfolio Selection. The Journal of Finance, 7(1):77-91.

About the author

The article was written in September 2021 by Youssef LOURAOUI (ESSEC Business School, Global Bachelor of Business Administration, 2017-2021).

Markowitz Modern Portfolio Theory

Markowitz Modern Portfolio Theory

Youssef_Louraoui

In this article, Youssef LOURAOUI (ESSEC Business School, Global Bachelor of Business Administration, 2017-2021) presents Markowitz’s Modern Portfolio Theory, a pioneering framework for understanding the impact of the number of stocks in a portfolio and their covariance relationships on portfolio diversification.

We begin by presenting Markowitz’s Modern Portfolio Theory (MPT) as the origin of factor investing (market factor). The assumptions of the model are then discussed. We’ll go through some of the model’s fundamental concepts next. We wrap up with a discussion of the concept’s limitations and a general conclusion.

Modern Portfolio Theory

The work conducted by Markowitz is widely acknowledged as a pioneer in financial economics and corporate finance for his theoretical implications and its application in financial markets. In 1990, Markowitz shared the Nobel Prize for his contributions to these domains, which he articulated in his 1952 article “Portfolio Selection” published in The Journal of Finance. His seminal work laid the groundwork for what is now often referred to as ‘Modern Portfolio Theory’ (MPT).

Modern portfolio theory was first introduced by the work of Harry Markowitz in 1952. Overall, the risk component of MPT can be quantified using various mathematical formulations and mitigated through the concept of diversification, which entails carefully selecting a weighted collection of investment assets that collectively exhibit lower risk characteristics than any single asset or asset class. Diversification is, in fact, the central notion of MPT and is predicated on the adage “never put all your eggs in one basket”.

Assumptions of the Markowitz Portfolio Theory

MPT is founded on several market and investor assumptions. Several of these assumptions are stated explicitly, while others are implied. Markowitz’s contributions to MPT in portfolio selection are based on the following basic assumptions:

  • Investors are rational (they seek to maximize returns while minimizing risk).
  • Investors will accept increased risk only if compensated with higher expected returns.
  • Investors receive all pertinent information regarding their investment decision in a timely manner.
  • Investors can borrow or lend an unlimited amount of capital at a risk-free rate of interest.

Concepts used in the MPT

Risk

Risk is equivalent to volatility in Markowitz’ portfolio selection theory—the larger the portfolio volatility, the greater the risk. Volatility is a term that refers to the degree of risk or uncertainty associated with the magnitude of variations in a security’s value. Risk is the possibility that an investment’s actual return will be less than predicted, which is technically quantified by standard deviation. A larger standard deviation implies a bigger risk and, hence, a larger potential return. If investors are prepared to take on risk, they anticipate earning a risk premium. Risk premium is defined as “the expected return on an investment that exceeds the risk-free rate of return”. The bigger the risk, the more risk premium investors need.”. Riskier investments do not necessarily provide a higher rate of return than risk-free ones. This is precisely why they are hazardous. However, historical evidence suggests that the only way for investors to obtain a better rate of return is to take on greater risk.

Systematic risk

Systematic risk is a type of risk at the macroeconomic level—risk that impacts a large number of assets to varying degrees. Inflation, interest rates, unemployment rates, currency exchange rates, and Gross National Product levels are all instances of systematic risk variables. These economic conditions have a significant influence on practically all securities. As a result, systemic risk cannot be completely eradicated.

Unsystematic risk

Unsystematic risk (or specific risk), on the other hand, is a type of risk that occurs at the micro-level risk factors that influence only a single asset or a small group of assets. It entails a distinct risk that is unrelated to other hazards and affects only particular securities or assets. For instance, Netflix’s poorly accepted adjustment to its planned consumer pricing structure elicited an extraordinarily unfavorable consumer response and defections, resulting in decreased earnings and stock prices. However, it had little effect on the Dow Jones or S&P 500 indexes, or on firms in the entertainment and media industries in general—with the probable exception of Netflix’s largest rival Blockbuster Video, whose value grew dramatically as a result of Netflix’s declining market share. Additional instances of unsystematic risk include a firm’s credit rating, poor newspaper coverage of a corporation, or a strike impacting a specific company. Diversification of assets within a portfolio can greatly minimize unsystematic risk.

Because the returns on various assets are, in fact, connected to some extent, unsystematic risk can never be totally avoided regardless of the number of asset classes pooled in a portfolio. The Markowitz Efficient Frontier is depicted in Figure 1, with all efficient portfolios on the upper line. The efficient frontier is a set of optimal portfolios that offer the best-projected return for a specified level of risk, or the lowest risk for a specified level of return. Portfolios that fall below the efficient frontier are inefficient because they do not generate a sufficient rate of return in relation to the level of risk (Figure 1).

Figure 1. Markowitz Efficient Frontier.
MEF_MPT
Source: computations by the author.

Risk-return trade-off

The term risk-return trade-off refers to Markowitz’s fundamental theory that the riskier an investment, the larger the necessary potential return (or expected return). Investors will generally retain a hazardous investment only if the predicted return is sufficiently high to compensate them for taking the risk. Markowitz derives a relation between expected return (μ) and variance (σ2p) captured in the following expression. Refer to the post Implementation of the Markowitz allocation model for a better understanding of the mathematical foundations of this approach:

img_SimTrade_variance_Markowitz_portfolio

where

  • A, B and C = Optimization parameters
  • μ = expected return vector

Diversification

The words ‘diversification’ and ‘Diversification Effect’ relate to the correlations between portfolio risk and diversification. Diversification, a tenet of Markowitz’s portfolio selection theory and MPT, is a risk-reduction strategy that entails allocating assets among a variety of financial instruments, sectors, and other asset classes. In more straightforward terms, it refers to the aphorism “don’t put all your eggs in one basket.” If the basket is dropped, all eggs are shattered; if many baskets are used, the likelihood of all eggs being destroyed is significantly decreased. Diversification may be accomplished by investments in a variety of companies, asset types (e.g., bonds, real estate, etc.), and/or commodities such as gold or oil.

Diversification seeks to enhance returns while minimizing risk by investing in a variety of assets that will react differently to the same event (s). For example, whenever there is unfavorable news about the European debt crisis, the stock market typically declines dramatically. Simultaneously, the same news has generally benefited the price of specific commodities, such as gold. As a result, portfolio diversification methods should include not just diverse stocks inside and outside of the same industry, but also diverse asset classes, such as bonds and commodities. The Diversification Effect is a term that relates to the link between portfolio correlations and diversification. When there is an imperfect connection between assets (positive or negative), the diversification effect occurs. It is a critical and successful risk mitigation method since risk mitigation may be accomplished without jeopardizing profits. As a result, any prudent investor who is ‘risk cautious’ will diversify to a certain extent.

Limitation of the model

Despite its monumental theoretical significance, MPT has a slew of opponents who contend that its underlying assumptions and modeling of financial markets are frequently out of step with reality. One could argue that none of them are totally accurate and that each of them undermines MPT to varied degrees. Generally, some of the most common complaints include the following: irrationality of investors, relation between risk and return, treatment of information by investors, limitless borrowing capacity, perfectly efficient markets, and no taxes or transaction costs.

Irrationality of investors

It is assumed that investors are rational and aim to maximize returns while reducing risk. This is contrary to what market participants who become swept up in ‘herd behavior’ investment activity observe. For example, investors frequently gravitate into ‘hot’ industries, and markets frequently boom or burst because of speculative excesses.

Relation between risk and expected return

Increased risk = Increased expected returns. The idea that investors will only take more risk in exchange for higher predicted profits is regularly refuted by investor behavior. Frequently, investing techniques need investors to make a perceived hazardous investment (e.g., derivatives or futures) in order to lower total risk without increasing projected profits significantly. Additionally, investors may have certain utility functions that override worries about return distribution.

Treatment of information by investors

MPT anticipates that investors will get all information pertinent to their investment in a timely and thorough manner. In fact, global markets are characterized by information asymmetry (one party possesses superior knowledge), insider trading, and investors who are just more knowledgeable than others. This may explain why stocks, commercial assets, and enterprises are frequently acquired at a discount to their book or market value.

Limitless Borrowing Capacity

Another critical assumption mentioned previously is that investors have nearly unlimited borrowing capacity at a risk-free rate. Each investor has credit constraints in real-world markets. Additionally, only the federal government may borrow at the zero-interest treasury bill rate on a continuous basis.

Perfectly efficient markets

Markowitz’s theoretical contributions to MPT are predicated on the premise that markets are perfectly efficient (Markowitz, 1952). On the other hand, because MPT is based on asset values, it is susceptible to market whims such as environmental, personal, strategic, or social investment choice factors. Additionally, it ignores possible market failures like as externalities (costs or benefits that are not reflected in pricing), information asymmetry, and public goods (a non-rivalrous and non-excludable item). From another vantage point, centuries of ‘rushes’, ‘booms’, ‘busts’, ‘bubbles’, and ‘market crises’ illustrate that markets are far from efficient.

No Taxes or Transaction Costs

Neither taxes nor transaction costs are included in Markowitz’ theoretical contributions to MPT. To the contrary, genuine investment products are subject to both taxes and transaction costs (e.g., broker fees, administrative charges, and so on), and considering these costs into portfolio selection may certainly affect the optimal portfolio composition.

Conclusion

MPT has become the de facto dogma of contemporary financial theory and practice. The idea of MPT is that beating the market is tough, and those that do do it by diversifying their portfolios properly and taking above-average investing risks. The critical point to remember is that the model is only a tool—albeit the most powerful hammer in one’s financial toolbox. It has been over sixty years since Markowitz introduced MPT, and its popularity is unlikely to decrease anytime soon. His theoretical insights have served as the foundation for more theoretical investigation in the field of portfolio theory. Nonetheless, Markowitz’s portfolio theory is susceptible to and dependent on ongoing ‘probabilistic’ development and expansion.

Why should I be interested in this post?

Modern Portfolio Theory is at the heart of modern finance and its core foundations are structuring the modern investing panorama. MPT has established itself as the foundation for modern financial theory and practice. MPT’s premise is that beating the market is difficult, and those that do it by diversifying their portfolios appropriately and accepting higher-than-average investment risks.

MPT has been around for almost sixty years, and its popularity is unlikely to wane anytime soon. His theoretical contributions have laid the groundwork for more theoretical research in the field of portfolio theory. Markowitz’s portfolio theory, however, is vulnerable to and dependent on continuing ‘probabilistic’ development and expansion.

Related posts on the SimTrade blog

Portfolio Theory

   ▶ Youssef LOURAOUI Implementation of the Markowitz allocation model

   ▶ Youssef LOURAOUI Capital Asset Pricing Model (CAPM)

   ▶ Youssef LOURAOUI Implementation of the Black-Litterman model

   ▶ Youssef LOURAOUI Black-Litterman model

Factor investing

   ▶ Youssef LOURAOUI Factor Investing

   ▶ Youssef LOURAOUI Is smart beta really smart?

Factors

   ▶ Youssef LOURAOUI Size Factor

   ▶ Youssef LOURAOUI Value Factor

   ▶ Youssef LOURAOUI Yield Factor

   ▶ Youssef LOURAOUI Momentum Factor

   ▶ Youssef LOURAOUI Quality Factor

   ▶ Youssef LOURAOUI Growth Factor

   ▶ Youssef LOURAOUI Minimum Volatility Factor

Useful resources

Academic research

Ang, A., 2013. Factor Investing. Working paper.

Mangram, M.E., 2013. A simplified perspective of the Markowitz Portfolio Theory. Global Journal of Business Research, 7(1): 59-70.

Markowitz, H., 1952. Portfolio Selection. The Journal of Finance, 7(1): 77-91.

Mossin, J. 1966. Equilibrium in a Capital Asset Market. Econometrica, 34(4): 768-783.

Sharpe, W.F. 1963. A Simplified Model for Portfolio Analysis. Management Science, 9(2): 277-293.

Sharpe, W.F. 1964. Capital Asset Prices: A Theory of Market Equilibrium under Conditions of Risk. The Journal of Finance, 19(3): 425-442.

About the author

The article was written in September 2021 by Youssef LOURAOUI (ESSEC Business School, Global Bachelor of Business Administration, 2017-2021).

Smart Beta strategies: between active and passive allocation

Smart Beta strategies: between active and passive allocation

Youssef_Louraoui

In this article, Youssef LOURAOUI (ESSEC Business School, Global Bachelor of Business Administration, 2017-2021) discusses the topic of smart beta strategies and especially the debate about its position as an active or passive allocation.

Smart beta strategies appear to be in the middle of the polarized asset management industry, which is segmented between active investing based on beating the performance of a given benchmark, and passive investing based on replicating a given benchmark.

This article is structured as follows: we begin by introducing the topic of smart beta strategies. We then discuss the different investing approach and their characteristic. A simple simulation exercise is then presented to understand how an alternative to market-capitalization-weightings indexes leads to different results. We wrap up with a general conclusion of the topic.

Introduction

Smart beta strategies are often found somewhere in the middle between active and passive investment management. In this post, we look at how investors think about this characteristic of smart beta investment strategies.

Passive funds aim at replicating or tracking an index (such as the S&P500 index in the US or the CAC40 index in France for equity markets) use a buy-and-hold strategy to achieve their goal of mimicking the performance of the market index. The beta of a passive fund is very close to the beta of the market index (benchmark).

Active funds are supervised by a portfolio manager that screens the best investments for the fund and time the market to profit from an upside potential. The excess return over the performance of the market index (benchmark) is referred to as alpha.

Smart beta funds are justified by the fact that capitalization-weighted strategies appear to be inefficient. They are based on transparent and rule-based strategies. Investors seek to obtain additional factor betas to enhance their portfolio performance.

While passive investing aims to match the market return, and active strategies rely on the fund manager’s ability to outperform the market, smart beta can be seen as a hybrid of the two approaches, with a passive component in the sense that it tracks one or more factors that are transparent and rule-based, and an active component in which the portfolio is managed, that is to say, rebalanced from time to time. Table 1 describes the main types of funds (passive, active and smart beta) and their respective strategies according to the investment approach and asset allocation methodology, and performance metrics. We also indicate the Greek letter that each strategy.

Table 1. Description of the main types of funds and their respective strategies.
main types of funds and their respective strategies
Source: table done by the author.

The passive investing approach

The Efficient Market Hypothesis (EMH) asserts that markets are efficient. The passive investing strategy is built on the concept of “buy-and-hold,” or keeping an investment position for a lengthy period without worrying about market timing or acting on the bought position. This latter technique is frequently implemented through the purchase of exchange-traded funds (ETF) that aim to closely match a given benchmark to produce a performance that is comparable to the underlying index or benchmark. The index might be broad-based, such as the S&P500 index in the US equity market for instance, or more specialized, such as an index that monitors a specific sector or geographical zone.

The active investing approach

Active management is an approach for going beyond matching a benchmark’s performance and instead aiming to outperform it. The alpha may be calculated using the same CAPM model framework, by linking the expected return with the fund manager’s extra return on the portfolio’s overall performance (Jensen, 1968). The search for alpha is done through two very different types of investment approaches: stock picking and market timing.

Stock picking

Stock picking is a method used by active managers to select assets based on a variety of variables such as their intrinsic value, the growth rate of dividends, and so on. Active managers use the fundamental analysis approach, which is based on the dissection of economic and financial data that may impact the asset price in the market.

Market timing

Market timing is a trading approach that involves entering and exiting the market at the right time. In other words, when rising outlooks are expected, investors will enter the market, and when downward outlooks are expected, investors will exit. For instance, technical analysis, which examines price and volume of transactions over time to forecast short-term future evolution, and fundamental analysis, which examines the macroeconomic and microeconomic data to forecast future asset prices, are the two techniques on which active managers base their decisions.

Review of academic literature

Passive investing

We can retrace the foundations of passive investing to the theory of portfolio construction developed by Harry Markowitz. For his theoretical implications, Markowitz’s work is widely regarded as a pioneer in financial economics and corporate finance. For his contributions to these disciplines, which he developed in his thesis “Portfolio Selection” published in The Journal of Finance in 1952. Markowitz received the Nobel Prize in economics in 1990. His groundbreaking work set the foundation for what is now known as ‘Modern Portfolio Theory’ (MPT).

William Sharpe, John Lintner, and Jan Mossin separately developed The Capital Asset Pricing Model (CAPM) as a result of Markowitz past research. The CAPM was a huge evolutionary step forward in capital market equilibrium theory because it enabled investors to appropriately value assets in terms of systematic risk. The portfolio management industry intended to capture the market portfolio return in the late 1970s, defined as a hypothetical collection of investments that contains every kind of asset available in the investment universe, with each asset weighted in proportion to its overall market participation. A market portfolio’s expected return is the same as the market’s overall expected return. But as financial research evolved and some substantial contributions were made, new factor characteristics emerged to capture some additional performance.

Active investing

As fund managers tried strategies to beat the market, financial literature delved deeper into the mechanism to achieve this purpose. Jensen’s groundbreaking work in the early ’70s gave rise to the concept of alpha in the tracking of a fund’s performance to distinguish between the fund’s manager’s ability to generate abnormal returns and the part of the returns due to luck (Jensen, 1968).

Smart beta / factor investing

Smart beta is defined as strategies that aim to address the inefficiencies of market capitalization weight indexation. In the early 2000s, as a result of numerous financial publications delving deeper into various elements that gave additional returns to increase the overall performance of the portfolio (the “Fama-French” papers), smart beta strategies evolved. Fund managers develop investment strategies based on researched factors that provide a time-tested abnormal return in exchange for taking on risk.

Understanding portfolio returns is crucial to determining how to evaluate portfolio performance. It all stems from Harry Markowitz’s groundbreaking work and pioneering research on portfolio construction and the impact of diversification in improving portfolio performance. Throughout the 1960s and 1970s, investors made no distinction between the sources of portfolio returns. Finance research in the 1980s boosted the popularity of passive investment as an alternate basis for implementation. Investors began to successfully capture market beta through passive strategies. In the 2000s, investors began to see factors as major determinants of long-term return (Figure 1).

Figure 1. Overview of the evolution of performance metrics.
Overview of the evolution of performance metrics
Source: MSCI Factor Research (2021).

Grossman and Stiglitz’s research addressed the limitations of passive investment (1980). If the fund manager actively selects assets for his portfolio rather than passively replicating the benchmark, he may get higher abnormal returns. The term “abnormal returns” refers to the disparity between the actual and projected returns. In the financial literature, this “extra return” is referred to as alpha. It is one of the most tracked performance indicators by fund managers. Grossman and Stiglitz establish that there is no such thing as a successful passive investment. Indeed, they said that the benchmark is composed of assets chosen based on certain criteria (capitalization, return, liquidity, and the weight of each asset in the sector), and that “passive investing” is the most cost-effective alternative to active investing.

As pointed out by Jensen (1968), when assembling a portfolio, there are two points to bear in mind. The first point is the fund manager’s ability to foresee the asset’s price movement, and the second point is the fund manager’s capacity to limit investment risk via diversification.

Case study: Comparison of market-capitalization-weighted portfolios and equally-weighted portfolios

The difference between two investment strategies can be evaluated by comparing the weights of the assets of their associated portfolio. Note that over time the weights can evolve with voluntary sales and purchases of the assets. Such divestments and investments refer to the rebalancing of the portfolio.

Buy-and-hold investing is a passive investment strategy in which an investor buys assets and holds them for a long period, independent of market fluctuations. A buy-and-hold investor selects companies but is indifferent to short-term market swings or technical indicators. The buy-and-hold investment strategy corresponds to market-capitalization-weighted portfolios.

The buy-and-hold approach is recommended by several prominent investors, like Warren Buffett, to individuals seeking profitable long-term returns. Buy-and-hold investors outperform active management on average over longer time horizons and after costs. Buy-and-hold investors, on the other hand, may not sell at the greatest price available, according to proponents.

Excel file for market-capitalization-weighted and equally-weighted portfolios

You can download an Excel file with data used for this exercise.

Download the Excel file to compute Exercise Market Cap Equally Weighted Portfolios

The goal of this exercise is to compare the performance of the two types of investments and to balance the two approaches to obtain a better understanding of each strategy and its market behavior. To be able to homogeneously analyze the underlying assets of the buy and hold strategy as well as the smart beta approach, three stocks have been simulated.

All the price data, number of shares, stock returns, and market-capitalization are all simulated for a more simplistic model. The buy and hold strategy is based on an evenly weighted portfolio. Only the small-cap stock (Stock 1) will have prices fluctuations to analyze the size effect as a driver of returns in a portfolio. A rebalancing exercise is implemented for the smart beta portfolio, no trading nor any related cost for implementing the strategy is applied and thus, don’t reflect the full picture as in financial markets.

Table 2 is made of three components. The first section of the table represents our data for the simulation. Each stock has a different size representing respectively a small, mid, and large-capitalization firm. Market capitalization is obtained through a simple computation by multiplying the number of shares times the price of each share. The second section of the table is the simulation of a market-capitalization-weighted portfolio. The third section represents a smart beta portfolio that uses an equally-weighted weighting indexing (Table 2). Note that with the market-capitalization-weighted portfolio there is a concentration in the stock with the largest market capitalization (due to its high past performance). An equally-weighted portfolio obtained with rebalancing (often associated with smart beta strategies such as growth) would not present such property and show a more diversified portfolio over time. Note that the frequency of rebalancing the portfolio can affect the risk/performance characteristics. Amenc et. al. (2016) show that the Sharpe ratio tends to decrease with a higher frequency for rebalancing.

Table 2. Simulation of a market-capitalization-weighted portfolio and an equally-weighted portfolio.
Smart_beta_simulation_spreadsheet
Source: simulations and calculations by the author.

The simulation unveiled that the market-capitalization-weighted portfolio’s size anomaly failed to capture the outperformance of small-cap stocks, resulting in results that were lower than those of the smart beta equally weighted portfolio, which had a good exposure to small caps (Figure 2). The key point of this simulated model is that the market-cap indexation has a defect related to the concentration of large companies in the profile of small caps which represent a small percentage of the index. The size factor is based on a risk factor that aims to capture the documented outperformance of small-cap firms compared to larger enterprises. With this simulated model, we have proven with a very simple model in the conception that the size anomaly can indeed be a vector of return, as researched in the paper of Banz (1981) which precisely describes this concept on the US equity market (Figure 2).

Figure 2. market-capitalization-weighted portfolio vs equally-weighted portfolio.
Market_cap_eq
Source: simulations and calculations by the author.

One aspect to consider in this case analysis is that one of the possible explanations for this outperformance is that the weights are changed at rebalancing dates rather than allowed to drift with the price fluctuations, which is a clear distinction between cap-weighted indexes and smart beta strategies. Some claim that this rebalancing completely explains the success of smart beta strategies (Amenc et al, 2016). This allegation, however, does not hold up under investigation. An examination of buy-and-hold portfolios vs portfolios rebalanced at various frequencies reveals that whether or not rebalancing improves performance is dependent on the return behavior of the assets in the portfolio. Rebalancing may or may not provide better results than buy-and-hold tactics (Amenc et. al., 2016).

Even if beneficial rebalancing impacts occur, Smart Beta methods may not be able to capture them. Contrary to popular belief, data shows that rebalancing an equal-weighted approach more frequently does not always increase performance. Furthermore, both short- and long-term reversal effects are empirically insignificant in explaining the performance of a wide variety of Smart Beta strategies. Naturally, rebalancing is necessary, especially to maintain diversity and target factor exposures. Rebalancing, on the other hand, is not an experimentally verified source of Smart Beta strategy performance (Amenc et. al., 2016).

Smart beta: passive or active investment strategy?

Smart beta investing is considered a hybrid strategy because it attempts to replicate the performance of a predetermined benchmark without engaging in market timing or stock picking, and an active strategy because investors choose to gain exposure to specific factors (beyond the market factor) by rebalancing the portfolio according to some rules. In practice, smart beta strategies often imply rebalancing to maintain target weights for each factor. In this sense, smart beta strategies are active, or at least more active than the buy-and-hold strategy. However, the rebalancing of portfolios of smart beta strategies is usually done with a predefined rule. In this sense, smart beta strategies are passive, or at least more passive than discretionary investment strategies based on stock picking and market timing.

Why should I be interested in this post?

If you are a business school or university undergraduate or graduate student, this content will help you in understanding the various evolutions of asset management throughout the last decades and in broadening your knowledge of finance beyond the classical 101 course.

Smart beta funds have become a hot issue among investors in recent years. Smart beta is a game-changing invention (or just a new marketing idea?) that addresses an unmet need among investors: a higher return for lower risk, net of transaction and administrative costs. In a way, these tactics create a new market. As a result, smart beta is gaining traction and influencing the asset management market.

Related posts on the SimTrade blog

   ▶ Youssef LOURAOUI Factor Investing

   ▶ Youssef LOURAOUI Origin of Factor Investing

Factor series

   ▶ Youssef LOURAOUI Size Factor

   ▶ Youssef LOURAOUI Value Factor

   ▶ Youssef LOURAOUI Yield Factor

   ▶ Youssef LOURAOUI Momentum Factor

   ▶ Youssef LOURAOUI Quality Factor

   ▶ Youssef LOURAOUI Growth Factor

   ▶ Youssef LOURAOUI Minimum Volatility Factor

Useful resources

Academic research

Amenc, N., Ducoulombier, F., Goltz, F. and Ulahel, J., 2016. Ten misconceptions about smart beta. EDHEC Risk Institute Working paper.

Banz, R.W., 1981. The relationship between return and market value of common stocks. Journal of Financial Economics, Volume 9, pp. 3-18.

Fama, E.F., French, K.R., 1992. The cross-section of expected stock returns. The Journal of Finance, 47: 427-465.

Grossman, S., Stiglitz, J., 1980. On the impossibility of Informationally efficient markets. The American Economic Review, 70(3), 393-408.

Jensen, M.C. 1968. The performance of mutual funds from 1945–1964. The Journal of Finance, 23:389-416.

Malkiel, B., 1995. Returns from Investing in Equity Mutual Funds 1971 to 1991. The Journal of Finance, 50(2):549-572.

Business analysis

BlackRock Research, 2021. What is Factor Investing?

About the author

The article was written in September 2021 by Youssef LOURAOUI (ESSEC Business School, Global Bachelor of Business Administration, 2017-2021).

Hedging strategies – Equities

Hedging Strategies – Equities

Akshit Gupta

This article written by Akshit GUPTA (ESSEC Business School, Master in Management, 2019-2022) presents the different hedging strategies based on option contracts.

Introduction

Hedging is a risk mitigation strategy used by investors reduce the risk in an existing investment. In financial markets, hedging is used as an effective tool by investors to minimize the risk exposure and maximize the returns for any investment in securities. Equity options are commonly used by investors / traders as hedging mechanisms due to their great flexibility (in terms of expiration date, moneyness, liquidity, etc.) and availability. Hedging does not eliminate the entire risk for any investment but often limits the potential losses that the investor can incur. Positions in equity options are used to offset the risk exposure in the underlying equity, another option contract or in any other derivative contract.

Different strategies used in hedging

There are many ways to hedge the exposure in any given security. Some of the most used hedging strategies for an exposure in equity includes the following:

Writing a covered call

A call option gives the buyer of the option, the right but not the obligation, to buy a security at a fixed date and price defined in the contract. In a covered call, the investor writes (sells) a call option on the stock he holds in his portfolio. He earns the premium by writing the call option. Investors execute this strategy when they are bullish about the stock. The maximum payoff potential from this strategy is limited but the potential downside/losses is can be quite high (although limited).

Covered call

Buying a protective put

A put option gives the buyer of the option, the right but not the obligation, to sell a security at a fixed date and price defined in the contract. In a protective put, the investor buys a put option on the stock she holds in her portfolio. She pays the premium by buying the put option. Investors execute this strategy when they are bearish about the stock. The maximum payoff potential from this strategy is unlimited but the potential downside/losses is limited.

Protective Put

Spreads

Spreads are option hedging strategies where the investor/trader will take positions in multiple options of the same type (either call options or put options on the same underlying). The different types of spreads are mentioned below:

Strangle and Straddle

In a strangle, the investor buys a European call and a European put option, both at the same expiration date but different strike prices. To benefit from this strategy, the price of the underlying asset must move further away from the central value in either direction i.e., increase or decrease. If the stock prices stay at a level closer to the central value, the investor will incur losses. This strategy is suitable for investors who expect a huge price movement but are unsure of the direction of the movement.

Strangle

In a straddle, the investor buys a European call and a European put option, both at the same expiration date and at the same strike price. This strategy works in a similar manner like a strangle. However, the potential losses are a bit higher than incurred in a strangle if the stock price remains near the central value at expiration date.

Straddle

Bull and Bear spreads

In a bull spread, the investor buys a European call option on a stock with strike price K1 and sells a call option on the same stock at strike price K2 (which is higher than K1) at the same expiration date. The investor forecasts the prices to go up and is bullish about the stock. The spread limits the potential downside risk on buying the call option, but also limits the potential profit by capping the upside. It Is used as an effective hedge to limit the losses.

Bull spread

In a bear spread, the investor expects the prices of the stock to decline. In order to hedge against the downside, the investor buys a put option at strike price K2 and sells a put option at strike price K1, where K1 < K2. Initially, this strategy leads to a cash outflow since the put option is sold at a lower strike price, which results in lower premium.

Bear spread

Useful Resources

Hull J.C. (2015) Options, Futures, and Other Derivatives, Ninth Edition, Chapter 10 – Trading strategies involving Options, 276-295.

Investopedia Using Options as a Hedging Strategy

Related Posts

   ▶ Gupta A. Option Greeks – Delta

   ▶ Gupta A. History of Options markets

   ▶ Gupta A. Option Trader – Job description

   ▶ Gupta A. Options

About the author

Article written in September 2021 by Akshit GUPTA (ESSEC Business School, Master in Management, 2019-2022).