Analysis of synergy-based theories for M&A

In this article, Suyue MA (ESSEC Business School, Global Bachelor of Business Administration, 2017-2021) analyzes the synergy-based theories for M&As.
This article is structured as follows: I will first share with my professional experience. I will introduce the concepts of M&A and a brief analysis of past M&A market activity. We then expose the different theories based on synergies emphasized by companies in M&A deals.
About myself
I have been interested in finance ever since I started my study at ESSEC Business School in 2017. By acknowledging more about finance, during my 2nd year of study, I decided to build up my career in corporate finance, focusing on the primary market. By sending around 400 resumes to different companies and banks, I finally worked in the field of M&A. Until now, I have finished four internships in the field of corporate finance, private equity, capital-raising advisory, and mergers and acquisitions (M&A).
In this article, I would like to share with you about some very important M&A theories based on synergies that most of companies decided to execute as effective corporate strategies.
Introduction
M&As are defined as consolidation of companies, and it refers to corporate finance, corporate strategy, and corporate management, dealing with selling, buying, or combination of different firms, which can create resources, financing, and business development to a firm to grow its business without the need of creating a new business entity. Normally, a merger occurs between companies that have related interests with a similar company size or market cap. In addition, a merger is commonly understood as a fusion of two companies, which the bigger and better company will remain its name and status while the other one will disappear and not exist as a unique business entity. Nevertheless, acquisition means that a company is going to pay a certain price (in cash or stocks) to buyout or acquire the target company’s part of or full of stock right, achieving the controlling right or assets of the company that is being acquired, but the legal person’s status will remain.
To put in a nutshell, based on the historical M&A transactions, the primary objectives behind a merger or acquisition are to create long-term shareholder value, achieve larger market share, and improve the company’s efficiency. However, obviously, there are also a great number of M&A activities failed to reach such goals or even ruined companies. According to the collated research and a recent Harvard Business Review report in 2021, the M&A’s failure rate sites between 70% to 90%, which is an extremely high figure even though the report takes all rage of business, culture factors, and objectives factors into considerations. Thus, it remains doubtful whether a M&A transaction can help company’s development and create shareholder’s value.
Nowadays, companies use M&A for various reasons because companies are always facing the issues of dealing with global competition, market globalization, and constant technology innovation. It is now a fact that M&A has become the most popular corporate strategy around the world. We may ask why the management and shareholder boards are using merger and acquisition to promote the company’s advancement and shareholders’ return instead of other strategies, such as doing investments and innovations. According to the aforementioned report, some finance professionals believe that such transactions create short-cut for companies’ growth and market share, since the companies do not need to start a business sector over again, in which the risk of running a successful business is high and the cost of capital is high as well. On the contrary if both buy-side and sell-side companies can find synergies that benefit each other, ideally, they will gain more revenues due to the positive reaction, and therefore create value for their shareholders. Thus, here I will dig deeper in the following theories and synergies to better understand the aim and purpose of M&A.
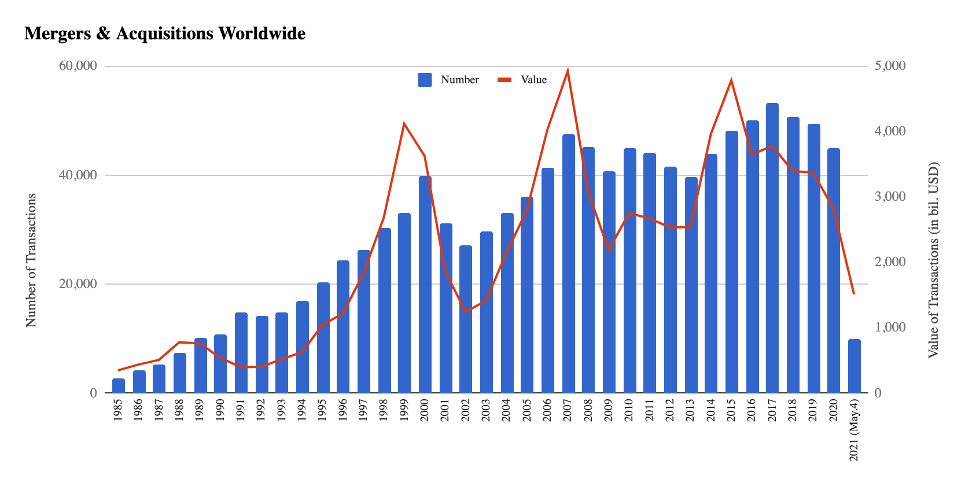
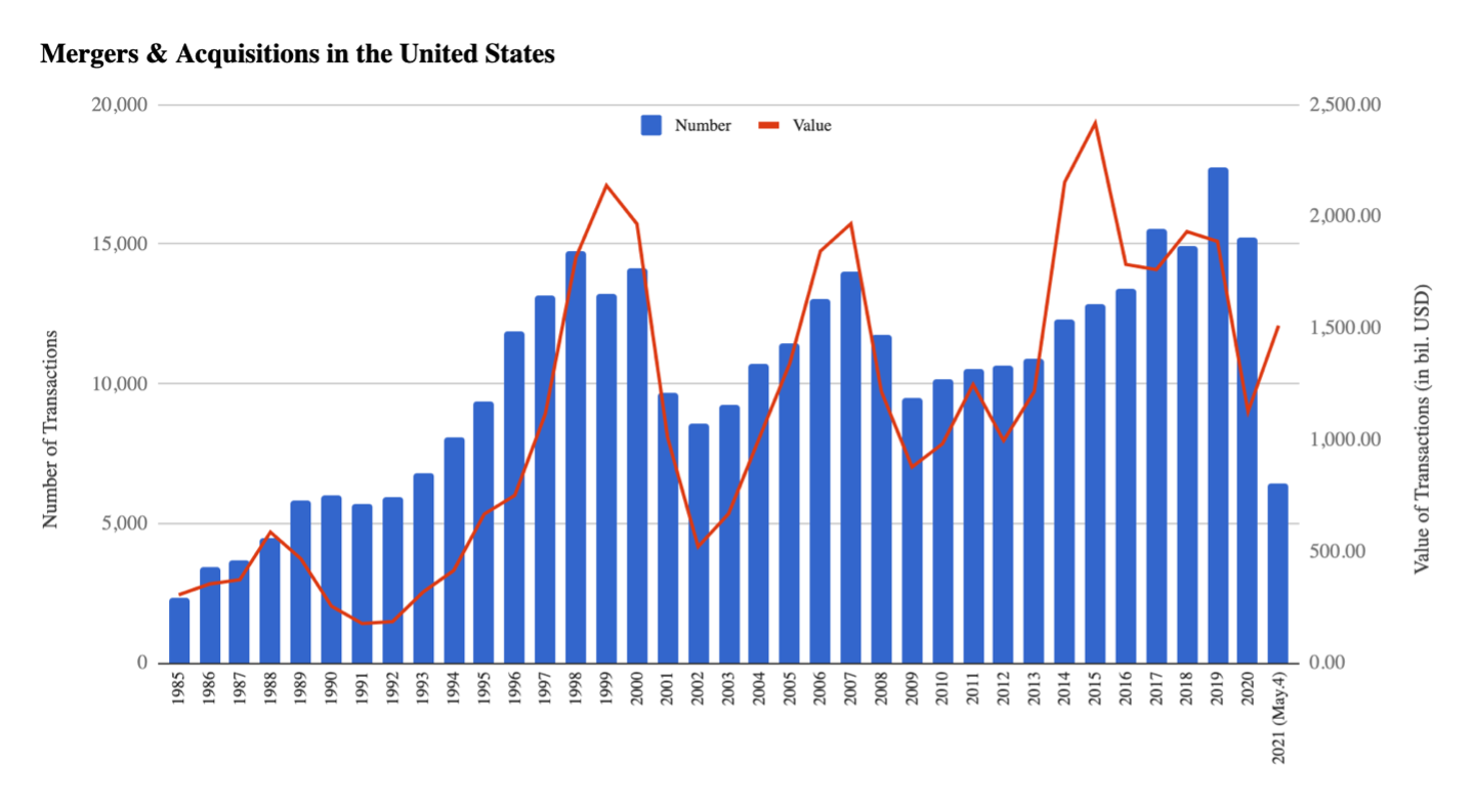
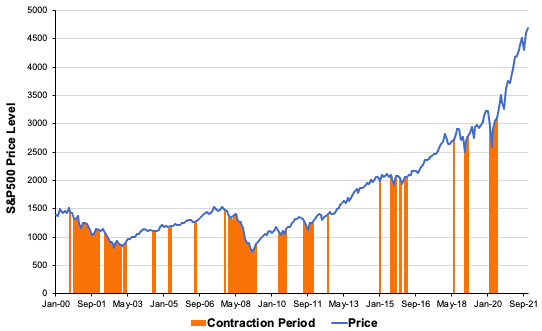
The figures above are about the number and value of M&A transactions in both U.S. and worldwide in the last two and half decades (1985-2020). The reason why I choose these geographic locations is because the global M&A transactions’ number and value can provide us the activity level of the market; secondly, the U.S. market has the most active level from all time, and therefore, by viewing such figures, it can provide us a very clear overview of the market. According to both figures above, both M&A’s value and transactions are increasing stably except three serious drops in year of 2000, 2008, and 2020. The first drop is because of 2000’s financial crisis that happened in most of developed countries; the second drop happened right after the U.S. subprime crisis, and the last drop just happened from years of 2019 to 2021, in which the whole world was shut down because of COVID-19 virus. A great number of big companies went bankrupt and most of financial institutions had to stop their operations. What is more, we can find that after each recession, the value and number of M&A transactions rebounded rapid to the average level and kept increasing the volume within the following years. As I mentioned previously, although M&As have a super rate of failure, the success rate of successful company’s transactions must surpass the risks involved. Consequently, it is not difficult to explain why companies are keeping entering M&A transactions.
M&A’s main theories
The history of mergers and acquisitions exists for more than a hundred years, and financial professionals and scholars came forward with a great number of merger and acquisition theories. Most of these theories are based on the motives and benefits of merger and acquisition, and several major models have been developed. The following part is a brief introduction of these theories.
Efficiency theory assumes that both the acquiring company and the target company are interested in maximizing shareholder value, that the merger is a value-adding investment for both the acquiring company and the target company; the total benefits of the merger (the sum of the values of target and acquiring companies after vs before the deal) are positive. Efficiency theories are powerful in explaining the motivation of mergers, but the exact motivation of mergers in terms of synergies and efficiency improvements requires further examination and analysis and is beyond the scope of this dissertation. The different sources of efficiency theory based on value addition can be divided into the following areas: management synergy, operating synergy, diversification and strategic synergy, financial synergy, and undervaluation theory.
Management synergy
Since there are differences between the management capabilities of any two firms, the merger and acquisition activity may enable the more efficient management capabilities to diffuse in the new post-acquisition firm, bringing about efficiency improvements. For example, a relatively efficient firm may improve the management and operations of the acquired firm by acquiring a relatively inefficient firm to improve efficiency, thus increasing the value of the acquired firm; or a firm with relatively poor management efficiency may acquire a firm with higher management efficiency to improve its own efficiency, thus acquiring the organizational capital unique to the acquired firm.
Operating synergy
Operating synergies assume that there are economies of scale and economies of scope, which are cost advantages reaped by companies when production becomes efficient, in an industry, and that through merger and acquisition, companies can improve their original operating efficiency. In this theory, merger and acquisition can create great value.
The scale of the enterprise before the merger is far from the economies of scale, and the enterprise entity (consortium) formed after the merger can minimize the cost or maximize the profit in production, personnel, equipment, management, and sales. On the other hand, through vertical mergers, enterprises at different stages of development in the industry can be combined to reduce transaction costs and obtain effective synergies. Economies of scope mean that companies can use their existing product manufacturing and sales experience to produce related add-on products at a lower cost. For example, in the automotive industry, additional production of small cars and various vans would benefit from the existing automotive technology and manufacturing experience.
Diversification and strategic synergy
Companies can diversify their operations through M&A activities, which can diversify risks and stabilize revenue streams and provide employees with greater security and advancement opportunities; ensure continuity of the corporate team and organization; secure the company’s reputation. For strategic synergy, the company can acquire new management skills and organizational costs through M&A to increase the ability to enter new growth areas or overcome new competitive threats.
Financial synergy
One source of financial synergy is the lower cost of internal and external financing. For example, companies with high internal cash flow and low investment opportunities should have excess cash flow, while companies with lower internal capital production capacity and significant investment opportunities should require additional financing. Therefore, merger of these two firms may have the advantage of lower internal capital costs. On the other hand, the combined firm’s ability to leverage debt is greater than the sum of ability of the two firms before the merger, which provides a tax saving advantage.
Undervaluation theory
This theory suggests that the most direct basis for M&A comes from the difference in the value of the target company as judged by different investors and market players, since there is no purely efficient stock market in the world, it is possible that market value of the target company is lower than its true or potential value for some reason. The main reasons for undervaluation are: first, the inability of the target company’s management to realize the full potential of the company. The second reason could be insider information, because the M&A firm has information about the true value of the target company that is not known to the outside world. Thirdly, the Q-ratio. This is the ratio of the market value of the firm’s securities over the replacement cost of its assets. When inflation persists, as the Q ratio falls below one, it is cheaper to acquire an existing firm than to build a new one.
Useful resources
Institute of Mergers, Acquisitions and Alliances (IMAA) M&A Statistics.
Christensen, C.M., Alton, R., Rising, C., Waldeck, A., (March 2011) The Big Idea: The New M&A Playbook Harvard Business Review (89):48-57.
Dineros-De Guzman, C., (May 2019) Creating value through M&A PWC.
Related posts on the SimTrade blog
▶ Suyue MA Expeditionary experience in a Chinese investment banking boutique
▶ Raphaël ROERO DE CORTANZE In the shoes of a Corporate M&A Analyst
▶ Louis DETALLE How does a takeover bid work & how is it regulated?
▶ Maite CARNICERO MARTINEZ How to compute the net present value of an investment in Excel
About the author
The article was written in January 2022 by Suyue MA (ESSEC Business School, Global Bachelor of Business Administration, 2017-2021).


 .
.


 Source: Computations from the author.
 Source: Computations from the author.
 Source: Computation from the author.
 Source: Computation from the author.