In this article, Nithisha CHALLA (ESSEC Business School, Grande Ecole Program – Master in Management (MiM), 2021-2024) delves into the top five companies in the technology sector by market capitalization. For each tech company, I provide information into their origins, latest announcements, and notable developments to provide financial professionals and students with actionable insights.
Introduction
The top tech companies are not only industry innovators but also major drivers of global financial markets. Their influence extends from stock market trends to shaping global investment strategies. Their products and services help other companies to improve their productivity. These companies, Apple, Nvidia, Microsoft, Amazon, and Alphabet, dominate global market capitalizations through their relentless focus on advanced technologies like artificial intelligence (AI), cloud computing, and digital services. We examine below the top five tech firms by market capitalization, delving deeper into their financial performance, innovation strategies, and implications for finance professionals.
The picture below shows the world’s 50 valuable companies by market capitalization (Companies Market Cap, August 2024). We can observe that the top 5 companies are related to the technology industry.
World’s top 50 valuable companies by market capitalization

Source: Companies Market Cap.
The market capitalization, commonly called a “market cap”, is the total market value of a publicly traded company’s outstanding shares and is widely used to measure how much a company is worth. In most cases, it can be easily calculated by multiplying the share price with the amount of outstanding shares.
Apple
Apple Inc was founded in 1976 by Steve Jobs, Steve Wozniak, and Ronald Wayne in Cupertino, California. Known for its consumer electronics like the iPhone, Mac, and Apple Watch, Apple also thrives in services such as the App Store and Apple Music, contributing to over 20% of its revenue. Apple consistently generates substantial revenue from its ecosystem of devices and services. In fiscal 2024, its services division alone brought in over $70 billion, reflecting a 25.17% change in the market capitalization growth from the previous year.
Logo of Apple Inc.
Source: the company.
As of December 2024 Apple has a market cap of $3.748 Trillion USD. This makes Apple the world’s most valuable tech company by market cap according to “companies market cap” company data.
The picture below shows the market capitalization history of Apple from 1996 to 2024.
Market cap history of Apple from 1996 to 2024

Source: Companies Market Cap.
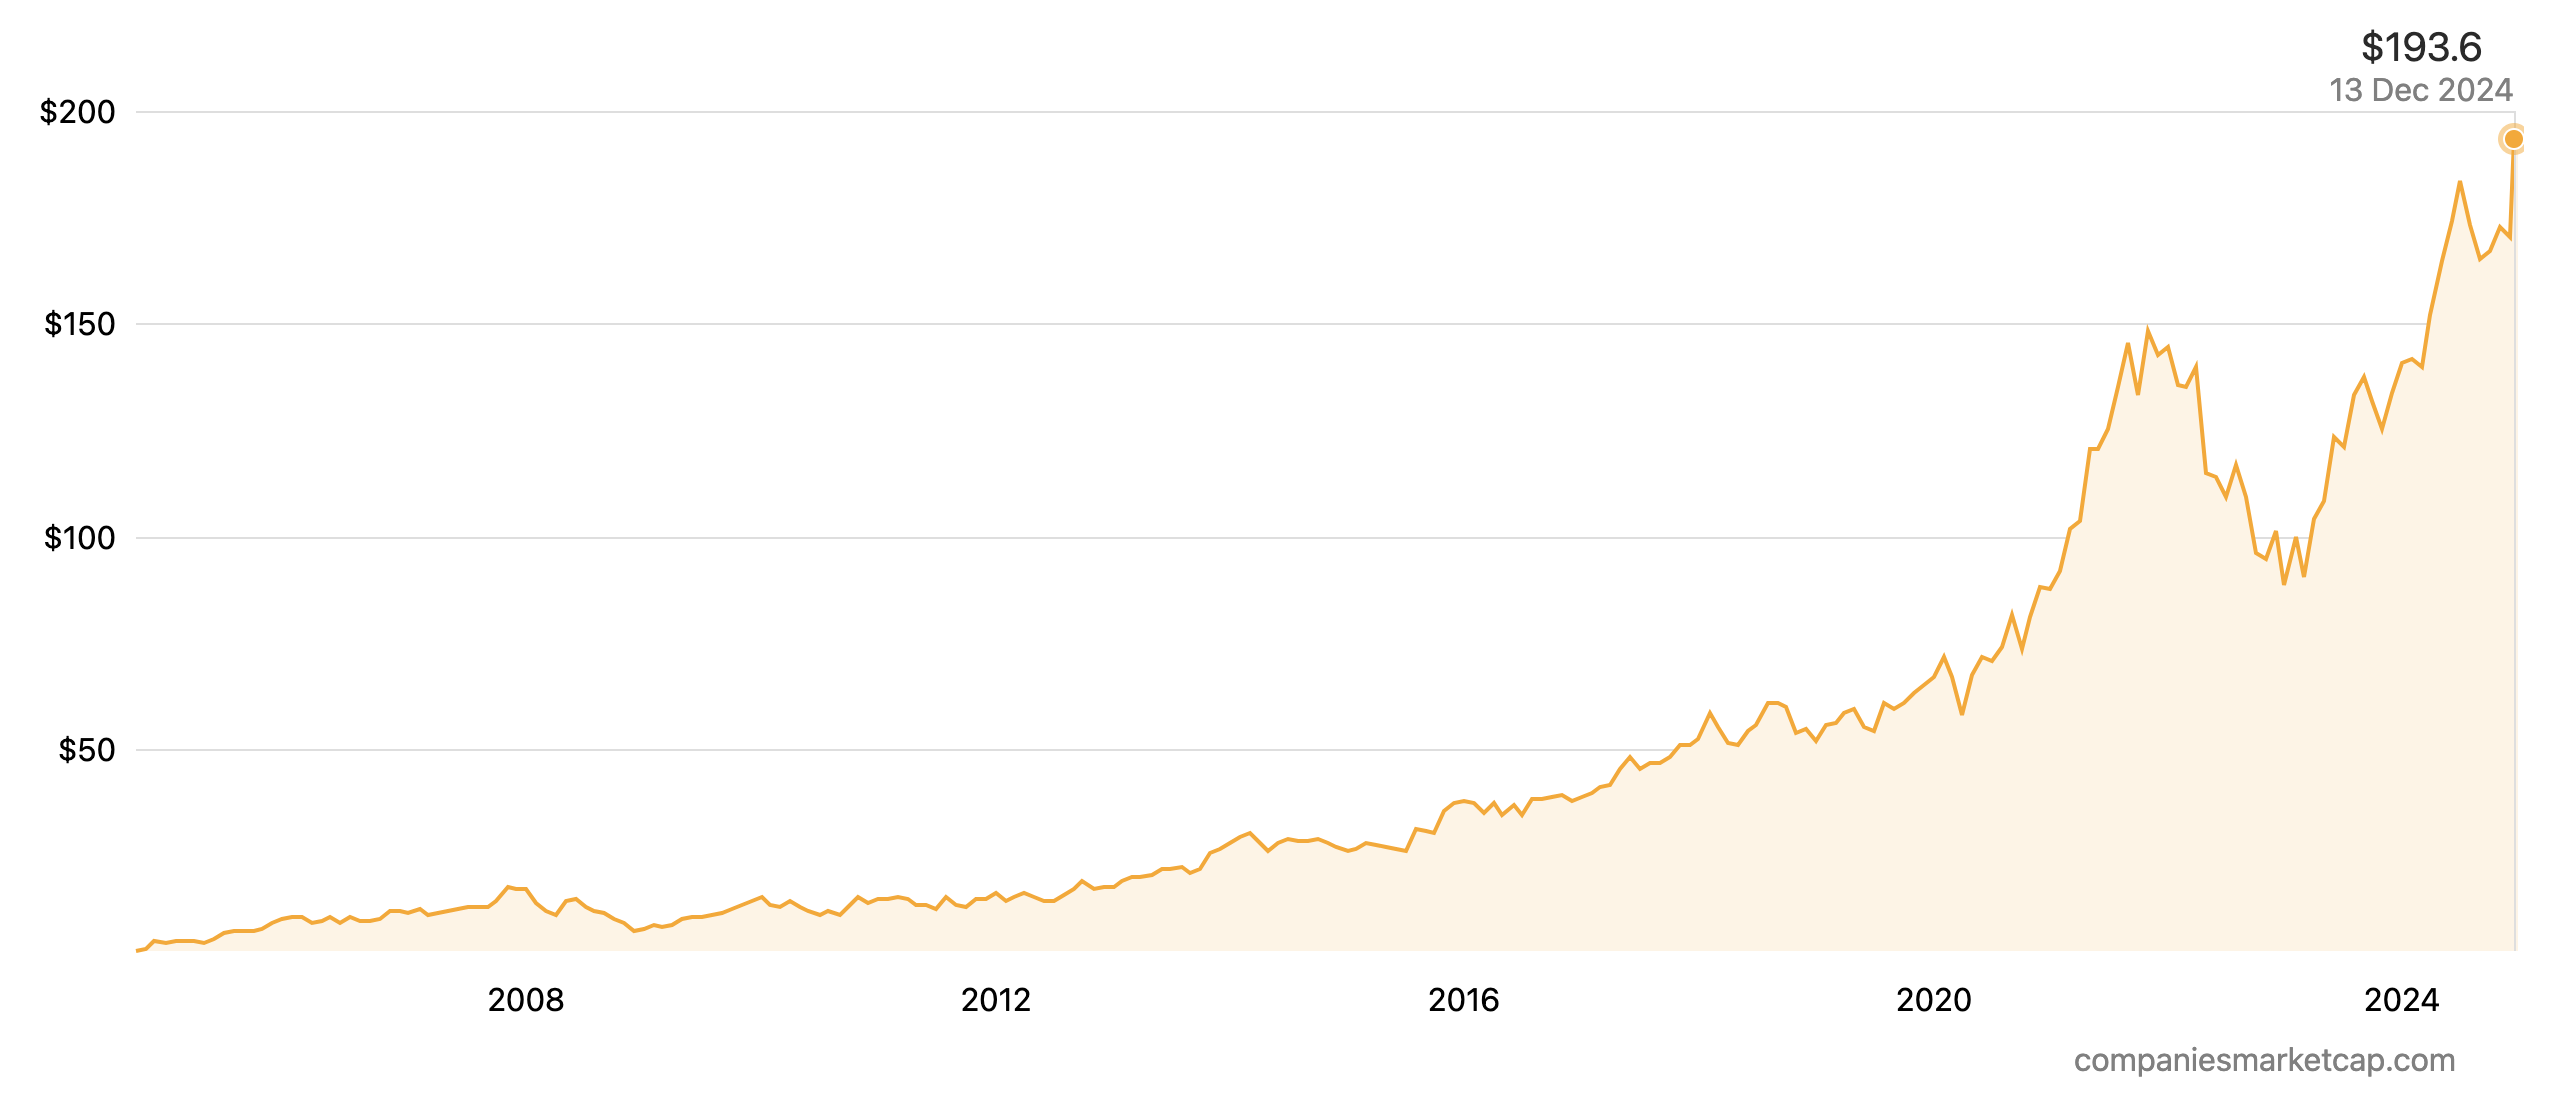
The picture below shows the stock price history of Apple from 1980 to 2024.
Stock price history of Apple from 1980 to 2024
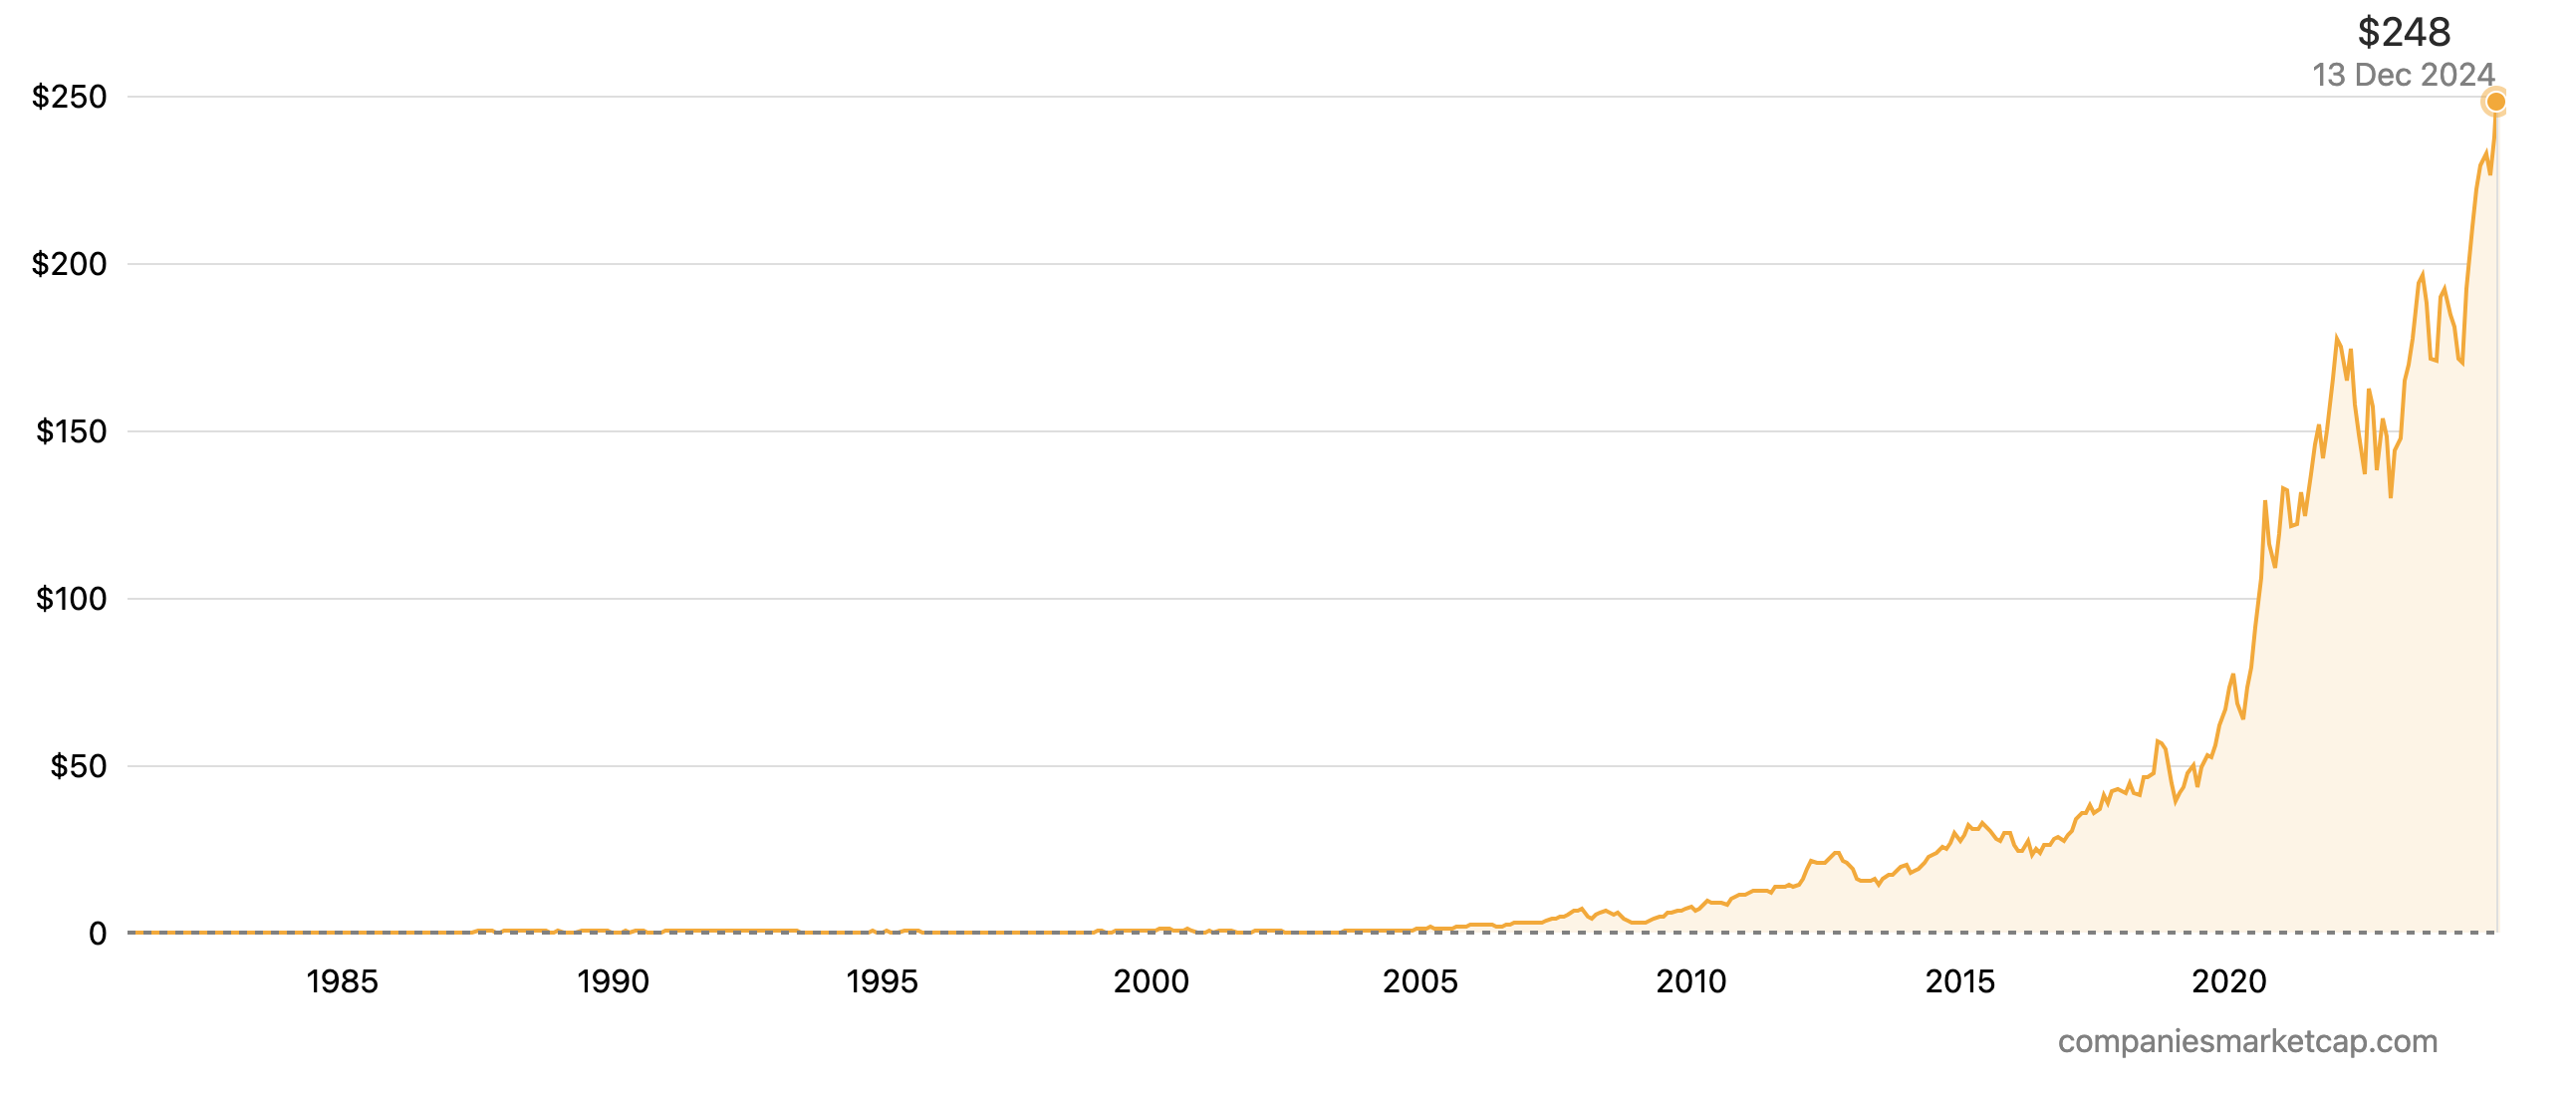
Source: Companies Market Cap.
The company’s stock remains a popular choice for institutional investors due to its consistent performance and market leadership. Apple has steadily increased its dividend and share buybacks, returning over $100 billion to shareholders annually in recent years. Despite declining iPhone sales, Apple’s diversification into wearables and services helped sustain strong financials. It also topped the list of the world’s most valuable global brands in 2023 with a brand value of $880 billion (Business 2 community, 2024).
Initially focused on personal computers, Apple has evolved into a consumer electronics powerhouse. In recent years, its technological innovations, including the Vision Pro mixed-reality headset announced in 2023, underscore its push into augmented and virtual reality spaces. Its expansion into India has been a game-changer, with manufacturing operations set to reduce costs and increase market penetration in one of the fastest-growing smartphone markets.
Initially focused on personal computers, Apple has evolved into a consumer electronics powerhouse. In recent years, its technological innovations, including the Vision Pro mixed-reality headset announced in 2023, underscore its push into augmented and virtual reality spaces. Its expansion into India has been a game-changer, with manufacturing operations set to reduce costs and increase market penetration in one of the fastest-growing smartphone markets.
Nvidia
Founded in 1993, Nvidia Corporation is a leader in Graphics Processing Unit (GPU) development, powering the AI revolution. Its AI hardware is critical for training large language models (LLMs), cementing its role in both consumer gaming and enterprise-level AI solutions. In fiscal 2024, its services division alone brought in over $1.8 trillion, reflecting a 178.92% change in the market capitalization growth from the previous year.
Logo of Nvidia
Source: the company.
As of December 2024, Nvidia has a market cap of $3.411 Trillion USD. This makes Nvidia the world’s 2nd most valuable tech company by market cap according to “companies market cap” company data. The market capitalization, commonly called market cap, is the total market value of a publicly traded company’s outstanding shares and is widely used to measure how much a company is worth.
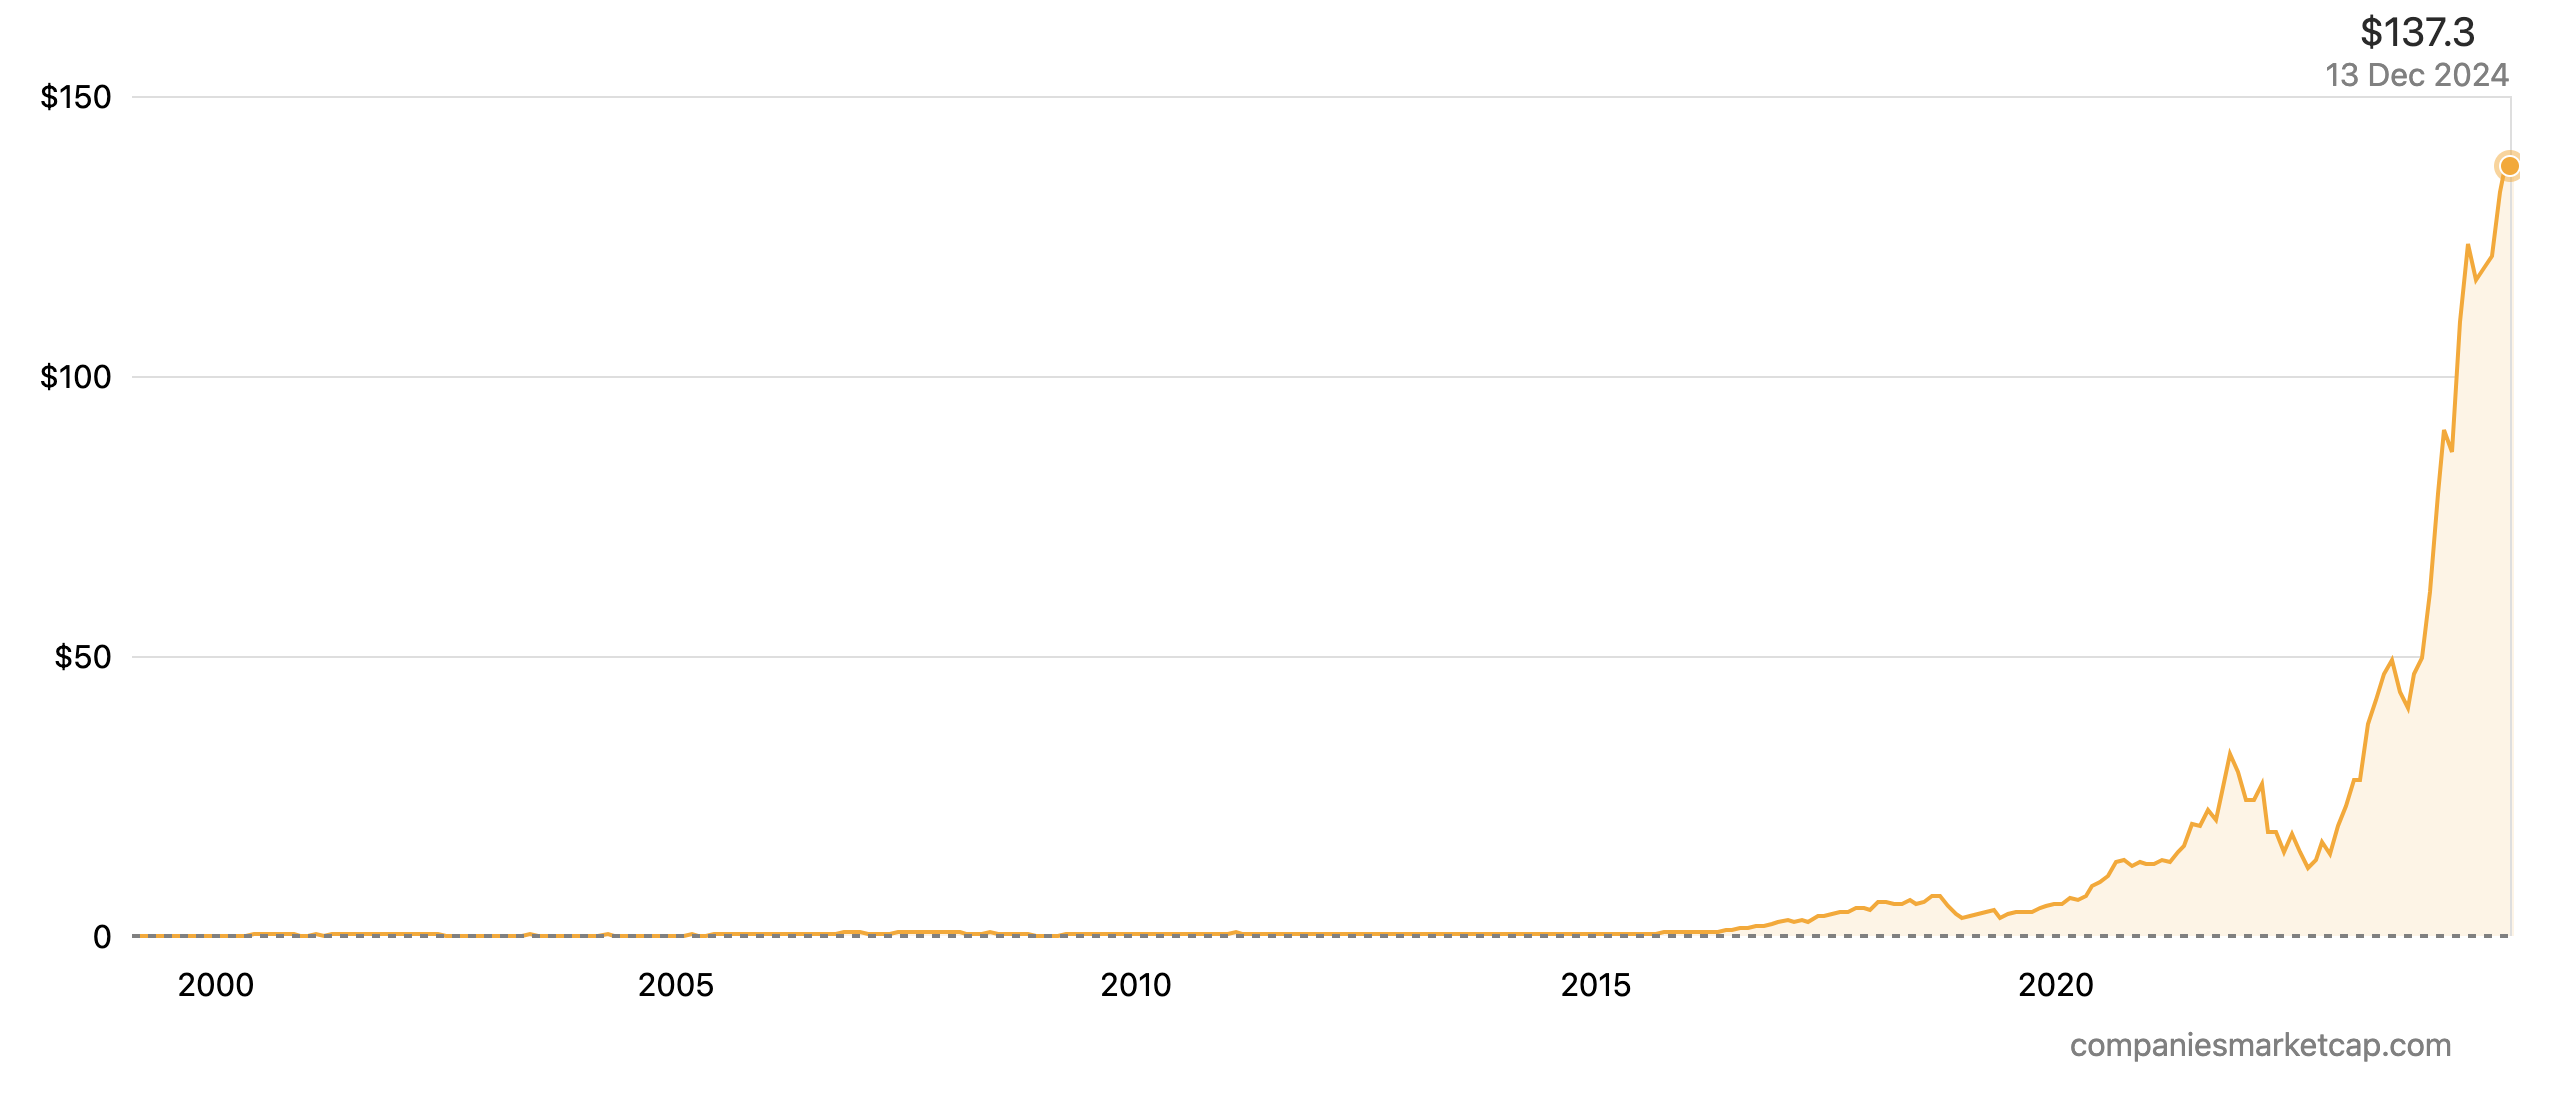
The picture below shows the market capitalization history of Nvidia from 1999 to 2024.
Market cap history of Nvidia from 1999 to 2024

Source: Companies Market Cap.
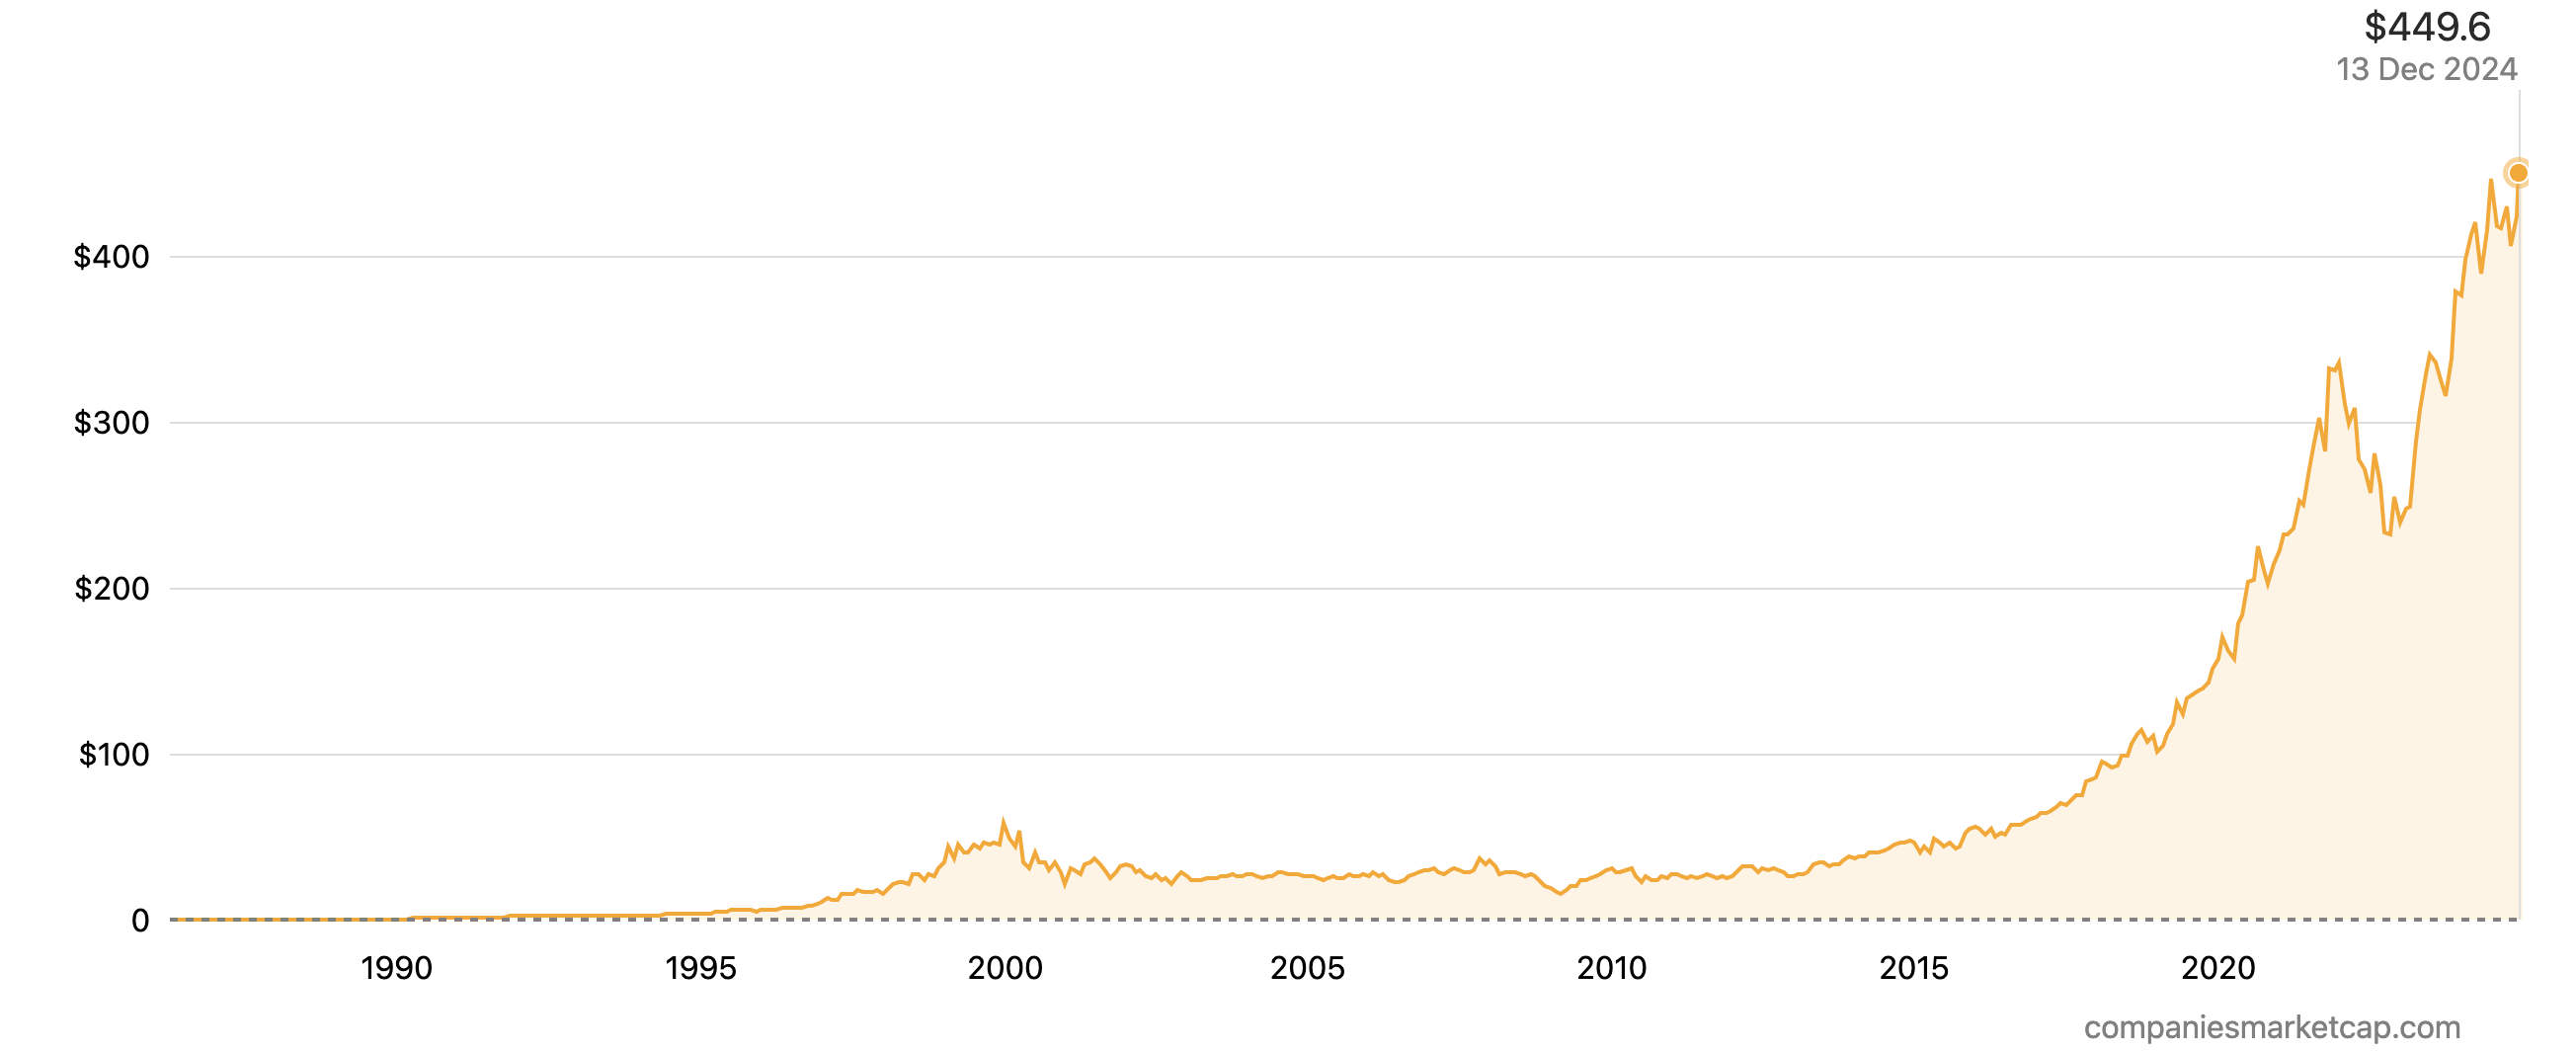
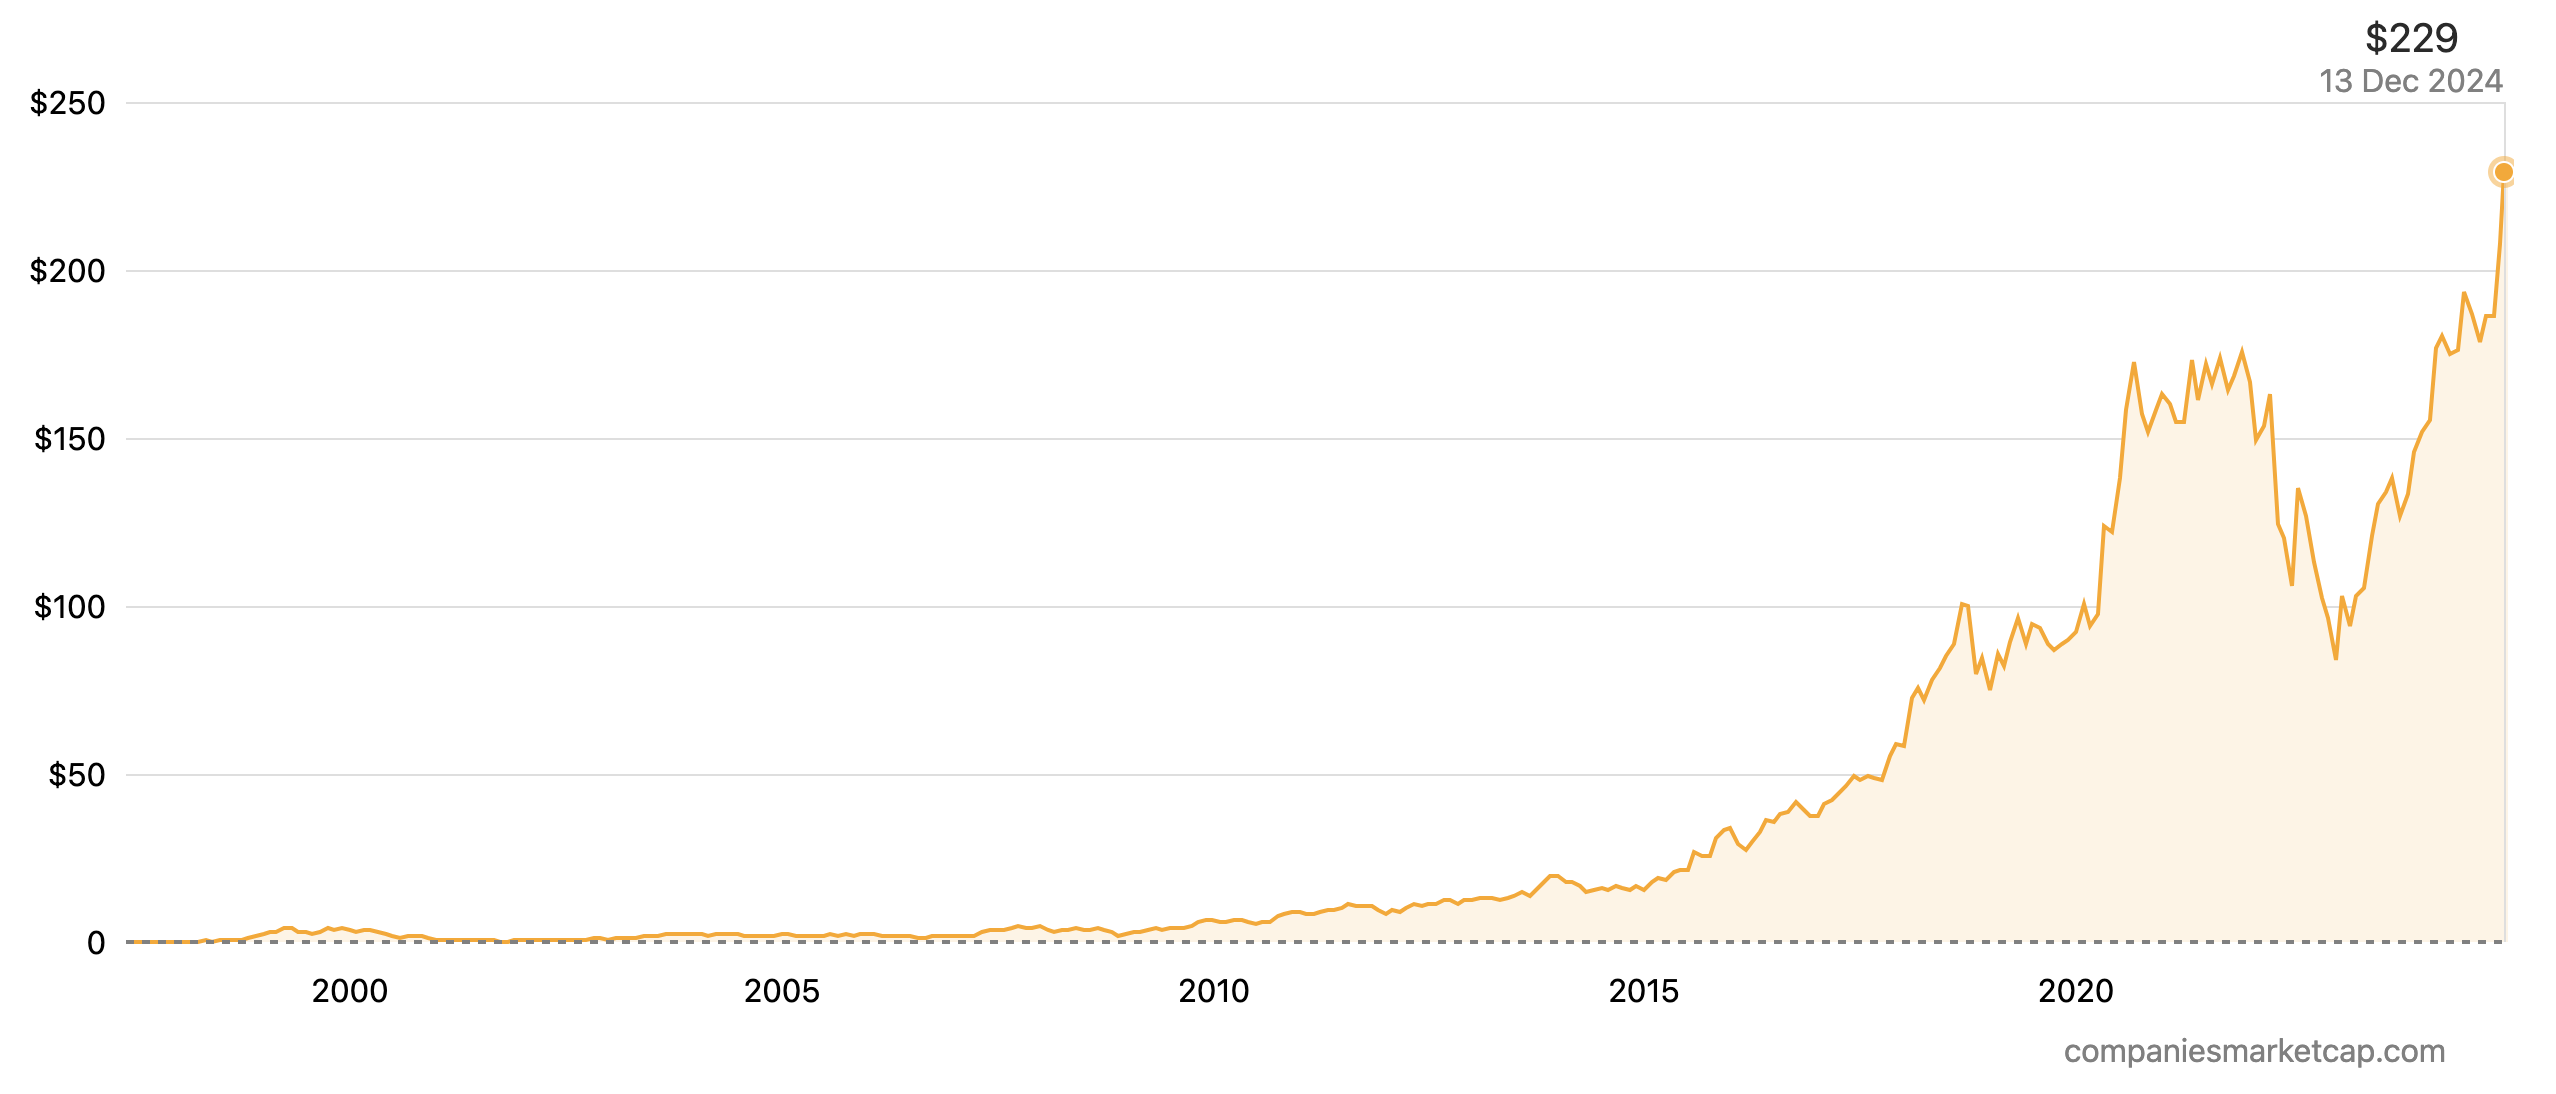
The picture below shows the Stock price history of Nvidia from 1999 to 2024.
Stock price history of Nvidia from 1999 to 2024
Source: Companies Market Cap.
Nvidia dominates the GPU market, controlling over 85% of the discrete GPU space globally. It boasts a gross margin of approximately 65%, one of the highest in the semiconductor industry. According to the Business 2 community, Nvidia’s revenue surged, particularly in its data center segment, which accounted for $15 billion in 2023. Its AI chipsets have become a cornerstone for AI development across industries, leading to increased investor confidence.
Nvidia is integral to AI, as its GPUs are critical for training large language models (LLMs) and generative AI tools. This has led to surging demand for its A100 and H100 chips. Nvidia announced collaborations with Tesla and other automakers for AI-driven autonomous driving technologies.
The company continues to expand its AI reach through strategic investments in startups and partnerships with cloud providers like Amazon Web Services (AWS). Its Omniverse platform is being adopted for digital twins, a technology with applications in industrial design and smart cities.
Microsoft
Established in 1975 by Bill Gates and Paul Allen, Microsoft Corporation has been at the forefront of software development. Its strategic investment in OpenAI and integration of generative AI into its Office suite and Azure cloud services have significantly bolstered its growth. Investors and students can learn from Microsoft’s ability to adapt its business model over decades, sustaining growth in both legacy and emerging markets. In fiscal 2024, its services division alone brought in over $70 billion, reflecting a 19.59% change in the market capitalization growth from the previous year.
Logo of Microsoft Corporation

Source: the company.
As of December 2024 Microsoft has a market cap of $3.342 Trillion USD. This makes Microsoft the world’s 3rd most valuable tech company by market cap according to “companies market cap” company data. The market capitalization, commonly called market cap, is the total market value of a publicly traded company’s outstanding shares and is widely used to measure how much a company is worth.
The picture below shows the market capitalization history of Microsoft from 1996 to 2024.
Market cap history of Microsoft from 1996 to 2024

Source: Companies Market Cap.
The picture below shows the stock price history of Microsoft from 1986 to 2024.
Stock price history of Microsoft from 1986 to 2024
Source: Companies Market Cap.
Microsoft has surpassed a $3 trillion market cap for the first time in January 2024. It has made a significant investment in quantum computing with the development of its Azure Quantum platform.
Microsoft’s Copilot AI has been integrated across its Office Suite, including Word, Excel, and PowerPoint, revolutionizing productivity software. Recent news in June 2024 states that it has strengthened its partnership with OpenAI to bring advanced AI tools to Azure, making enterprise AI more accessible globally.
Amazon
Amazon Inc, founded in 1994 by Jeff Bezos, revolutionized e-commerce before expanding into cloud computing and entertainment. Amazon Web Services (AWS) remains a dominant player in the cloud sector, while its AI capabilities support logistics, retail, and media content. In fiscal 2024, its services division alone brought in over $85 billion, reflecting a 54.2% change in the market capitalization growth from the previous year.
Logo of Amazon

Source: the company.
As of December 2024 Amazon has a market cap of $2.421 Trillion USD. This makes Amazon the world’s 4th most valuable tech company by market cap according to “companies market cap” company data.
The picture below shows the market capitalization history of Amazon from 1997 to 2024.
Market cap history of Amazon from 1997 to 2024

Source: Companies Market Cap.
The picture below shows the Stock price history of Amazon from 1997 to 2024.
Stock price history of Amazon from 1997 to 2024
Source: Companies Market Cap.
Amazon’s Bedrock AI service has enabled enterprises to deploy customized AI models, further enhancing its AWS offerings. According to CRN, AWS held a 31% market share in the third quarter of 2024 and generated $27.5 billion in total sales during this period.
And according to CRN, Microsoft’s Intelligent Cloud business generated $24.1 billion in sales during the third quarter of 2024, up 20 percent year over year. It has also ramped up investments in drone technology, with Prime Air expanding to multiple cities for rapid deliveries. Its expansion into healthcare, with telemedicine services and pharmacy offerings, demonstrates diversification into high-growth industries.
Amazon’s continued investment in AI, including generative AI tools for its AWS customers, has strengthened its competitive edge in cloud services. Its e-commerce business has also seen growth, particularly in emerging markets contributing significantly, with innovations in logistics and Prime memberships driving customer retention.
Alphabet (Google)
Alphabet was founded in 1998 as Google by Larry Page and Sergey Brin in Menlo Park, California (later restructured as Alphabet Inc. in 2015). Google’s dominance in search and online advertising is complemented by its ventures in AI, particularly through its DeepMind subsidiary. It leverages its dominance in digital advertising while investing heavily in AI, autonomous driving (Waymo), and cloud services. Some of the companies under Alphabet are Calico, GV, Capital G, Verily, Waymo, X and Google Fiber. In fiscal 2024, its services division alone brought in over $65 billion, reflecting a 36.57% change in the market capitalization growth from the previous year.
Logo of Alphabet

Source: the company.
As of December 2024 Alphabet (Google) has a market cap of $2.399 Trillion USD. This makes Alphabet (Google) the world’s 5th most valuable tech company by market cap according to “companies market cap” company data.
The picture below shows the market capitalization history of Alphabet from 2014 to 2024.
Market cap history of Alphabet from 2014 to 2024

Source: Companies Market Cap.
The picture below shows the stock price history of Alphabet from 2004 to 2024.
Stock price history of Alphabet from 2004 to 2024
Source: Companies Market Cap.
Nearly eight years into their journey as an AI-first company, Alphabet launched Gemini AI, a generative AI model to compete with OpenAI’s GPT, integrated into Google Workspace and search functions. Alphabet’s significant developments in Waymo, an autonomous vehicle subsidiary has an expansion of robotaxi services in major U.S. cities.
Recently Alphabet announced an ambitious plan to power all operations with 100% renewable energy by 2030. Its advertising revenues saw a resurgence in 2024 after a decline due to privacy changes in prior years.
Conclusion
The dominance of the top five technology firms Apple, Microsoft, Nvidia, Amazon, and Alphabet, is a testament to their ability to innovate, adapt, and lead in a rapidly evolving market landscape. Their influence extends beyond their respective industries, shaping global economic trends, investment strategies, and technological advancements. Their products and services help other companies to improve their productivity. Their market cap rankings serve as a barometer for the health of the tech sector and the global economy, making them essential for any professional seeking to navigate today’s financial landscape effectively.
Why should I be interested in this post?
For finance professionals, the performance and strategic moves of these tech giants offer valuable lessons in market resilience, innovation-driven growth, and capital allocation. Understanding the trajectories and current strategies of these firms helps in identifying investment opportunities and evaluating risks in the tech sector.
Related posts on the SimTrade blog
▶ Nithisha CHALLATop 5 companies by market capitalization in the US
▶ Nithisha CHALLA Market Capitalization
▶ Nithisha CHALLAThe NASDAQ index
Useful resources
Companies market cap Largest tech companies by market cap
Invest News Network (INN) Technology Stocks: 10 Biggest Companies in 2024
Business 2 Community Top 10 Tech Companies in the World by Market Capitalization in 2024
Computer Reseller News (CRN) Cloud Market Share For $84B Q3 2024: AWS, Microsoft, Google Cloud Lead
Visual Capitalist Ranked: The 50 Most Valuable Companies in the World in 2024
About the author
The article was written in December 2024 by Nithisha CHALLA (ESSEC Business School, Grande Ecole Program – Master in Management (MiM), 2021-2024).