The Magnificent Seven

In this article, Isaac ALLIALI (ESSEC Business School, Global Bachelor in Business Administration (GBBA), 2019-2023) presents the “magnificent seven”, the Nasdaq’s top seven performing companies and most important market capitalization.
The SEVEN
“These Seven Tech Stocks Are Driving the Market” is the headline of a New York Times issue on the 22nd of January 2024. The article spotlights the lasting growth of the “Magnificent Seven”, an expression coined by Bank of America analyst Michael Hartnett in 2023, directly referring to a group of very well-performing American companies such as Tesla, Nvidia, Apple, Microsoft, Alphabet, Meta and Amazon. These companies have seen exponential growth since economists first witnessed their joint boom last year, and as of January 19th 2024, the magnificent seven represent 29% of the S&P 500’s market value. The objective of this post is to introduce these companies, diving into their organization and structure as well as comparing their performances to conjecture on what the future may hold.
Market Value of S&P 500 companies.
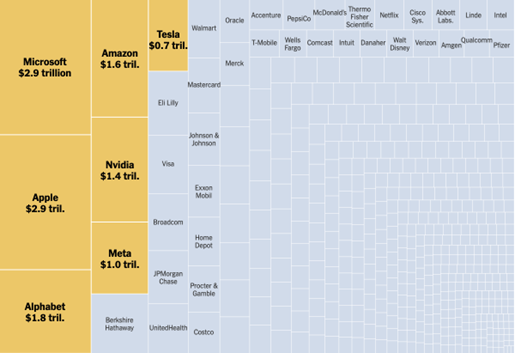
Source: The New York Times
Origin of the expression
The expression “The Seven Magnificent” in financial markets is inspired by the classic Western film The Magnificent Seven (1960), itself a remake of Akira Kurosawa’s Seven Samurai (1954). In the original Japanese film, a village under threat from bandits hires seven samurai to protect them, symbolizing strength, strategy, and resilience in the face of adversity. This cinematic legacy has been adapted to financial markets to refer to a group of dominant stocks—typically the largest and most influential technology companies—that drive market performance. These firms, often characterized by their innovation, market capitalization, and economic influence, act as the “protectors” of market indices, much like the samurai or gunfighters in their respective films. The term reflects both admiration for their strength and an acknowledgment of their outsized impact on global finance.
The Nasdaq’s top 7 performing Companies
The “Magnificent Seven” have captivated investors with their meteoric rise, consistently eclipsing the broader market. But to decipher their future trajectory, we must delve deeper into their individual narratives:
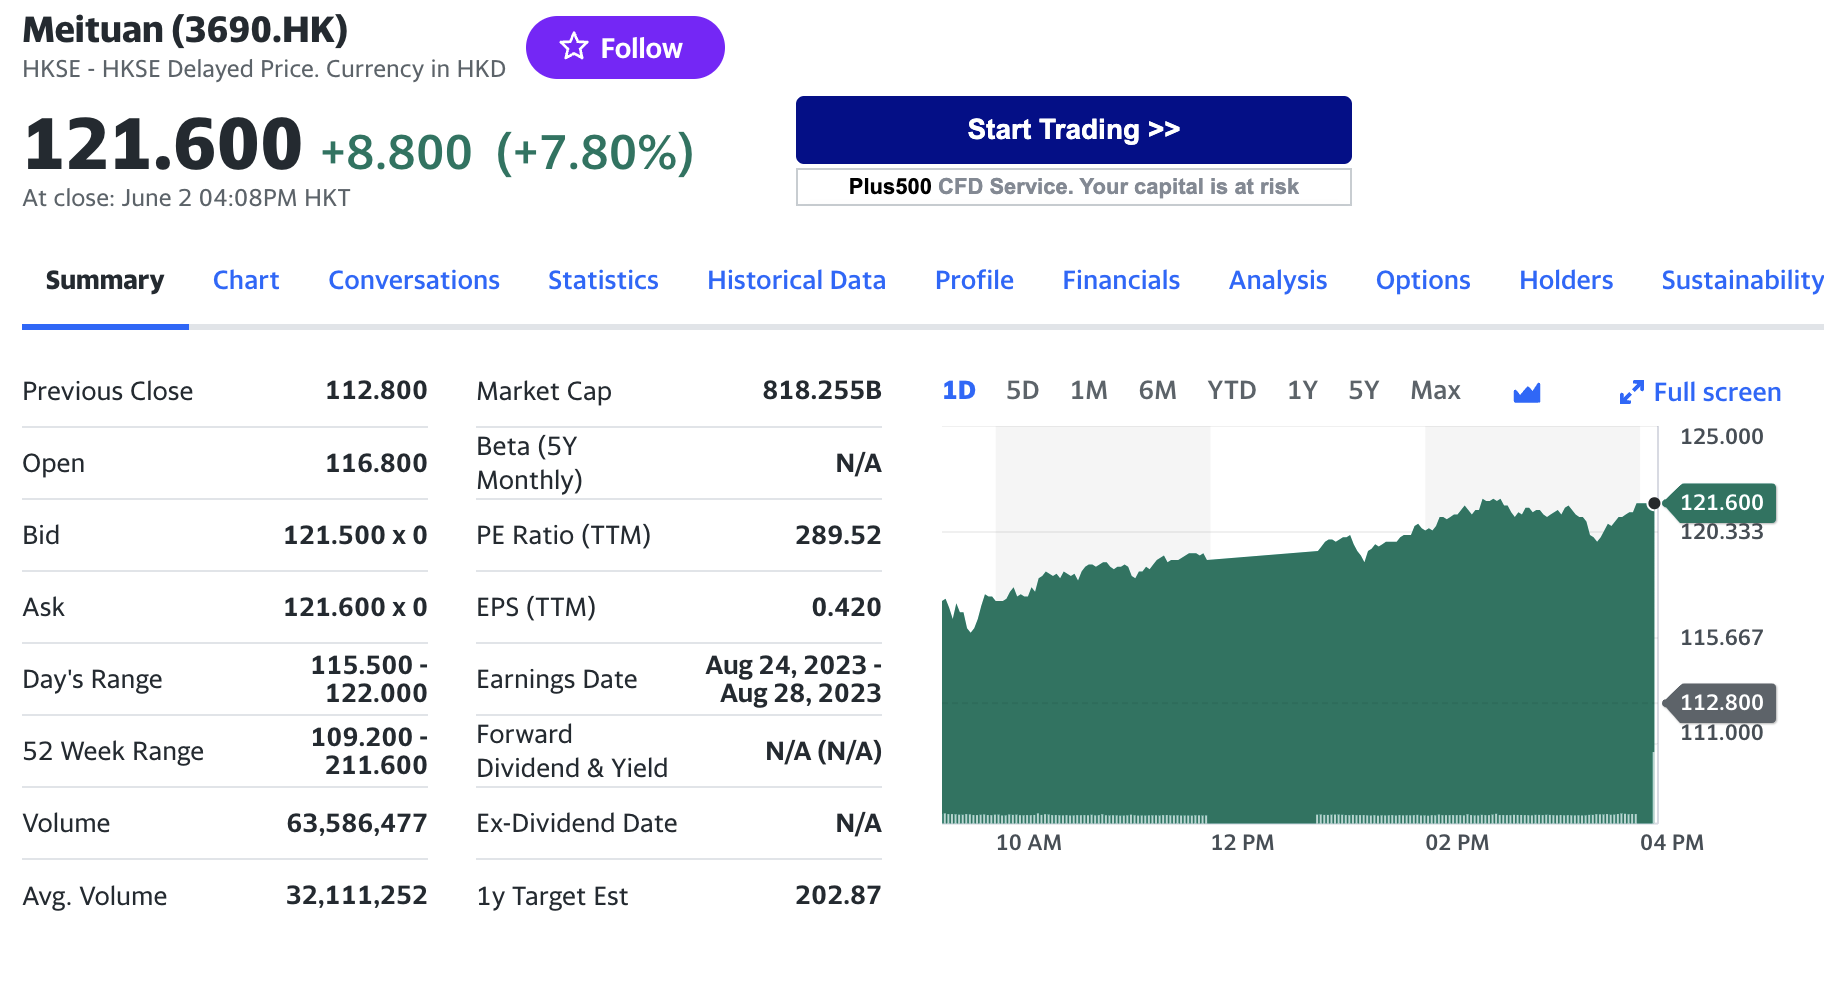
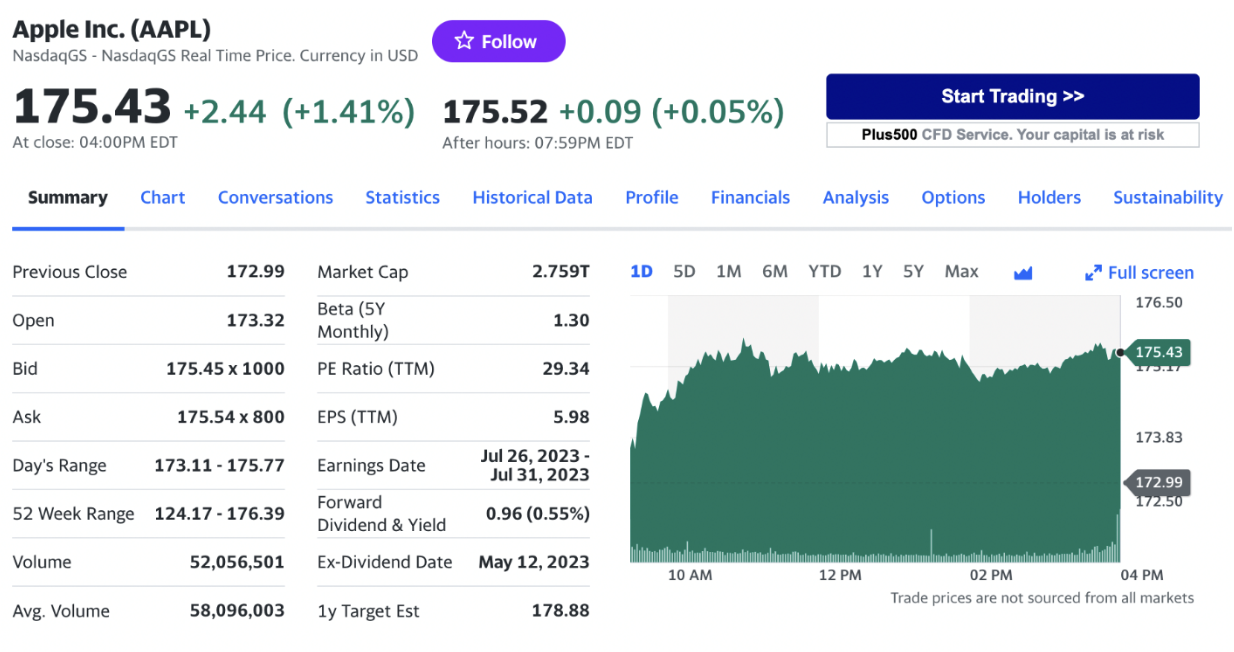
Apple
This Cupertino-based company has mastered the art of premium hardware integration. Its sleek iPhones, Macs and wearables seamlessly interact with its robust software ecosystem (iOS, macOS), fostering a loyal customer base and enviable profit margins. Q4 2023 witnessed remarkable financial performance, with strong revenue and profit growth solidifying its leadership position. However, intensifying competition from Android players and regulatory scrutiny regarding App Store practices and data privacy threaten its dominance. While its valuation remains high, Apple’s brand strength, innovation pipeline, and loyal customer base suggest continued prosperity, provided it navigates these challenges deftly.
Logo of Apple Inc.
Source: the company.
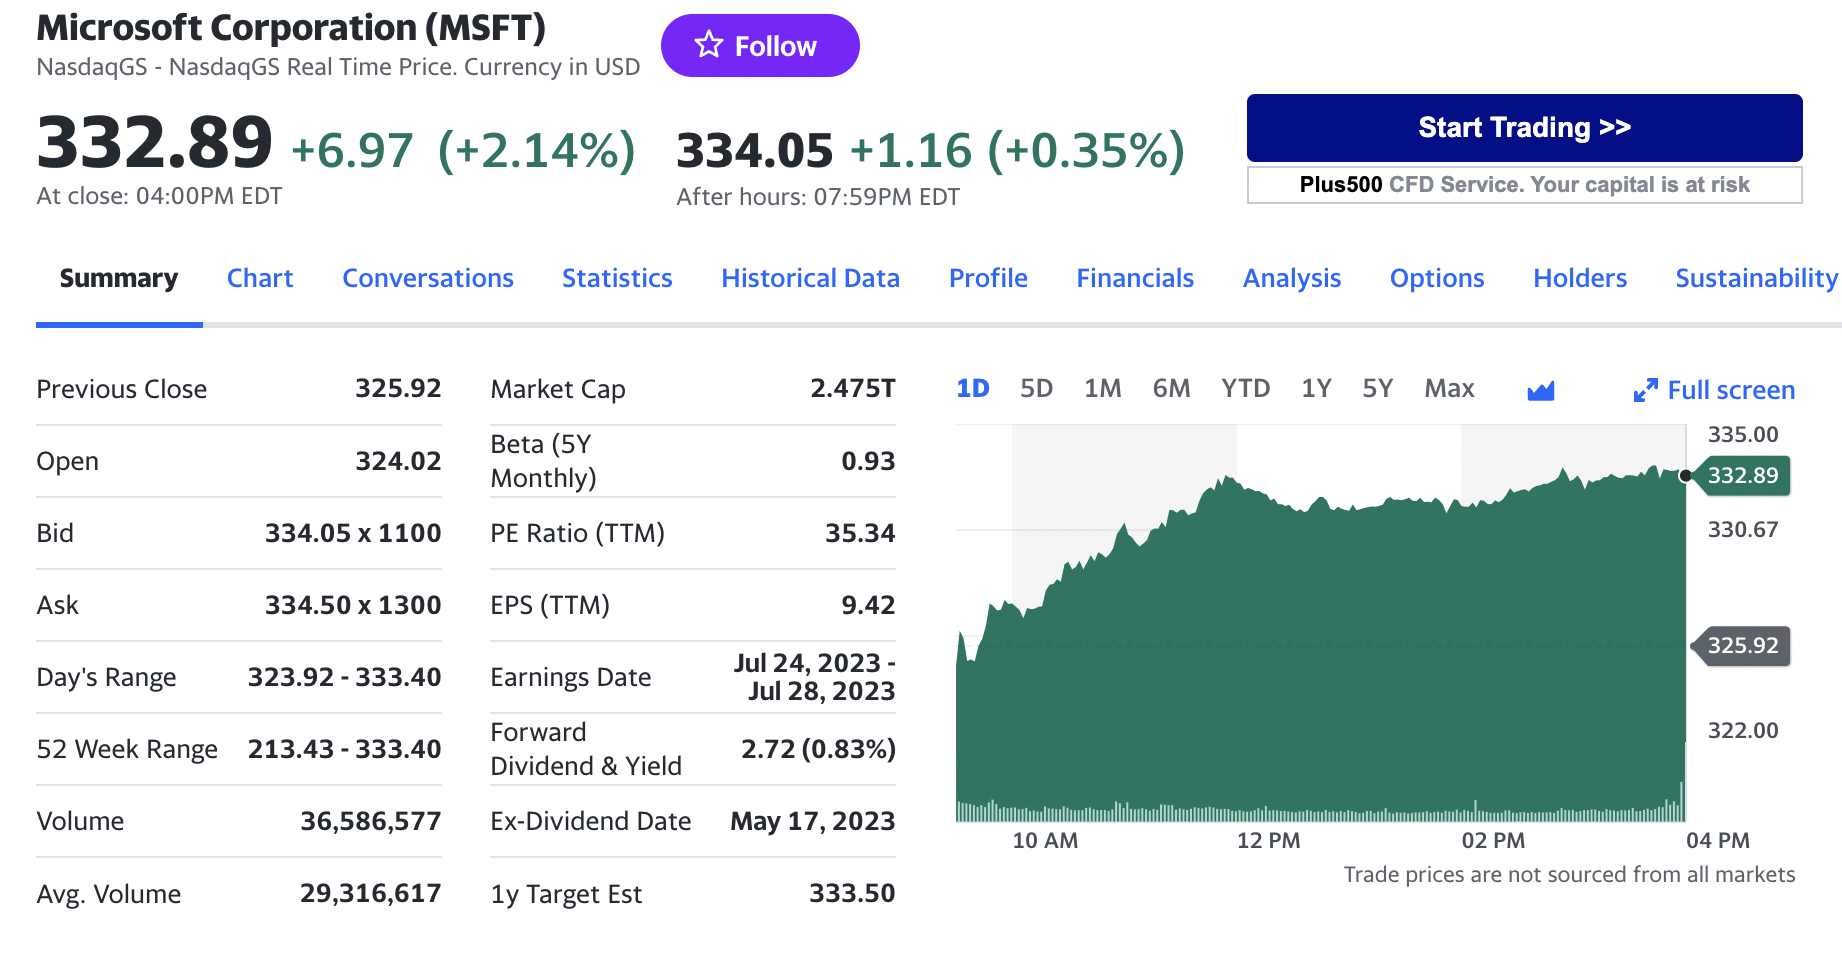
Microsoft
This software giant has transformed itself from a desktop pioneer into a cloud computing powerhouse. Its Azure platform has become a formidable competitor against Amazon Web Services, while its productivity suite (Office 365) remains a staple for businesses. Q3 2023 further emphasized its strong momentum with robust financial performance. While Google Cloud Platform and Amazon Web Services pose significant competition, Microsoft’s established enterprise partnerships and focus on digital transformation grant it a strategic advantage. Its valuation, though high, reflects its consistent growth trajectory and potential for further expansion in the cloud and enterprise spheres. However, regulatory scrutiny regarding anti-competitive practices remains a key risk factor.
Logo of Microsoft Corporation

Source: the company.
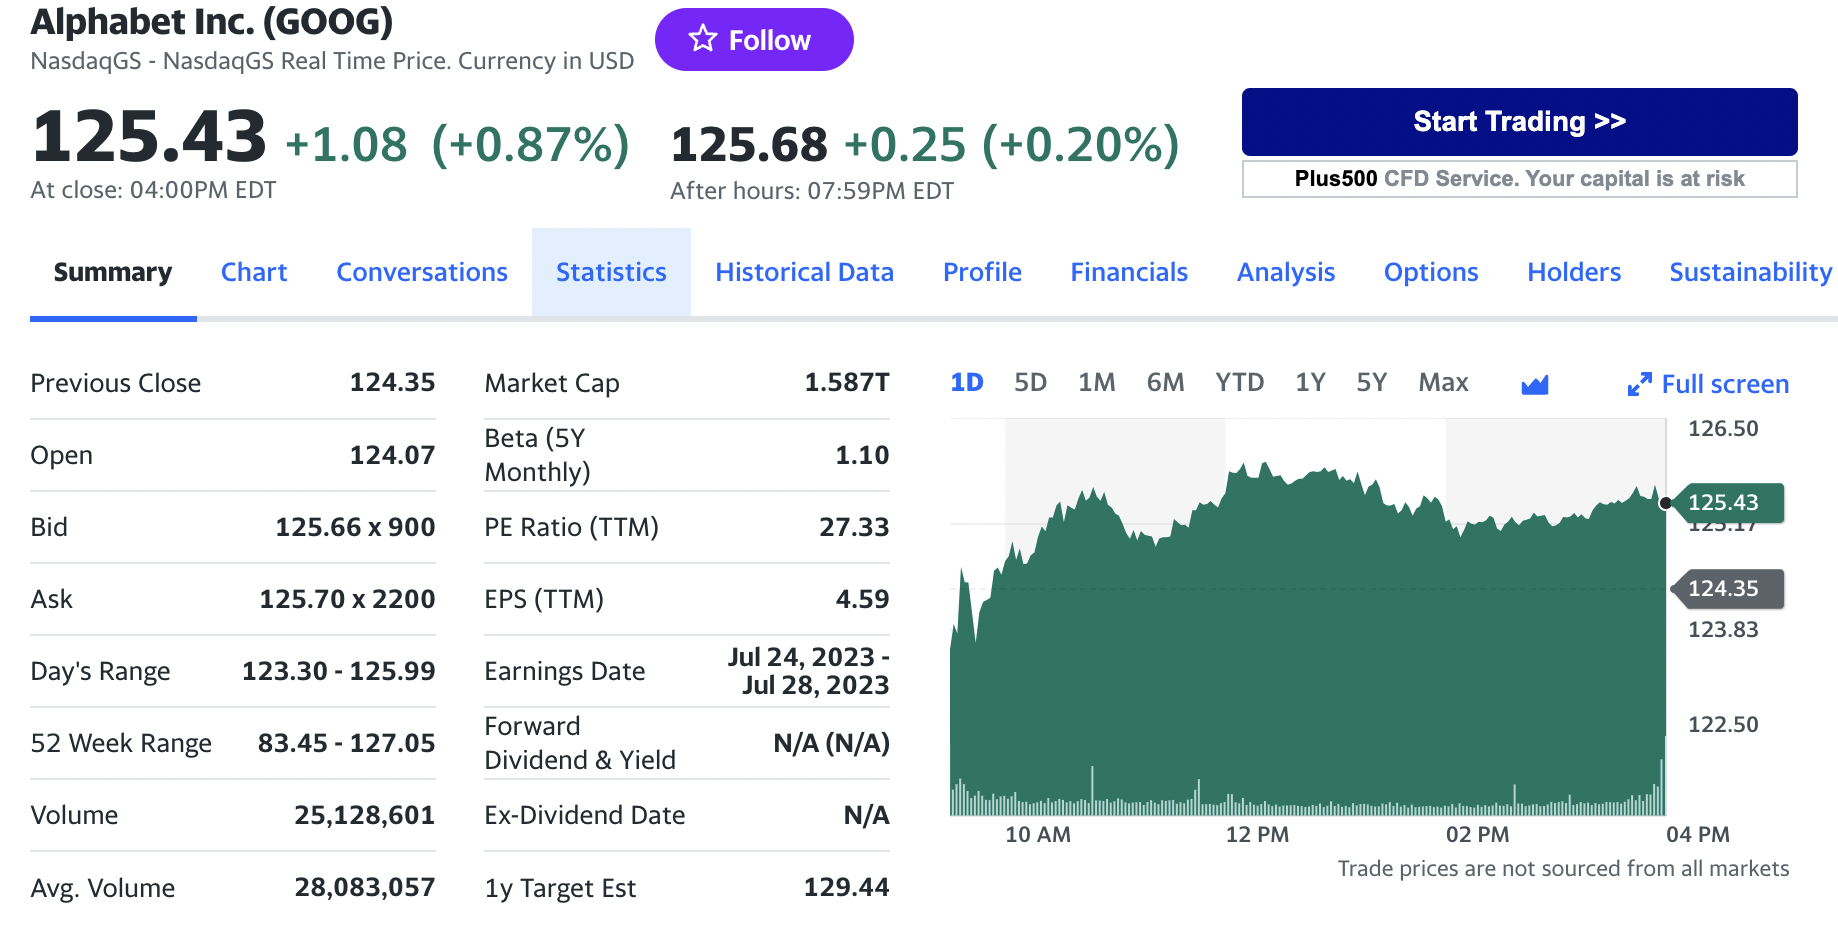
Alphabet (Google)
The ubiquitous search engine and advertising giant monetizes vast user data through its search engine, YouTube platform, and Android operating system. Q3 2023 showcased impressive profits, fueled by continued dominance in online advertising. However, its data collection practices, and potential antitrust concerns create a cloud of uncertainty. While competition from Apple and Amazon in advertising and e-commerce intensifies, Google’s advancements in artificial intelligence and its foray into cloud computing offer promising prospects for the company’s future growth and innovation. Its valuation reflects its growth potential, but regulatory headwinds demand careful consideration before investing.
Logo of Alphabet

Source: the company.
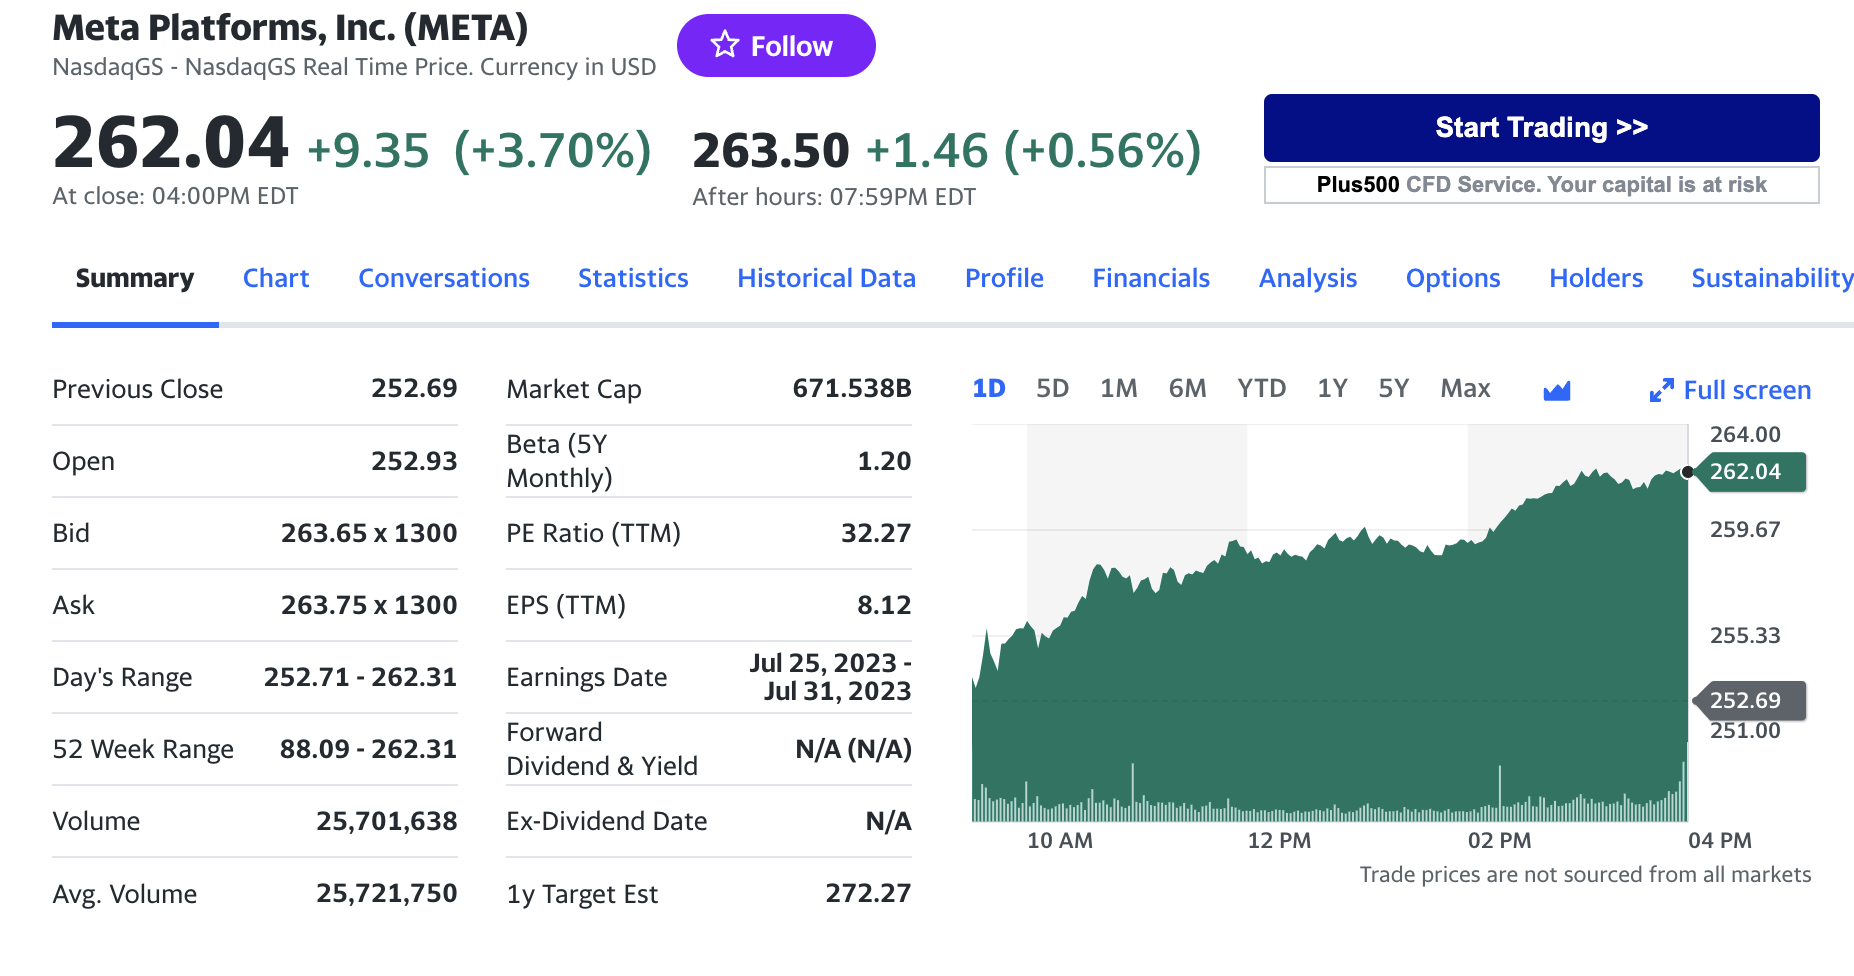
Meta (Facebook)
This social media titan connects billions of users through its Facebook, Instagram, and WhatsApp platforms. Recent financial performance showcases modest growth, with investments in the metaverse impacting its bottom line. While the potential of the metaverse remains captivating, its success is far from guaranteed. Additionally, competition from TikTok and regulatory pressure regarding data privacy and anti-competitive practices pose significant challenges. Indeed, the Senate Judiciary Committee held a hearing this past Wednesday 31st of January 2024, where, after being pressured by Senator Josh Hawley, Republican of Missouri, Mark Zuckerberg, the CEO of Meta, apologized for the harm caused by his group. Mr. Zuckerberg stood from his chair, turned around and addressed families of victims in the audience who had suffered abuse on Meta’s apps. Meta’s high valuation reflects the risk-reward equation associated with its ambitious metaverse gamble. Investors should carefully weigh the potential rewards against the inherent uncertainties before making any investment decisions.
Logo of Meta

Source: the company.
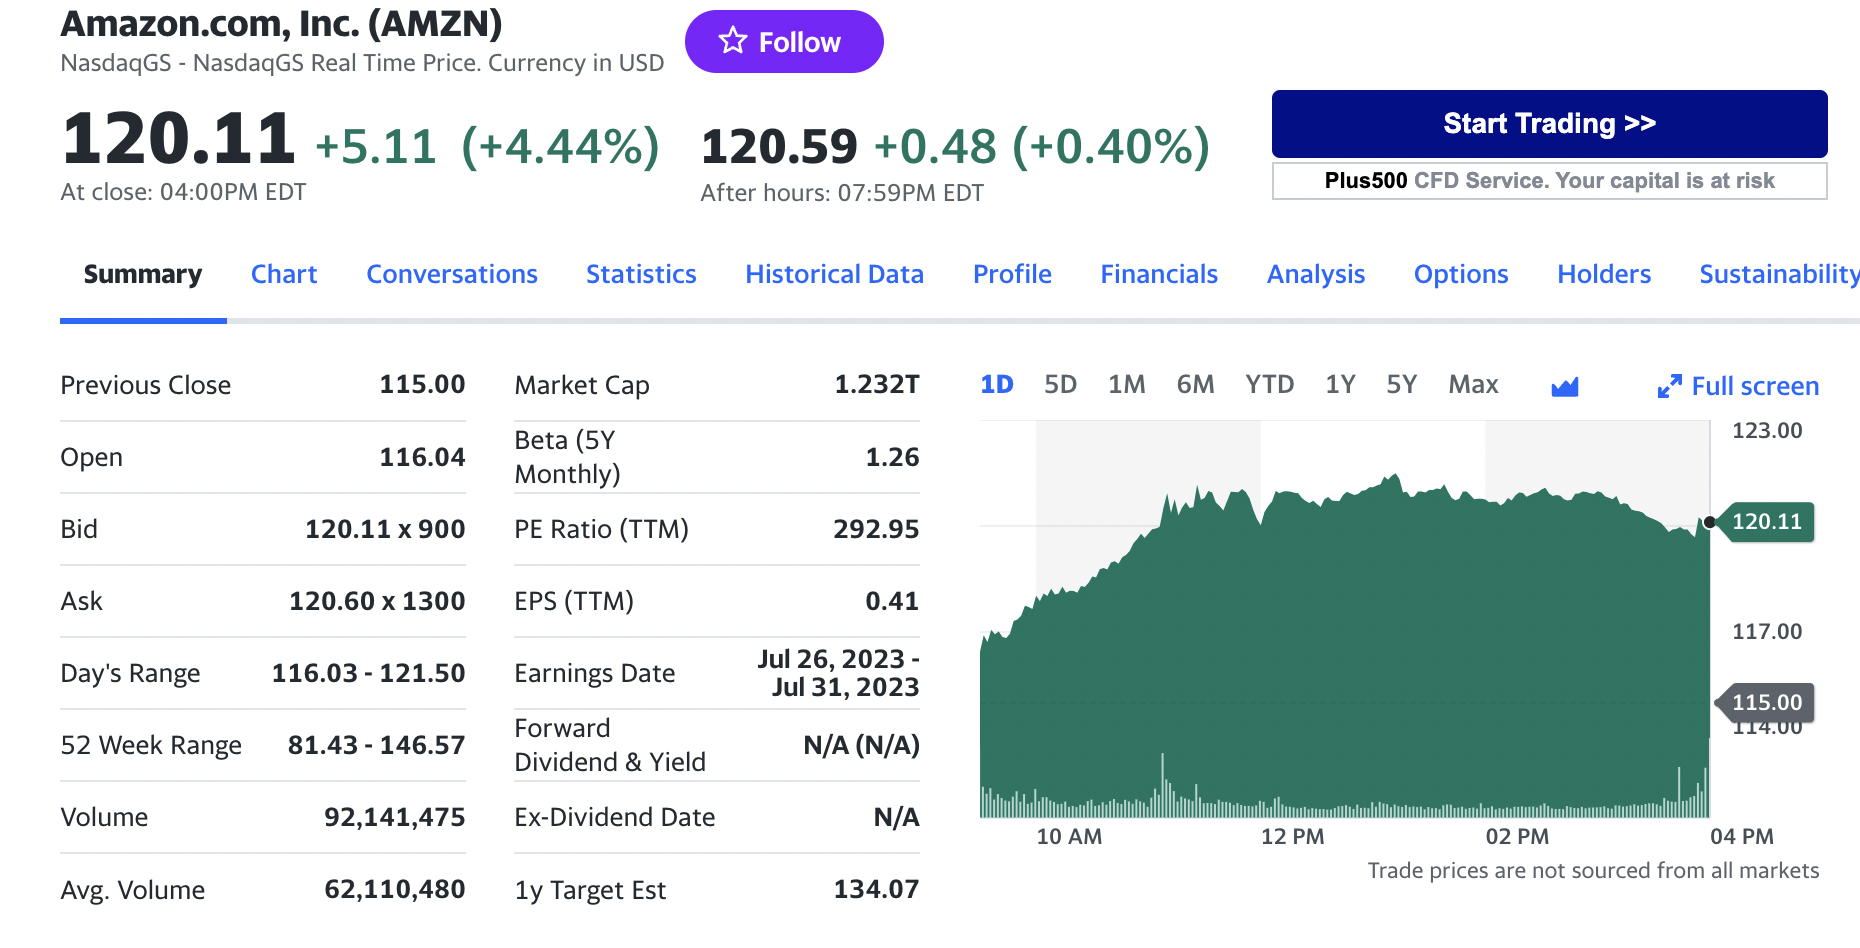
Amazon
The undisputed king of e-commerce, Amazon, has expanded its empire to encompass cloud computing (AWS), logistics, and even healthcare. Q3 2023 demonstrated continued strong growth despite economic headwinds, highlighting its diversified revenue streams. However, competition from Walmart in e-commerce and antitrust scrutiny regarding its market dominance are critical factors to consider. Amazon’s focus on logistics innovation and potential expansion into the healthcare sector offers exciting future avenues. Its high valuation reflects its leadership position in its core segments, but investors should be wary of potential macroeconomic challenges and regulatory interventions.
Logo of Amazon

Source: the company.
Nvidia
This chipmaker has carved a niche in graphics processing units (GPUs) powering the gaming, AI, and data center industries. Q3 2023 saw explosive growth, fueled by surging chip demand and the adoption of AI in various sectors. However, competition from AMD and Intel in the semiconductor space is fierce. While Nvidia’s technological edge in AI-specific GPUs provides a temporary advantage, the cyclical nature of the semiconductor industry necessitates caution. Its high valuation reflects its growth potential, but investors should be mindful of potential downturns in the chip market. While Nvidia now holds a market share of approximately 83%, compared to AMD’s (17%), it faces strong competition.
First, there is Apple (AAPL), which has quickly developed its own laptop CPUs with graphics capabilities that it claims can compete with Nvidia’s top products. Intel (INTC) is also preparing to unveil its own line of graphics chips, which could pose a significant challenge to Nvidia. Moreover, US restrictions on Nvidia’s sales of advanced AI chips in China create a strategic opportunity for competitors such as Huawei, potentially leading to Nvidia losing market share in this important region. Huawei’s entry into the AI chip market with its Ascend AI chip series, particularly the 910B, directly competes with Nvidia’s A100 processor, and the company recently received a big order from Baidu, a major leader in Chinese technology.
Logo of Nvidia

Source: the company.
Tesla
This electric vehicle (EV) pioneer has disrupted the auto industry with its innovative EVs and clean energy solutions. Q3 2023 delivered impressive revenue and profit growth, showcasing the increasing public adoption of EVs. However, Tesla has seen its US market dominance shrink from 62% to just over 50% of the market in 2023. The company faces intensifying competition from traditional automakers and new EV startups like Rivian and Lucid as well as competitors from China like BYD who became the dominant automaker in China in 2021. And over the next few years, the growing global heft of Chinese manufacturers looks hard to beat. Chinese EV players such as BYD, Nio, Wuling, and Xpeng produced almost 60% of the world’s EVs in 2022 – and they have been doing so in a very affordable manner. In the first half of 2023, the average cost of an EV in China was US$33,000 (£26,040), more than half the US$70,700 (£55,800) people pay for EVs in Europe and the US$72,000 paid in the US. Additionally, challenges in scaling production and maintaining quality control raise concerns. Tesla’s high valuation reflects its future growth expectations, but potential macroeconomic headwinds and uncertainties surrounding battery technology advancements introduce significant risks.
Logo of Tesla
Source: the company.
Performance Comparison with indices and Competitive advantages of the “Magnificent Seven”
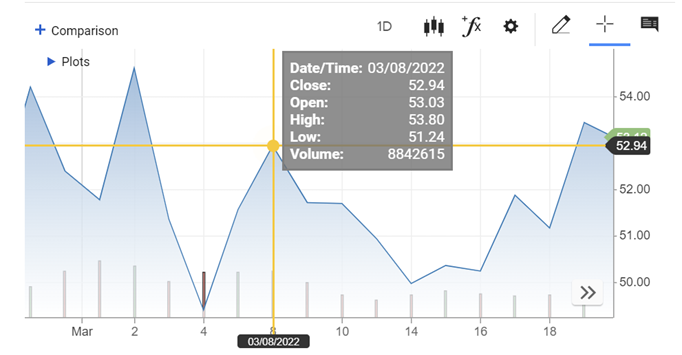
Magnificent Seven Performance Comparison.
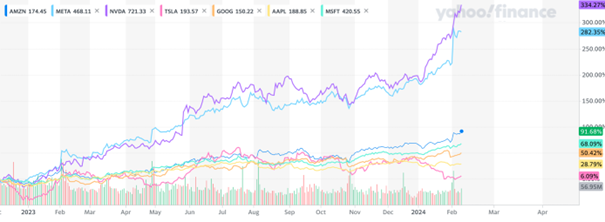
Source: Yahoo Finance
The “Magnificent Seven” companies are leaders in dynamic industries like cloud computing (Microsoft), e-commerce (Amazon), and AI (Meta), driving revenue and stock price growth. Being a leader in a dynamic industry offers several key benefits, as exemplified by these tech giants. At their core, these companies boast robust financials: high-profit margins, consistent cash flow, and efficient operations which translate to investor confidence. Indeed, according to the Capital Group, the Bloomberg “Magnificent 7” Total Return Index advanced 107% in 2023 versus the overall S&P 500 Index at 24%.
There are numerous other factors driving their financial outperformance. Apple, for example, revolutionized smartphones with the iPhone, granting them a loyal user base and brand identity. Similarly, Tesla’s dominance in electric vehicles gives them valuable data and expertise, making it harder for competitors to catch up. Dynamic industries are characterized by rapid expansion and constant innovation. Leaders are poised to capture a larger share of this growth, like Microsoft’s cloud computing dominance or Alphabet’s early investment in AI research. They can also diversify into related fields, as Meta is attempting with the metaverse. Moreover, top talent seeks employers at the forefront of their field. Being a leader attracts skilled employees, fostering a culture of innovation and further solidifying the company’s position. Nvidia’s reputation for cutting-edge graphics processing units attracts top engineers, fueling their continued success.
Investors often reward market leaders with higher valuations due to their perceived stability and future growth potential. This allows companies like Apple to raise capital for further expansion and acquisitions, creating a virtuous cycle. Additionally, the current market environment plays a part. Amidst volatility, investors seek stability and potential upside, making these large, established companies with proven track records attractive safe-havens. The fact that tech stocks are generally less sensitive to rising interest rates compared to other sectors further fuels their appeal in a tightening monetary environment.
As stated above, the “Magnificent Seven” have strong fundamentals, and their financial strength, profitability, as well as growth potential underpin their success. Each of the seven stocks has easily outperformed the S&P 500’s 163% return over the last ten years, and their involvement in high-growth technologies such as high-end software and hardware, cloud computing, and artificial intelligence positions them well to continue leading their respective markets in the future.
Among the “Magnificent Seven” companies, observe strong profitability: The “Seven” boast a significantly higher average net margin (25%) compared to the S&P 500 (12%). (Source: BlackRock) This translates to substantial cash flow generation, crucial for reinvestment and future growth. For example, Tesla’s Q3 2023 net margin surpassed 17%, fueling its rapid expansion. We must also acknowledge that their average annual revenue growth (22%) outpaces the S&P 500 (10%). (Source: Motley Fool) This translates to faster stock price appreciation. Nvidia’s 80% year-to-date stock surge, driven by booming chip demand for AI applications, exemplifies this.
Additionally, we recognize in the “Seven” some form of “Market Magic”; during the last market correction (January 2023), their average decline (10%) was smaller than the S&P 500’s (15%). (Source: Qontigo) This “safety premium” attracts risk-averse investors, thus boosting their performance. Moreover, their lower average Beta (0.85) indicates that they are 15% less volatile than the rest of the market. (Source: Qontigo) This makes them more appealing in fluctuating interest rate environments. Finally, the individualities shine brighter than the rest because of the sectors they are invested in, like Nvidia benefitting from the chip surge or Meta’s ambitious metaverse projects that attract investor interest, potentially impacting future performance.
Yet, investing in them still carries risks, as these factors have already been priced in. There are also the usual risks of market volatility, regulatory changes, technological disruptions, and global economic conditions that can influence their performance. Also, previous performance does not guarantee future returns, and some of the “Magnificent Seven” stocks are overvalued based on certain basic criteria like forecast earnings multiples and price-to-sales ratios.
Stock market performance of the Magnificent Seven in 2023
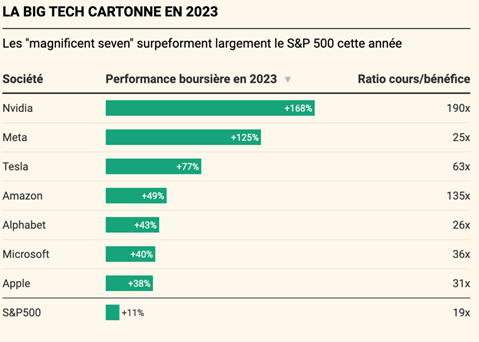
Source: Bloomberg
What are the risks ahead of the “Magnificent Seven” progression?
Because of their size and reach, these companies all face regulatory risks. Regulation changes, especially in data privacy, antitrust laws, and international trade, can significantly influence their operations. Furthermore, most tech companies have faced attention for antitrust, data privacy, and tax issues. Many of them have been investigated for monopolistic tactics, and if they want to enhance their already large market shares, they will face even more scrutiny.
More broadly, widespread economic changes affect them due to their broad reach, including interest rates, inflation, economic growth, consumer confidence, and investor sentiment. Moreover, global enterprises are vulnerable to currency swings, which can impact earnings and stock values. Companies operating internationally face geopolitical risks such as trade wars, tariffs, and shifting international relations, which can impact supply chains and market access.
The Magnificent Seven are also vulnerable to cyberattacks due to their technology-based nature, a large breach could result in huge financial losses and reputational damage. Moreover, companies facing market saturation and rivalry may struggle to discover new markets and maintain growth rates. Indeed, increased competition between established firms and new startups may potentially endanger their market share. In short, by dominating their marketplaces, they become targets for any competitors wanting to build a name for themselves in their respective sectors. Companies must innovate to keep up with rapid technological progress as failure to adapt to new technology or trends may result in a loss of market relevance. Additionally, the resignation or loss of a founder or CEO may negatively impact investor sentiment and the company’s future.
Therefore, while these stocks present exciting possibilities, they also require a nuanced understanding of the technology sector’s options and a strategic investment approach.
Conclusion
The Magnificent Seven stocks represent a cohort of high-performing companies that have garnered significant attention in the investment world for their market dominance, technological advances, and growth potential. These stocks, which include Microsoft, Tesla, and NVIDIA, along with some FAANG members, are known for their influence across various sectors, such as software, hardware, electric vehicles, and artificial intelligence. They have been pivotal in driving technological trends and shaping consumer behavior, making them attractive to investors seeking growth and market leadership. However, investors need to know the risks and challenges associated with these stocks. The dynamic nature of the technology sector, regulatory scrutiny, market saturation, and global economic factors like inflation and geopolitical tensions can affect their performance. Additionally, high market valuations bring lofty expectations, and any failure to meet these can lead to significant stock price corrections.
Thus, while the Magnificent Seven offer potential for substantial growth, they also require careful analysis and a balanced approach considering their strengths and the various external factors that could influence their future trajectory.
Related posts on the SimTrade blog
▶ Anant JAIN The World 10 Most Sustainable Companies in 2021
▶ Nithisha CHALLA Top 5 companies by market capitalization in the US
▶ Youssef LOURAOUI Alpha
Useful resources
Movies
Akira Kurosawa (1954) Seven Samurai.
John Sturges (1960) The Magnificent Seven.
Press articles
Le Monde (26/05/2023) Nvidia entre dans le club très sélect des champions du monde de la cote
BlackRock (01/09/2023) Factors & the Magnificent Seven
Bloomberg (06/07/2023) Tesla and Chinese Rivals Signal Truce in Brutal EV Price War
Capital Group (09/01/2024) Magnificent Seven: What do you need to believe?
The New York Times Six takeaways from a contentious online child safety hearing
The New York Times (22/01/2024) The New York Times
Qontigo (03/10/2023) Ten charts that show how the ‘Magnificent Seven’ have held sway in the US market
Wall Street Journal (12/02/2024) Think the S&P 500 Looks Pricey? Check Out the Magnificent Seven
Motley Fool Nasdaq
Seeking Alpha (22/11/2023) Nvidia: Competition On The Horizon
About the author
The article was written in February 2024 by Isaac ALLIALI (ESSEC Business School, Global Bachelor in Business Administration (GBBA), 2019-2023).