Valuing Aerospace & Defence: multiples—read through the backlog and the contract

 Emanuele BAROLI

In this article, Emanuele BAROLI (ESSEC Business School, Master in Finance (MiF), 2025–2027) explains how to value Aerospace & Defence (A&D) companies by combining the right multiples with a clear view of backlog quality and contract risk. The aim is a practical lens you can apply to comps (comparables), models, and deal work.

What “Aerospace & Defence” is (and how public companies are usually organized)

A&D is the cluster of businesses that design, certify, manufacture and support aircraft and spacecraft, military platforms and mission systems, plus the electronics, software and services that make them work in the field. Public companies tend to report along economically distinct pillars—platforms, defence electronics/sensors, space, and services—with some firms also disclosing a cyber arm. This segmentation matters because revenue recognition (delivery vs over-time), margin stability and cash conversion differ meaningfully across these buckets.

Two concrete blueprints help set the map. Boeing organizes reporting into Commercial Airplanes (BCA), Defense, Space & Security (BDS) and Global Services (BGS). Its notes clarify that most BCA revenue is recognized at the point of aircraft delivery, whereas a substantial portion of BDS and some BGS contracts are long-term and recognized over time.

Leonardo discloses six sectors—Helicopters, Defence Electronics & Security, Cyber & Security Solutions, Aircraft, Aerostructures and Space—and reports orders, backlog, revenues and EBITA by sector, a structure that lends itself naturally to “sum-of-the-parts (SOTP)” and mix analysis.

The multiples: why EV/EBIT is the workhorse in A&D

In A&D, EV/EBIT typically describes the economics better than EV/EBITDA (Enterprise Value / Earnings Before Interest, Taxes, Depreciation and Amortization). The reason is accounting, not fashion. Under IFRS (International Financial Reporting Standards), development costs that meet recognition criteria are often capitalized and then amortized, (qualifying development expenditure is recognised as an intangible asset and is therefore amortised rather than depreciated: depreciation is reserved for tangible property, plant and equipment, whereas amortisation is the systematic allocation of the cost of intangibles (such as capitalised development) over their useful lives). While under US GAAP (United States Generally Accepted Accounting Principles), development is more frequently expensed. Amortization is an economic cost of prior engineering and industrialization. EBITDA ignores it; EBIT does not. Comparing peers with different R&D capitalization policies on EV/EBITDA makes heavy capitalizers look artificially “cheap.”

Example:

In the 2024 financial year, Leonardo reports revenues of €17,763 million, EBITDA of €2,219 million and EBIT of €1,271 million. In management terms, EBITDA is obtained by adding back depreciation and amortisation to EBIT, which implies depreciation and amortisation of about €948 million (2,219 − 1,271). In formula form, EBITDA = EBIT + Depreciation + Amortisation = 1,271 + 948 ≈ 2,219. All figures are in millions of euros, with minor differences due to rounding. EBIT already includes the economic cost of depreciation and amortisation (including, for example, the amortisation of capitalised development costs), while EBITDA adds it back and therefore does not “see” this cost, which is why EV/EBIT often provides a more meaningful economic comparison than EV/EBITDA when analysing A&D companies like Leonardo.

A pocket example makes the point. Suppose revenue is 1,000 and cash operating costs are 800: EBITDA equals 200. Add 40 of industrial D&A and 100 of amortized, capitalized R&D: EBIT is 60. An 8× EV/EBITDA screen implies EV of 1,600; a 12× EV/EBIT anchor implies 720. The optics diverge because EBITDA suppresses an economically meaningful charge. In practice, anchor on EV/EBIT; if you must use EBITDA for market convention, normalize it by re-expensing capitalized R&D or by separating “maintenance-like” D&A from program amortization.

Always cross-check with EV/FCF (or FCF yield). In long-cycle industries, the acid test is whether booked economics pass through working capital and reach free cash once advances unwind, inventories build for rate ramps, milestones slip and remediation spending intrudes. EV/FCF disciplines any narrative derived from headline EBIT.

Backlog: quantity is the headline; quality drives value

Backlog is tomorrow’s revenue promise—but investors price what kind of promise it is. Start from a clean definition. Boeing defines total backlog as unsatisfied or partially satisfied performance obligations for which collection is probable and no customer-controlled contingencies remain; it excludes options, announced deals without definitive contracts, orders customers can unilaterally terminate, and unfunded government amounts.

Scale and coverage provide context, not answers. At 31 December 2024, Boeing reported $521.3bn of total backlog, comprising $498.8bn contractual and $22.5bn unobligated, while cautioning that delivery delays, production disruptions or “entry-into-service (EIS)” slippage can reduce backlog.

Leonardo closed 2024 with book-to-bill of ~1.2×, backlog above €44bn and roughly 2.5 years of production coverage—solid starting points if the mix is funded and executable.

Quality is the determinant. Judge the funded share (appropriated vs contingent), the margin mix by program, concentration by customer or platform, and—critically—executability against industrial capacity, certification gates and supplier health. A smaller, well-funded, high-margin and diversified backlog with credible executability justifies stronger multiples than a larger book that is lightly funded, concentrated or operationally brittle.

Revenue and Backlog diversification.
Revenue and Backlog diversification chart
Source: Leonardo S.p.A. — FY 2024 Preliminary Results Presentation (PDF).

The chart shows the percentage distribution of Leonardo’s backlog in relation to its product portfolio, highlighting the weight of the various business lines and geographical areas.

Leonardo DRS Backlog.
Leonardo DRS Backlog
Source: Leonardo DRS — Q3 2024 results article (StockStory).

Over time, the chart shows new orders increasingly outpacing those delivered: after an initial phase of balance (stable backlog), from late 2022 incoming orders rise and expand the order book. The jump between Q3 and Q4 2023 points to one or more major contracts, while in 2024 the order flow remains strong enough to keep the backlog at high levels.

Contract risk: the paper your revenue sits on

Two nominally similar contracts can encode very different economics. Firm-fixed-price development places cost risk squarely on the contractor; technical uncertainty and learning-curve effects can generate catch-up losses and re-time cash. Cost-type contracts reimburse allowable costs plus a fee, limiting downside but capping upside and typically improving visibility. Milestone/performance-based structures align incentives but increase timing volatility. IDIQ/framework arrangements set a ceiling but do not become firm until orders are called.

For valuation, portfolio contract mix is a prior on both the dispersion of outcomes and the discount you apply: heavy fixed-price development warrants more conservative multiples and scenario ranges; cost-type and service-heavy portfolios support tighter distributions of cash outcomes.

Execution and supply chain: where backlog becomes (or does not become) cash

A&D manufacturing is materials- and certification-intensive. Boeing highlights reliance on aluminium, titanium and composites, and the prevalence of sole-source components whose qualification can take a year or more; failure of suppliers to meet standards or schedules can affect quality, deliveries and program profitability.

Airworthiness oversight also constrains timing: in 2024 the FAA communicated it would not approve 737 production-rate increases beyond 38/month or additional lines until quality and safety standards are met.

In models, these realities alter revenue phasing, inventory (often rising when rates slip), the sustainability of customer advances, and, where remediation is required, the cadence of capex and engineering spend. The practical consequence is straightforward: multiples are a consequence of cash reliability. EV/EBIT (or normalized EBITDA) captures the economic load; backlog quality and contract mix explain whether those economics are repeatable; factory and supply chain determine the when of revenue and free cash.

Typical business mix—why it matters for valuation

Commercial platforms (e.g., BCA) recognize revenue largely at delivery, with program accounting and rate decisions driving cash swings; 2024 disclosures explicitly tie BCA results to deliveries, rate disruptions and quality actions.

Defence and space portfolios (e.g., BDS; Leonardo Defence Electronics & Space) contain more over-time revenue and often greater visibility when cost-type work dominates, yet fixed-price development can be painful, as the program notes above illustrate.

Services/MRO and training (e.g., BGS; Leonardo’s cyber and service activities) usually provide steadier margins and higher cash conversion, acting as stabilizers in a SOTP.

A compact playbook you can actually use

Start with EV/EBIT—or, if you must use EBITDA, normalize for capitalized development. Then check EV/FCF to interrogate cash conversion through advances, inventory and milestone timing.

Qualify the order book before you underwrite it: insist on firm definitions (exclude options and unilateral cancellations), isolate the funded share, examine program-level margins and concentration, and test executability against rate plans, certification gates and supplier health. Boeing’s split between contractual ($498.8bn) and unobligated ($22.5bn) backlog is a clean template; Leonardo’s book-to-bill (~1.2×) and ~2.5-year coverage are strong if the mix converts.

Read the contract. Fixed-price development deserves a discount for volatility; cost-type merits a premium for visibility; IDIQ ceilings are not orders until called. Boeing’s fixed-price development programs provide a cautionary case. Underwrite execution with a materials and supplier map (Al/Ti/composites; sole-source exposure) and with regulatory gates (FAA/EASA) that can cap rates irrespective of demand.

Why should I be interested in this post?

As an ESSEC finance student focused on valuation and transactions, you will frequently compare A&D peers and screen targets. This guide helps you avoid EBITDA traps, read backlog quality, and translate contract structures into realistic cash and multiple assumptions that travel well into comps, equity research, and M&A models.

Related posts on the SimTrade blog

   ▶ Nithisha CHALLA Top 5 companies in the defense sector

   ▶ Snehasish CHINARA Apprenticeship experience as Customer Finance & Credit Risk Analyst at Airbus

   ▶ Andrea ALOSCARI Valuation methods

Useful resources

The Boeing Company — Official website

Leonardo S.p.A. — Official website

Leonardo DRS — Q3 2024 results article (StockStory)

Leonardo S.p.A. — FY 2024 Preliminary Results Presentation (PDF)

Leonardo S.p.A. — Integrated Annual Report 2024 (PDF)

The Boeing Company — Form 10-K (Year Ended Dec 31, 2024) — EDGAR

About the author

The article was written in November 2025 by Emanuele BAROLI (ESSEC Business School, Master in Finance (MiF), 2025–2027).

My internship experience as an analyst assistant at China Bond Rating

Add Post

Tianyi WANG

In this article, Tianyi WANG (ESSEC Business School, Global Bachelor in Business Administration (GBBA), 2022-2026) shares her professional experience as an Analyst Assistant at China Bond Rating in Beijing.

About the company

China Bond Rating Co., Ltd. (CBR), established in 2010 with a registered capital of RMB 50 million, has grown into one of the core credit rating institutions in China’s fixed-income market. The company employs around 280 professionals and operates under an “investors-pay” model designed to enhance its independence and objectivity. Over the years, it has built a comprehensive analytical framework covering macroeconomic research, sectoral risk evaluation, credit modelling, structured finance, and green finance.

Logo of China Bond Rating .
Logo of China Bond Rating
Source: the company.

CBR provides a wide range of services including issuer credit ratings, bond and ABS credit assessments, credit-risk-based valuation models, market pricing services, and risk monitoring tools. Its clients span local governments, state-owned enterprises, financial institutions, corporates across industries, and institutional investors in the interbank bond market. According to regulatory disclosures, the company issued over 1,180 new credit ratings in a recent year, covering more than RMB 34 trillion in bond issuance. These credit opinions are widely used for investment decisions, regulatory compliance, and bond pricing, making the firm a key contributor to transparency and information efficiency in China’s fixed-income ecosystem.

As part of its methodology, China Bond Rating uses a structured rating grid similar to international rating agencies, ranging from high-grade ratings (AAA, AA, A) to speculative-grade categories (BBB, BB, B, etc.). Credit ratings help investors assess default risk, determine appropriate yield spreads, and monitor changes in an issuer’s financial strength over time.

Grid of China Bond Rating.
 Grid of China Bond Rating
Source: the company.

My internship

From August to November 2023, I worked as an Analyst Assistant at the Investment Service Department. The experience allowed me to gain deep exposure to China’s local government financing system and understand how professional credit evaluations are produced from both data and policy perspectives.

My missions

My primary mission was to support the team in building and maintaining credit evaluation databases for local governments and urban investment enterprises. I conducted detailed research on more than 130 companies across the Sichuan and Chongqing regions, analyzing their business structures, investment pipelines, guarantee arrangements, and key financial items. I helped calculate funding gaps and conducted preliminary assessments of repayment risk.

I also created and updated database templates using Excel, SQL, and internal analytical tools to maintain credit evaluation data for local governments, urban investment enterprises, and bond issuance activities. This included compiling statistics on local government bonds and special refinancing bond issuances.

Another major part of my mission was to verify and cross-check corporate operational and financial data to support fundamental research. I helped review over 60 debt financing reports and credit analysis documents, ensuring accuracy and consistency across key metrics. Through this work, I learned how rating agencies ensure data reliability before forming credit opinions.

Required skills and knowledge

This internship required strong analytical thinking, attention to detail, and the ability to manage large volumes of financial data. Hard skills such as Excel modeling, SQL queries, statistical analysis, and familiarity with financial statements were essential. Equally important were soft skills such as communication, logical reasoning, and the ability to organize information from inconsistent disclosures.

Given the diversity of local government financing practices across regions, I needed to quickly understand differences in fiscal structures, reporting standards, and project pipelines. The role required not only technical ability but also a policy-oriented mindset to interpret the implications of debt levels, off-balance-sheet risks, and industry trends.

What I learned

Through the database reconstruction and indicator standardization work, I gained a systematic understanding of credit risk assessment and the financial mechanisms behind China’s local government financing vehicles (LGFVs). I developed the ability to assess repayment capacity based on funding gaps, cash flow projections, and guarantee relationships.

My contribution helped improve the efficiency of data extraction and cross-validation, significantly reducing the time required for report preparation. During the internship, I also discovered several enterprises exhibiting liquidity pressure and implicit debt risks. These findings supported the final credit rating conclusions.

Overall, this internship strengthened my skills in data management, logical analysis, and risk identification. It also deepened my understanding of how rating agencies support bond market stability through standardized evaluation and high-quality information disclosure.

Financial concepts related to my internship

I present below three financial concepts related to my internship: credit risk assessment, local government implicit debt, and refinancing pressure.

Credit risk assessment

Credit risk assessment is the foundation of the bond market. My work involved analyzing financial ratios, debt structures, liquidity indicators, and funding gaps to determine whether an issuer has adequate repayment capacity. These assessments directly influence credit rating outcomes and bond pricing.

Local government implicit debt

Urban investment companies often carry implicit debt obligations on behalf of local governments. Understanding the link between fiscal revenues, government guarantees, and off-balance-sheet debt was crucial to evaluating the financial sustainability of LGFVs.

Refinancing and liquidity pressure

Many LGFV issuers face refinancing pressure as their short-term borrowings accumulate. By tracking debt maturities and analyzing cash flow projections, I learned how rating agencies evaluate the risk of default and identify early signals of liquidity stress.

Why should I be interested in this post?

This post is relevant for students interested in fixed-income research, credit analysis, bond markets, or public finance in China. Working in a rating agency provides exposure to the fundamentals behind bond pricing, the interaction between public policy and financial markets, and the analytical rigor required to evaluate complex debt structures.

Related posts on the SimTrade blog

Professional experiences

   ▶ All posts about Professional experiences

   ▶ Snehasish CHINARA My Apprenticeship Experience as Customer Finance & Credit Risk Analyst at Airbus

   ▶ Samia DARMELLAH My Experience as a Credit Risk Portfolio Analyst at Société Générale Private Banking

   ▶ Matthieu MENAGER My professional experience as a credit analyst at Targobank

   ▶ Aamey MEHTA My experience as a credit analyst at Wells Fargo

   ▶ Jayati WALIA My experience as a credit analyst at Amundi Asset Management

Financial techniques

   ▶ Jayati WALIA Credit risk

   ▶ Raphaël ROERO DE CORTANZE Credit Rating Agencies

   ▶ Bijal GANDHI Credit Rating

   ▶ Dawn DENG Assessing a Company’s Creditworthiness: Understanding the 5C Framework and Its Practical Applications

Useful resources

China Bond official website

China Central Depository & Clearing Co., Ltd.

About the author

The article was written in November 2025 by Tianyi WANG (ESSEC Business School, Global Bachelor in Business Administration (GBBA), 2022-2026).

Religious imagery in finance: analysis of the book ‘Money’ by Émile Zola

William LONGIN

In this article, William LONGIN (Sorbonne School of Economics, Master in Money Banking Finance Insurance, 2024-2026) discusses the religious imagery in finance contained in the book ‘Money’ (L’Argent) by Émile Zola.

L’Argent

Published in 1891, L’Argent (Money) is a book written by Émile Zola a 19th-century French novelist and journalist, known for founding the naturalist literary movement and for his bold defense of justice in the Dreyfus Affair. The book ‘Money’ tells the story of Aristide Saccard, a Parisian banker whose risky projects lead to a boom and a crash of his bank called “The Universal Bank” on the Paris Stock Exchange. By using biblical references, metaphors of faith, and symbolism, the author shows how wealth is deeply intertwined with religion at the time of the Second Empire in France (1852-1870). Throughout the novel, the author conceptualizes “faith” as a value-generating mechanism, as shown by religious symbolism within financial institutions.

First edition of L’Argent by Émile Zola (1891).
 First edition of L’Argent by Émile Zola
Source: Bibilothèque Charpentier (Paris).

Faith creates value

In financial markets the law of supply and demand is what drives prices. The demand is driven by what market participants think an asset will bring back in terms of cash flows in the future. This is seen with the word “credit” that comes from the Latin word “credo” showing how belief is central in finance. This belief is uncertain and ungraspable as financial markets can be similar to the omnipotence of God. Zola illustrates this comparison by mixing liturgic elements with finance. In chapter 10 of the book, traders have blind faith in the markets ability to deliver and produce “miracles”. Zola compares stock-market belief with an irrational religion, blind to the signs of a crash.

“…the faithful believed in a rise as they believed in the good Lord.” (chapter 10)

In the General Theory of Keynes, markets are described as being influenced by “animal spirits” through instincts, moods, and confidence that drive people to invest or hold back, rather than pure logic. Similarly, Émile Zola adds a religious dimension to Keynes argument as the characters believe in financial miracles, almost presenting the stock market as the center of a religion of its own.

“…he searched to know by what fault God had not allowed him to bring to fruition the great Catholic bank destined to transform modern society, that treasure of the Holy Sepulchre which would restore a kingdom to the Pope…” (chapter 12)

The main character, Saccard, blames God rather than his own actions, evading moral responsibility for how he handled his clients’ money and shifting guilt onto a higher power. The “sacralized” project of the Universal bank tied to the Holy Sepulchre and the papacy pushes the project as a catholic investment. By intertwining the Holy Sepulchre’s “treasure” with banking, Zola blurs the line between crusade and commerce.

Banks and stock exchanges: religious buildings

Throughout the book the stock market is compared to a church. In the first chapter a comparison of the staircase of the stock exchange is made comparing the level of usage of the stairs saying the they were “more worn than the thresholds of old churches.” The stock exchange is later described “as a four-pointed star”. Zola ironically sacralizes the trading pit (la corbeille in French) comparing it to a modern temple where people worship capital.

Paris Stock Exchange building: Palais Brongniart in the 19th century.
Paris Stock Exchange building: Palais Brongniart in the 19th century
Source: Bourse de Paris archives.

La corbeille in the Paris Stock Exchange.
La corbeille in the Paris Stock Exchange
Source: Bourse de Paris archives.

Zola hints that modern hubris is architectural. In chapter 5, the board room of the Universal Bank is compared to a “chapel”. And later on, in chapter 8, the Universal Bank’s headquarters turns into a temple, “part temple, part café-concert”. Zola uses liturgical vocabulary to show the sacralization of finance. Through décor, ritual, and titles, the bank borrows sacred codes of respectability and vice versa, the church becomes a place to pray for gains and a better future. This logic is echoed in the construction of the J.P. Morgan building at 23 Wall Street in New York, whose early-twentieth-century, temple-like mass of stone, stripped of ornament and pierced by only a few windows, presents the bank as an inviolable shrine to capital, a solid and reassuring “sanctuary” for investors’ money. Like Zola’s Universal Bank, such architecture turns finance into a quasi-religious experience: a teller’s counter that resembles an altar or chapel is reassuring for its depositors.

People in finance

Zola presents leading financiers as disciplined to the point of asceticism (a way of living that deliberately avoids physical comforts and pleasures). The character of Gundermann is a powerful Jewish banker who embodies cold, rational, and stable finance serving as Saccard’s rival and the realistic counterpoint to his reckless speculation. He lives “a galley-slave life,” suggesting monk-like self-denial but at the same time living in a luxurious environment. His rapport to money is religious as seen in chapter 5, money is handled with “clerical discretion”.

Another striking aspect of L’Argent is the way Zola shows winners on the market being treated almost like superior beings. Successful financiers are not just clever speculators; they are revered as if they possessed a special, mystical intelligence. Early in the novel, Gundermann is described as an object of worship, with “crowds prostrated around the god” (chapter 1).

Portraits at the Paris Bourse
Portraits à la Bourse de Paris par Edgar Degas
Source: Edgard Degas.

Saccard, too, embraces this quasi-divine status. He casts himself as a savior of society rather than a mere businessman. “We are here to save everything,” he proclaims (chapter 5), boldly taking over the Church’s traditional mission of redemption and applying it to financial speculation. Zola reinforces this confusion of sacred and economic power through moments of visionary revelation through the idea of “The Universal Bank” appears to Saccard “as if in letters of fire,” as though granted by some higher power rather than born of greed and ambition. In this way, Zola suggests that modern capitalism creates its own gods, prophets, and miracles, transforming financial success into a new form of worship.

The figure below depicts the stock price trajectory of “The Universal Bank” as presented in the book. The horizontal axis reflects time, structured according to the chapters providing information on price movements, since Zola does not specify explicit calendar dates.

Evolution of the stock price of The Universal Bank shares.
 Evolution of the stock price of Universal Bank shares
Source: the author.

“What about today”

Today’s western civilization is much less religious than before with about only 50% of the French population claiming to believe in a religion where as it was once a majority during Émile Zola’s time. While Catholic credit unions once existed, Christian finance has mostly been replaced by ESG investing. The 2015 launch of the S&P 500 Catholic Values Index sparked some attention, but French banks rarely use religious symbolism.

In contrast, the U.S. has a well-developed Christian finance market. Firms like Knights of Columbus and Timothy Plan openly market faith-based portfolios aligned with biblical principles, often referencing scripture and using religious imagery. Products screen out morally objectionable sectors and promote “biblically aligned” companies, with ETFs like BIBL and PRAY leading the trend.

Related financial concepts

Price vs Value

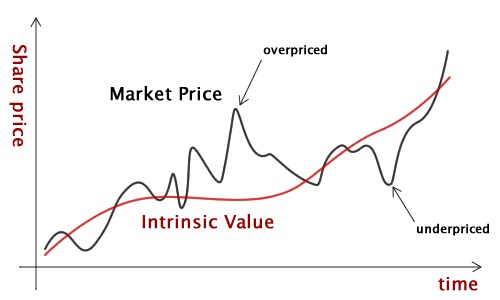
In L’Argent, Zola portrays a world where financial speculation takes on a religious fervor, blurring the line between what something costs and what it is worth. This distinction echoes the financial concept of price versus value. The price reflects what the market is willing to pay at a moment in time, while value reflects the underlying fundamentals such as assets or cash flows. In the book, characters often worship price movements as if they were divine signs, forgetting that markets can be irrational and driven by emotion rather than reality. This parallels how modern investors sometimes chase rising prices without questioning intrinsic value, illustrating the timelessness of Zola’s critique.

Discounted Cash Flow (DCF) model

A DCF model seeks to calculate the true value of an asset by estimating its future cash flows and discounting them back to the present. This rational, analytical approach contrasts sharply with the speculative excesses described in L’Argent, where anticipated gains and promised fortunes overshadow the analysis using real economic output. In a sense, a DCF is the opposite of the “faith-based finance” depicted by Zola: instead of belief, charisma, or collective enthusiasm, it relies on measurable expectations and the time value of money. If Zola’s financiers had applied something like a modern DCF approach, their illusions of endless prosperity would likely have dissolved, revealing how fragile and unsupported their dreams truly were.

Zola’s narrative anticipates key ideas from behavioral economics, which studies how human biases systematically influence financial decisions. In L’Argent, investors fall prey to herd behavior, overconfidence, illusion of control, and the “narrative fallacy,” believing in grand stories of progress and fortune. These behaviors mirror well-documented cognitive biases that affect markets today, bubbles, panics, and irrational exuberance. Zola intuitively captures how money can become a quasi-religious force, shaping collective psychology and pushing individuals to act against their rational interests. Behavioral economics formalizes these observations, showing that markets are not purely logical systems but human and emotional ones, just as Zola described.

In L’Argent, Zola forges a powerful equivalence between religion and finance to show how belief, more than metal or marble, mints value. By sacralizing the Exchange, the bank, and the financier himself, he renders capitalism’s success contingent on liturgy: architecture that reassures, rituals that discipline, and a priesthood of leaders who promise salvation through profit. The crowd’s devotions inflate prices the leader’s “revelations” and, as in any cult of miracles, the crash arrives as a kind of failed prophecy, exposing how the same belief that creates wealth can just as quickly unmake it.

Why should you be interested in this post?

By linking Zola’s 19th-century novel to today’s financial concepts, from credit and bubbles to ethical and faith-based investing, it reveals how belief still drives markets as much as numbers do.

Related posts on the SimTrade blog

Financial concepts

   ▶ William LONGIN How to compute the present value of an asset?

Useful resources

Articles and books

Keynes J.M. (1936) The General Theory of Employment, Interest, and Money, London: Macmillan (reprinted 2007).

Legoyt A. (1871-1872) La population française d’après le recensement de 1866, Journal de la Société Statistique de Paris , 12-13: 1-10.

Zola E. (1891) L’argent, Bibliothèque Charpentier, Paris.

SimTrade

SimTrade course Financial analysis

SimTrade

Palais Brogniart (Paris Stock Exchange builing) Financial analysis

About the author

The article was written in November 2025 by William LONGIN (Sorbonne School of Economics, Master in Money Banking Finance Insurance, 2024-2026)

My internship experience at BearingPoint – Finance & Risk Analyst

Julien MAUROY shares his professional experience as a Finance & Risk Analyst at Bearingpoint.

Overview of BearingPoint

BearingPoint is a management and technology consulting firm founded in 1997, with European origins and international reach. The firm operates in more than 20 countries and has over 6,000 employees. It supports large companies, financial institutions and public organizations in their strategic, financial and digital transformation projects.

The firm’s unique selling point is its ability to combine strategic thinking with operational implementation. Its consultants are involved throughout the entire process, from defining the strategy to its concrete implementation. BearingPoint also stands out for its strong entrepreneurial culture, based on collaboration, knowledge sharing and continuous skills development.

Logo of BearingPoint.
Logo of BearingPoint
Source: the company.

My experience and service

I joined BearingPoint France as an intern analyst in the Finance & Risk department. I completed this internship during the first part of my gap year for a period of six months, from September 2024 to February 2025.

The Finance & Risk department supports the finance departments of large international groups (both private and public) in their transformation projects: optimizing management processes, performance management, digitization of financial tools and risk control. I had the opportunity to participate in a variety of assignments, combining financial analysis and strategic analysis. I worked for a company in the energy sector and had the opportunity to participate in the drafting of two commercial proposals.

As part of my client assignment, I worked in collaboration with a junior consultant, a consultant and a senior manager. I participated in all meetings with the client, contributed to the drafting of various deliverables, mainly in PowerPoint and Excel, produced reports and acted as PMO for effective project management. More specifically, I had the opportunity to gain detailed insight into the organization of a large group’s finance department and to understand the economic challenges and structure involved in the financial management of such an organization.

This assignment had a real impact on the company’s financial management in terms of both the budget and projections and actual results. I was able to interact directly with the finance departments and sometimes with members of executive committees, in a stimulating environment.

Explanation of the hierarchy

At BearingPoint, positions are organized around a clear hierarchy:

  • Analyst/Junior Consultant: participates in analyses, preparing deliverables and structuring data.
  • Consultant: manages part of the project, sometimes supervises a junior consultant and contributes to client relations.
  • Senior Consultant: provides technical or sector-specific expertise and leads certain assignments
  • Manager: coordinates the team, ensures the quality of deliverables and client satisfaction, and begins to work on several assignments at the same time
  • Senior Manager: a position between operations and assignment management, supporting consultants on assignments and with clients, leading project and steering committees, and structuring the deliverables plan
  • Director: strategic vision, supports senior managers in client relations and specialises in a sub-sector of the service (e.g. in public institutions in the Finance and Risk department)
  • Partner: designs the development strategy, supports and manages a portfolio of clients and contacts, defines the firm’s vision and sectors/areas of development

This hierarchical model provides a highly educational learning environment. Each level of responsibility represents a step forward in one’s career progression.

As a trainee analyst, I was able to learn directly from experienced consultants, understand the logic and structure of a project, and observe how managers structure strategic thinking. Consulting thus offers an environment where learning is continuous and skills develop rapidly.

Required skills and knowledge

On a technical level, the assignments I carried out strengthened my advanced mastery of tools such as PowerPoint and Excel for structuring models and analysing complex data. In addition, understanding budgetary processes, forecasting cycles and key financial indicators (KPIs, margins, cash flow) was essential for me to be able to work collaboratively with my teams on assignments. On a personal level, the consulting environment requires a high degree of adaptability, whether in client meetings, when encountering difficulties, or in keeping up with the fast pace of work. Rigour and attention to detail were also essential, as they are integral to the quality of the deliverables expected and the accuracy of the analyses performed. Finally, teamwork is central to BearingPoint. I strengthened my communication skills and my ability to be proactive and solution-oriented. These constant exchanges with my team members were a driving force for learning and progress.

What I learnt from this experience

This internship was particularly educational. I learned how to:

  • Structure my thinking and present analyses in a clear and concise manner (analysis of complex financial and quantitative models),
  • Work as part of a team in a demanding and intense environment where collaboration is essential,
  • Develop the analytical rigor needed to understand a company’s financial performance,
  • Finally, translate complex issues into concrete, quantifiable solutions tailored to the client.

Beyond the technical skills I developed, this experience confirmed my interest in financial strategy and consulting. It is a field that I found fascinating, where reflection, adaptation and a deep understanding of business issues are complementary.

Financial and Business concepts related to my internship

Here are three financial and business concepts related to my internship experience at Bearingpoint: financial analysis, writing commercial proposals and pricing assignments, and the strategic and analytical approach to barriers to financial performance for a company.

Detailed financial analysis by cost category

During my internship, I worked on a project that required me to examine in detail the cost structure of the company we were supporting. The analysis was based not only on its financial statements but also on those of its SPVs and the distribution of costs throughout the entire structure. It was necessary to distinguish between support and operational items by linking them to the appropriate cost centre to ensure that the allocation of costs was fair. This work required a deep understanding of the employees’ roles, as well as the financial challenges of each financial structure. One of the challenges was therefore to restructure the allocation of the company’s costs to ensure the right balance within the structures and enable them to grow without running out of resources.

Commercial proposals and pricing for assignments

I have had the opportunity to participate in the drafting of commercial proposals. This is a demanding task that is carried out in collaboration with the departments involved in the tender process. It is often an intense exercise, given the tight deadlines and the complexity of creating a convincing response that is tailored to the company. It is also through responses to calls for tenders that we can see the financial structure of a consulting assignment. Depending on the duration and the people who will be assigned to work on the assignment, there will be a price (number of people per grade x the FTE price per grade x the duration of the assignment). An FTE is a full-time equivalent, i.e. the price of one person working for one day.

Strategic approach and barriers to financial performance

During an assignment, I had the opportunity to work on analysing a company’s financial performance. The task was to identify cost items but also to find ways to optimise certain costs, facilitate access to information and improve understanding of revenues within the company. This involved both internal and external work with a strategic vision. Financial management is therefore a key factor in preparing a solid budget and setting targets that reflect the current situation. I had the opportunity to work on these elements and support the teams in implementing a financial management tool.

Why should I be interested in this post?

This position is a great opportunity to discover several sectors of activity while specialising in corporate finance. Consulting assignments allow you to work with a company and learn about its sector, strengths and weaknesses. This position is also challenging in a dynamic environment. You will be very exposed, working directly with the client, which is very educational but also demanding. It is a great way to learn from extremely competent and motivated teams.

Related posts on the SimTrade blog

   ▶ All posts about Professional experiences

   ▶ Annie YEUNG My internship experience at FTI Consulting

   ▶ Olivia BRÜN Working as a Strategy Intern at ANXO Management Consulting

   ▶ Mickael RUFFIN Strategy Consultant at Devlhon Consulting

   ▶ Snehasish CHINARA External Junior Consultant at Eurogroup Consulting

Useful resources

BearingPoint

About the author

The article was written in November 2025 by Julien MAUROY (ESSEC Business School, Global Bachelor in Business Administration (GBBA), 2021-2025).

My experience as a financial analysis assistant in China’s securities market

Tianyi WANG

In this article, Tianyi WANG (ESSEC Business School, Global Bachelor in Business Administration (GBBA), 2022-2026) shares her professional experience as a Financial Analysis Assistant at a leading securities firm in China.

About the company

The securities company where I completed my internship is one of China’s leading investment banks and brokerage firms. Founded in 2005, the CSC (China Securities Company) has expanded over the past two decades. In 2023, the firm reported total operating revenue of ¥232.43 billion, with a net profit of ¥70.34 billion, illustrating its strong financial scale. It operates across a broad range of business lines — equities, fixed income, asset management, wealth management, and structured and derivative products. Its own proprietary trading business generated ¥68.42 billion, a year-on-year increase of ~50.96%, showing the firm’s flexibility and strength in capital markets. On its balance sheet, the firm had total assets of ¥5,227.5 billion at the end of 2023 and a net shareholders’ equity of about ¥975 billion. Its return on equity (ROE) was 8.59%, reflecting relatively efficient use of capital.

Logo of China Securities Company (CSC).
Logo of China Securities Company
Source: the company.

Within the organization, the Financial Innovation Department occupies a strategic and highly cross-functional position. It integrates market research, product development, and investor education, acting as a bridge between frontline market activities and client engagement. The department monitors market trends daily and collaborates with trading desks to design and structure a broad range of innovative products—including equity-linked notes, autocallable structures, barrier options, total-return swaps, and market-linked wealth-management products. These solutions are tailored to the needs of diverse client groups, ranging from institutional investors such as mutual funds, hedge funds, insurance companies, and corporate treasuries to high-net-worth and retail investors seeking yield-enhancing or risk-controlled strategies. By translating complex market movements into accessible insights, preparing product explanations, and communicating risk–return characteristics, the department ensures that financial innovations are both technically sound and aligned with client objectives.

My internship

My internship allowed me to gain hands-on exposure to China’s fast-evolving securities markets. Working within the Financial Innovation Department, I engaged closely with market data analysis, product evaluation, and investor communication. The role helped me understand how market information shapes investment decisions and how securities firms design and present financial products to clients.

My missions

During my internship at the Financial Innovation Department, my missions covered a wide range of tasks across market research, product analysis, data management, and investor education. These responsibilities gave me a comprehensive understanding of how securities firms operate and respond to market developments.

A core part of my work involved daily market tracking. Using Bloomberg (a global financial data and analytics platform that provides real-time market data, news, trading tools, and research used by investment banks, asset managers and traders worldwide) and Wind (China’s leading financial data platform which offers comprehensive domestic market data, company financials and researches that widely used by Chinese securities firms, asset managers and regulators), I collected and analyzed data from the A-share market (China’s main domestic stock market, where shares of Chinese companies are traded in RMB and mainly listed in Shanghai and Shenzhen), the SSE Composite Index (The main stock index of the Shanghai Stock Exchange, tracking all stocks listed in Shanghai to show how the Shanghai market is performing overall), the SZSE Component Index (A major index on the Shenzhen Stock Exchange, made up of 500 representative Shenzhen-listed companies, used to show the performance of the Shenzhen market), and major ETFs. This required monitoring price movements, macro policy announcements, sector rotations, and liquidity patterns to support internal decision-making. I also assisted in building and maintaining internal market-tracking templates, which later became standard references for training materials and product discussions.

Beyond market research, I supported the team in evaluating and managing a broad set of financial products, including Snowball derivatives, fixed income instruments, trust products, and structured products linked to the CSI 500 Index (A major Chinese stock index that tracks 500 mid-cap companies listed on the Shanghai and Shenzhen stock exchanges. It reflects the performance of China’s mid-sized, fast-growing firms and is widely used as a benchmark for mutual funds, ETFs, and quantitative strategies). My tasks ranged from conducting payoff simulations and reviewing index-linked behavior to preparing model inputs and performing preliminary return estimations. Through this process, I learned how structured products are designed, priced, and monitored under different market conditions.

Another important part of my mission involved contributing to investor training and communication. I prepared financial product training materials, coordinated with private equity and trust companies, and helped explain how market trends affect product performance and applications. This strengthened my ability to translate complex market concepts into accessible explanations for clients.

Additionally, I compiled daily market news, summarized major macro and microeconomic developments, and drafted weekly livestream scripts for investors. This required identifying the most relevant policy signals, analyzing capital flows, and highlighting potential investment opportunities or risks. Over time, I learned how to condense large volumes of information into concise and actionable insights.

Together, these missions enabled me to contribute meaningfully to team projects while building a holistic understanding of the relationship between market dynamics, product structuring, and investor behavior in China’s securities market.

Required skills and knowledge

This internship required strong quantitative and analytical skills, as well as the ability to process and interpret complex financial information. Proficiency in Bloomberg and Wind was essential for collecting, filtering, and analyzing real-time market data. Knowledge of derivatives, structured products, and fixed income instruments was crucial for evaluating product behavior and understanding risk-return trade-offs.

Soft skills were equally important. Effective communication allowed me to collaborate with various stakeholders, including private equity firms, trust companies, and internal product teams. The ability to present market trends clearly and concisely was vital when preparing investor-facing materials. Adaptability and curiosity helped me navigate the fast-paced environment and quickly grasp new market developments.

What I learned

This internship deepened my practical understanding of China’s capital markets and strengthened my ability to analyze how changes in interest rates, volatility, and equity indices influence the pricing, risk, and returns of structured and derivative products. I learned how securities firms structure financial products, evaluate market conditions, and translate market developments into clear investment insights for clients.

I gained substantial hands-on experience using market-tracking tools such as Bloomberg and Wind to monitor equity indices, interest-rate movements, and macroeconomic indicators. This involved cleaning and analyzing data sets, comparing sector performance, and interpreting policy announcements—such as PBOC (People’s Bank of China) rate adjustments or new regulatory guidelines—to understand their market impact. I also learned to evaluate structured products by breaking down their payoff mechanisms, running scenario analyses (e.g., changes in volatility or index levels), and assessing how underlying indices like the CSI 300 or CSI 500 affect expected returns and risk exposure..

Perhaps most importantly, I learned how investor sentiment, liquidity conditions, and macroeconomic policies collectively drive market trends. This holistic perspective strengthened my interest in pursuing further professional opportunities in investment research and product structuring.

Financial concepts related to my internship

Below, I present three financial concepts that are closely connected to my internship experience: market microstructure, derivative payoff structures, and investor behavior.

Market microstructure

Understanding market microstructure—how prices are formed, how information is incorporated, and how liquidity varies across instruments—was essential for interpreting daily index and ETF movements. This concept directly informed my market analyses and helped me anticipate how policy announcements might affect trading behavior.

Derivative payoff structures

Products such as Snowball derivatives or CSI 500–linked structures rely on complex payoff mechanisms that depend on volatility, barriers, and index paths. My internship taught me how these products generate returns, how risks are embedded, and how product suitability changes under different market environments.

Investor behavior and sentiment

Investor sentiment plays a critical role in shaping short-term market movements. By preparing market commentary and livestream scripts, I observed how expectations, policy interpretations, and risk attitudes influence trading flows. These insights helped me understand the psychological dimension of financial markets.

Why should I be interested in this post?

This post is particularly relevant for students aspiring to work in financial markets, investment research, or product structuring. The internship offers hands-on exposure to real-time market analysis, derivative product evaluation, and investor communication—core competencies for many finance careers. It also demonstrates how foundational knowledge from coursework can be applied directly to professional settings.

Related posts on the SimTrade blog

   ▶ All posts about Professional experiences

   ▶ Alexandre VERLET Classic brain teasers from real-life interviews

Useful resources

China Securities Company

China Securities Index Co., Ltd.

Shanghai Stock Exchange

Shenzhen Stock Exchange

China Securities Regulatory Commission

About the author

The article was written in November 2025 by Tianyi WANG (ESSEC Business School, Global Bachelor in Business Administration (GBBA), 2022-2026).

My experience as a Working Student in Infrastructure Investment Inhouse Consulting at Munich Re

Nicolas SCHULZ-SEMBTEN

In this article, Nicolas SCHULZ-SEMBTEN (ESSEC Business School, Global Bachelor in Business Administration (GBBA), Exchange semester 2025) shares his professional experience as an apprentice and working student in Infrastructure Investment Inhouse Consulting at Munich Re.

About the company

Munich Re is one of the world’s leading reinsurance groups, headquartered in Munich, Germany. With around 44,000 employees and annual revenues of approximately EUR 60–70 billion, Munich Re is comparable in size to other major global reinsurers, including Swiss Re, Hannover Re, SCOR and Everest Re. Munich Re operates worldwide in the fields of reinsurance, primary insurance (mainly through its ERGO brand), and asset management.

The core of Munich Re’s business model is reinsurance: primary insurers transfer part of their risks and premiums to Munich Re, enabling them to increase their capacity and protect themselves against large or catastrophic losses. Premiums are received upfront, while claims are often paid out years later. The resulting ‘float’ is invested in financial markets by the group’s asset management division, which manages a diversified, multi-billion-euro portfolio including bonds, equities, and alternative assets such as real estate and infrastructure. In this way, Munich Re combines underwriting profit from insurance and reinsurance with investment income from its global portfolio.

Logo of Munich Re.
Logo of Munich Re
Source: the company.

Within the group, I worked in the Infrastructure Investment Inhouse Consulting team. The team’s remit includes supporting Munich Re and its asset management arm MEAG (Munich Re’s asset management company) in analysing, structuring and monitoring infrastructure investments. These investments span a range of sectors, including renewable energy (solar and wind), digital infrastructure (data centers and fiber networks) and real estate-related projects, among many others. Acting as strategic advisors within the investment process, the team combines financial modelling, risk analysis, due diligence and ESG (Environmental, Social and Governance) assessments into a unified investment framework for MEAG and Munich Re.

My internship

I first joined Munich Re as an Insurance and Finance apprentice, later continuing as a working student within the Infrastructure Investment Inhouse Consulting team. Over the course of two years, I was involved in various infrastructure transactions and portfolio projects. While my role mainly involved ESG analysis, I also supported the financial and risk analysis of new investments.

My missions

A central part of my role involved conducting ESG analysis. For each potential or existing infrastructure investment, our team assessed the environmental, social and governance risks and opportunities involved. I was responsible for maintaining and developing an ESG questionnaire in Excel, which we sent to project sponsors, operators and asset managers. They provided detailed information on topics such as carbon footprint, energy efficiency, biodiversity, health and safety, community impact, governance structures, and compliance.

Once the questionnaire had been completed, I consolidated and verified the data, clarified any outstanding issues with the counterparties, and converted the qualitative responses into quantitative ESG scores. These scores were then linked to frameworks such as the EU Taxonomy (the European Union’s classification system for environmentally sustainable economic activities). I supported the preparation of ESG scorecards and summaries that fed into the overall investment recommendation. Although I did not make any decisions independently, my analyses were an important input for the team.

Required skills and knowledge

This position required a combination of hard and soft skills. In terms of technical skills, a solid grasp of Excel was essential for handling large datasets, building financial models, and automating parts of the ESG questionnaire. A good grasp of fundamental corporate finance principles such as discounted cash flow, IRR, WACC and leverage was necessary to comprehend and contribute to the valuation process. Knowledge of sustainability regulations (EU Taxonomy, SFDR) and ESG ratings helped me interpret data and understand the importance of certain indicators.

On the soft skills side, attention to detail and a structured approach to work were crucial, particularly when validating ESG data or checking models. Strong communication skills were also important: I often had to coordinate with colleagues from different departments and clarify queries with external partners. Finally, a proactive and curious approach helped me quickly learn about new sectors, such as how a data centre operates or how the revenue of a wind farm depends on weather conditions and power prices.

What I learned

Through this experience, I learned how institutional investors evaluate infrastructure assets from financial and ESG perspectives. I gained practical insight into modelling long-term cash flows, identifying and quantifying risks, and structuring the decision-making process of investment committees. I also realised how central ESG has become to investment decisions, with topics such as carbon emissions, biodiversity and social impact now being systematically integrated into risk-return analysis.

Personally, I became more confident when working with complex Excel models and presenting my results to senior colleagues. I learned how to balance recurring tasks, such as updating ESG questionnaires, with project-based work. Ultimately, this internship has confirmed my interest in finance, infrastructure, and sustainable investing, motivating me to pursue a career in investment-related roles, such as in infrastructure or private equity.

Financial and economic concepts related to my internship

Below, I present two financial and economic concepts related to my internship: risk-return profile of investments and portfolio diversification, and ESG integration in investment decisions.

Risk-return profile of investments and portfolio diversification

Institutional investors such as Munich Re consider infrastructure not only as individual projects, but also as part of a wider portfolio. Infrastructure typically offers long-term, relatively predictable cash flows and may provide an illiquidity premium — an additional return for locking in capital over many years. However, these assets also carry specific risks, such as regulatory, political, construction or technology risks.

In our team, we analysed how new investments fit into the existing portfolio in terms of sector, geography, and risk profile. For instance, adding a fibre network investment to a portfolio heavily exposed to renewable energy can enhance diversification, as the cash flows depend on different drivers. I learnt how the correlation between assets and the effects of diversification are considered when building an infrastructure portfolio that balances risk and return.

ESG integration and EU Taxonomy alignment.

ESG integration means that environmental, social and governance factors are systematically included in the investment process alongside traditional financial metrics. In Europe, the EU Taxonomy provides a classification system that defines which economic activities can be considered environmentally sustainable. For infrastructure investors, this involves assessing whether a renewable energy project, for example, contributes to climate change mitigation and meets specific technical screening criteria.

Why should I be interested in this post?

If you are a business or finance student interested in investment careers, infrastructure investment provides a thrilling blend of finance, strategy, and sustainability. You will work with tangible assets that have a real impact on the economy, such as renewable energy projects that support the energy transition and digital infrastructure that enables data and connectivity.

Related posts on the SimTrade blog

   ▶ All posts about Professional experiences

   ▶ Andrea ALOSCARI My Internship Experience in the Corporate & Investment Banking division of IMI – Intesa Sanpaolo

   ▶ Julien MAUROY My internship experience at Bpifrance – Finance Export Analyst

   ▶ Louis DETALLE My professional experience as a Credit Analyst at Société Générale

   ▶ Praduman AGRAWAL My Professional Experience as a Quantitative Analyst Intern at Findoc Financial Services

Useful resources

Munich Re – Official website

MEAG – Asset management of Munich Re and ERGO

EU Taxonomy for sustainable activities

GRESB – ESG benchmarks for real assets

About the author

The article was written in November 2025 by Nicolas SCHULZ-SEMBTEN (ESSEC Business School, Global Bachelor in Business Administration (GBBA), Exchange semester 2025).

“Most people overestimate what they can do in a year and underestimate what they can do in ten.” – Bill Gates

Hadrien Puche

In a world that often focuses on immediate results and instant gratification, it can be easy to overlook how regular effort accumulates into long-term impact.

This quote by Bill Gates reminds us that human ambition and effort are most effectively realized over extended periods of time. Planning ahead, embracing patience, and committing to consistent action are the keys to achieving extraordinary outcomes.

In this article, Hadrien Puche (ESSEC, Grande École, Master in Management, 2023 to 2027) reflects on this quote, exploring how it applies not only to personal growth but also to finance, and especially investing.

About Bill Gates

Bill Gates
Bill Gates

Source: Wikimedia Commons

Bill Gates is a co-founder of Microsoft and one of the most influential entrepreneurs of the late twentieth and early twenty-first century. Beyond his contributions to technology, he is widely recognized for his philanthropy through the Bill and Melinda Gates Foundation, which focuses on global health, education, and poverty reduction. Gates has often spoken about vision, long-term planning, and the accumulation of effort over time.

The quote, “Most people overestimate what they can do in a year and underestimate what they can do in ten,” is widely attributed to Bill Gates, although its true authorship is uncertain. What matters, however, is that Gates has consistently demonstrated through his work in technology and philanthropy how sustained effort and strategic planning can produce results that far exceed initial expectations.

Analysis of the quote

The central insight of this quote is that time magnifies effort. People often approach challenges with a short-term mindset, setting goals that are ambitious for a short period but fail to consider the compounding effect of consistent action. This makes them unable to reach these goals, leading to potential failure, whereas small steps over ten years can accumulate to produce extraordinary results.

This bias toward short-term thinking is prevalent in many areas of life, from career planning to investing. Individuals overestimate what they can accomplish quickly, which can lead to frustration when immediate goals are not met. Simultaneously, they underestimate what can be achieved over a decade, missing opportunities for growth, learning, and accumulation of value.

In finance, this mindset manifests in impatience with investments or ventures that require time to mature. In personal development, it is reflected in the failure to adopt habits that pay dividends over the long term. Gates’ quote is a reminder that extraordinary achievements are rarely the product of sudden effort. They are the result of consistent, incremental progress compounded over years.

This idea of long-term, incremental effort resonates closely with Malcolm Gladwell’s The Tipping Point: How Little Things Can Make a Big Difference. Gladwell explains how small, consistent actions or seemingly minor events can accumulate over time until they trigger a dramatic, outsized effect: the “tipping point.”

Economic and financial concepts related to the quote

I present below three financial concepts: compound interest, investment horizons, strategic planning and time diversification.

Compound interest

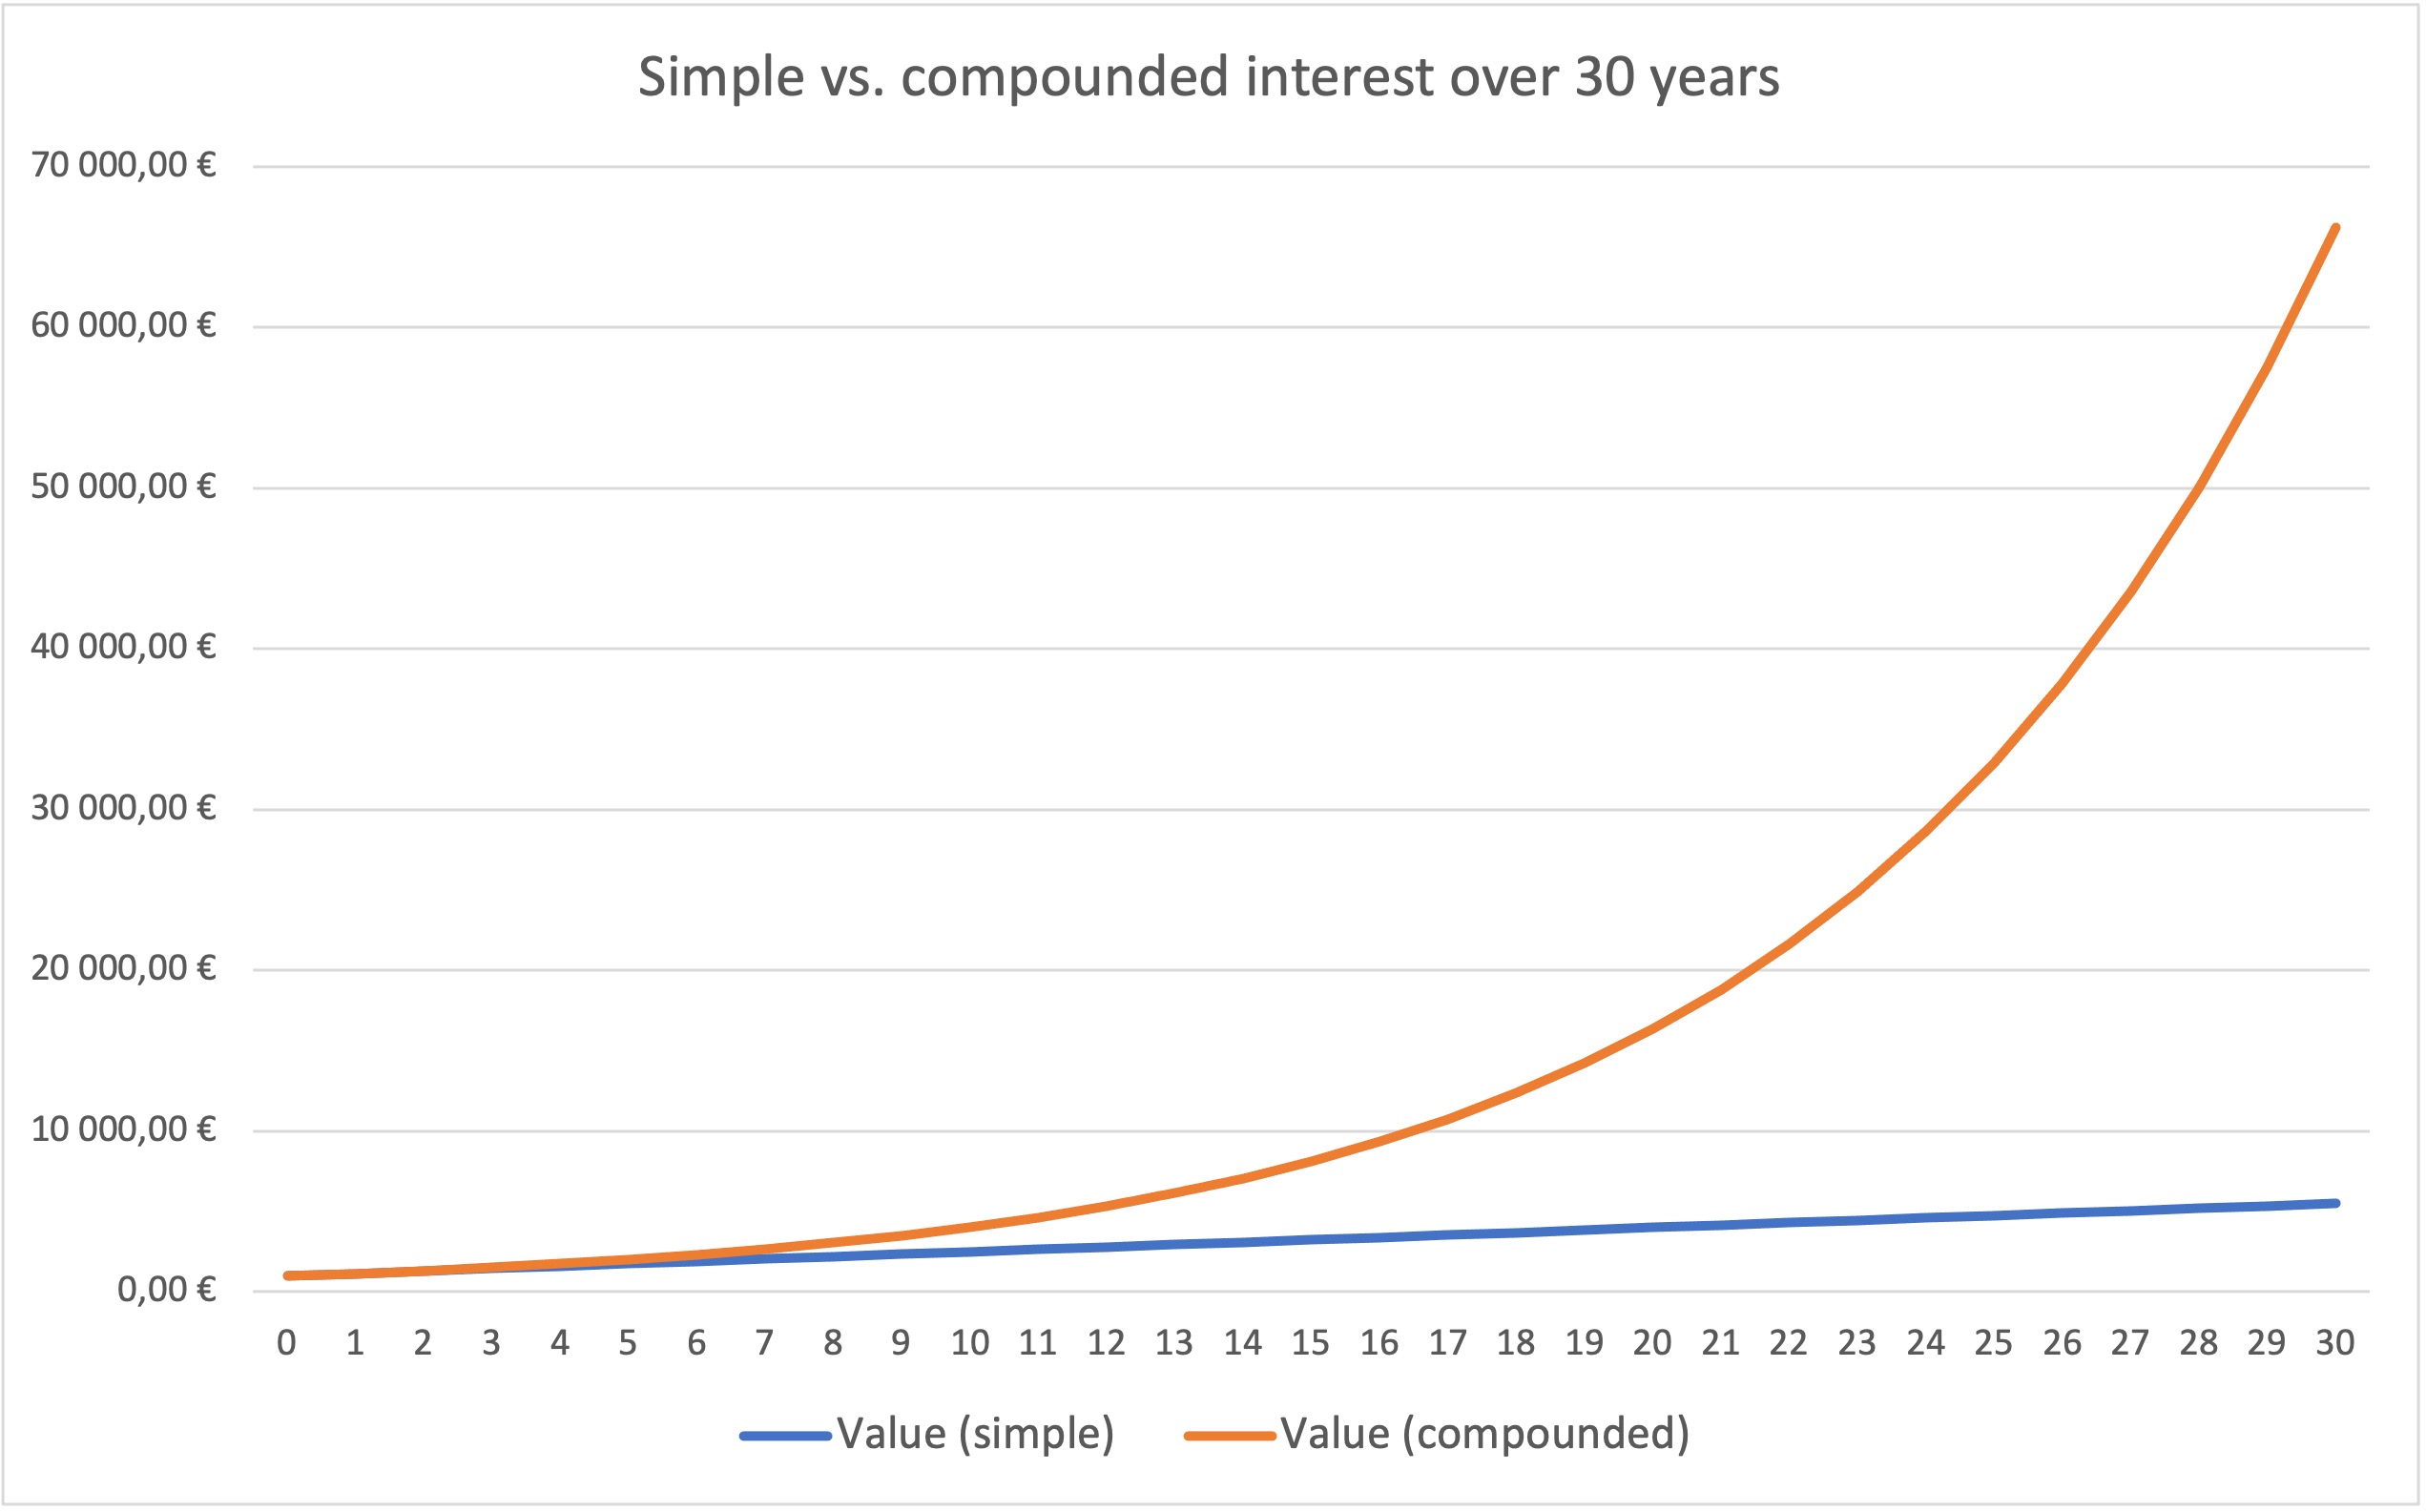
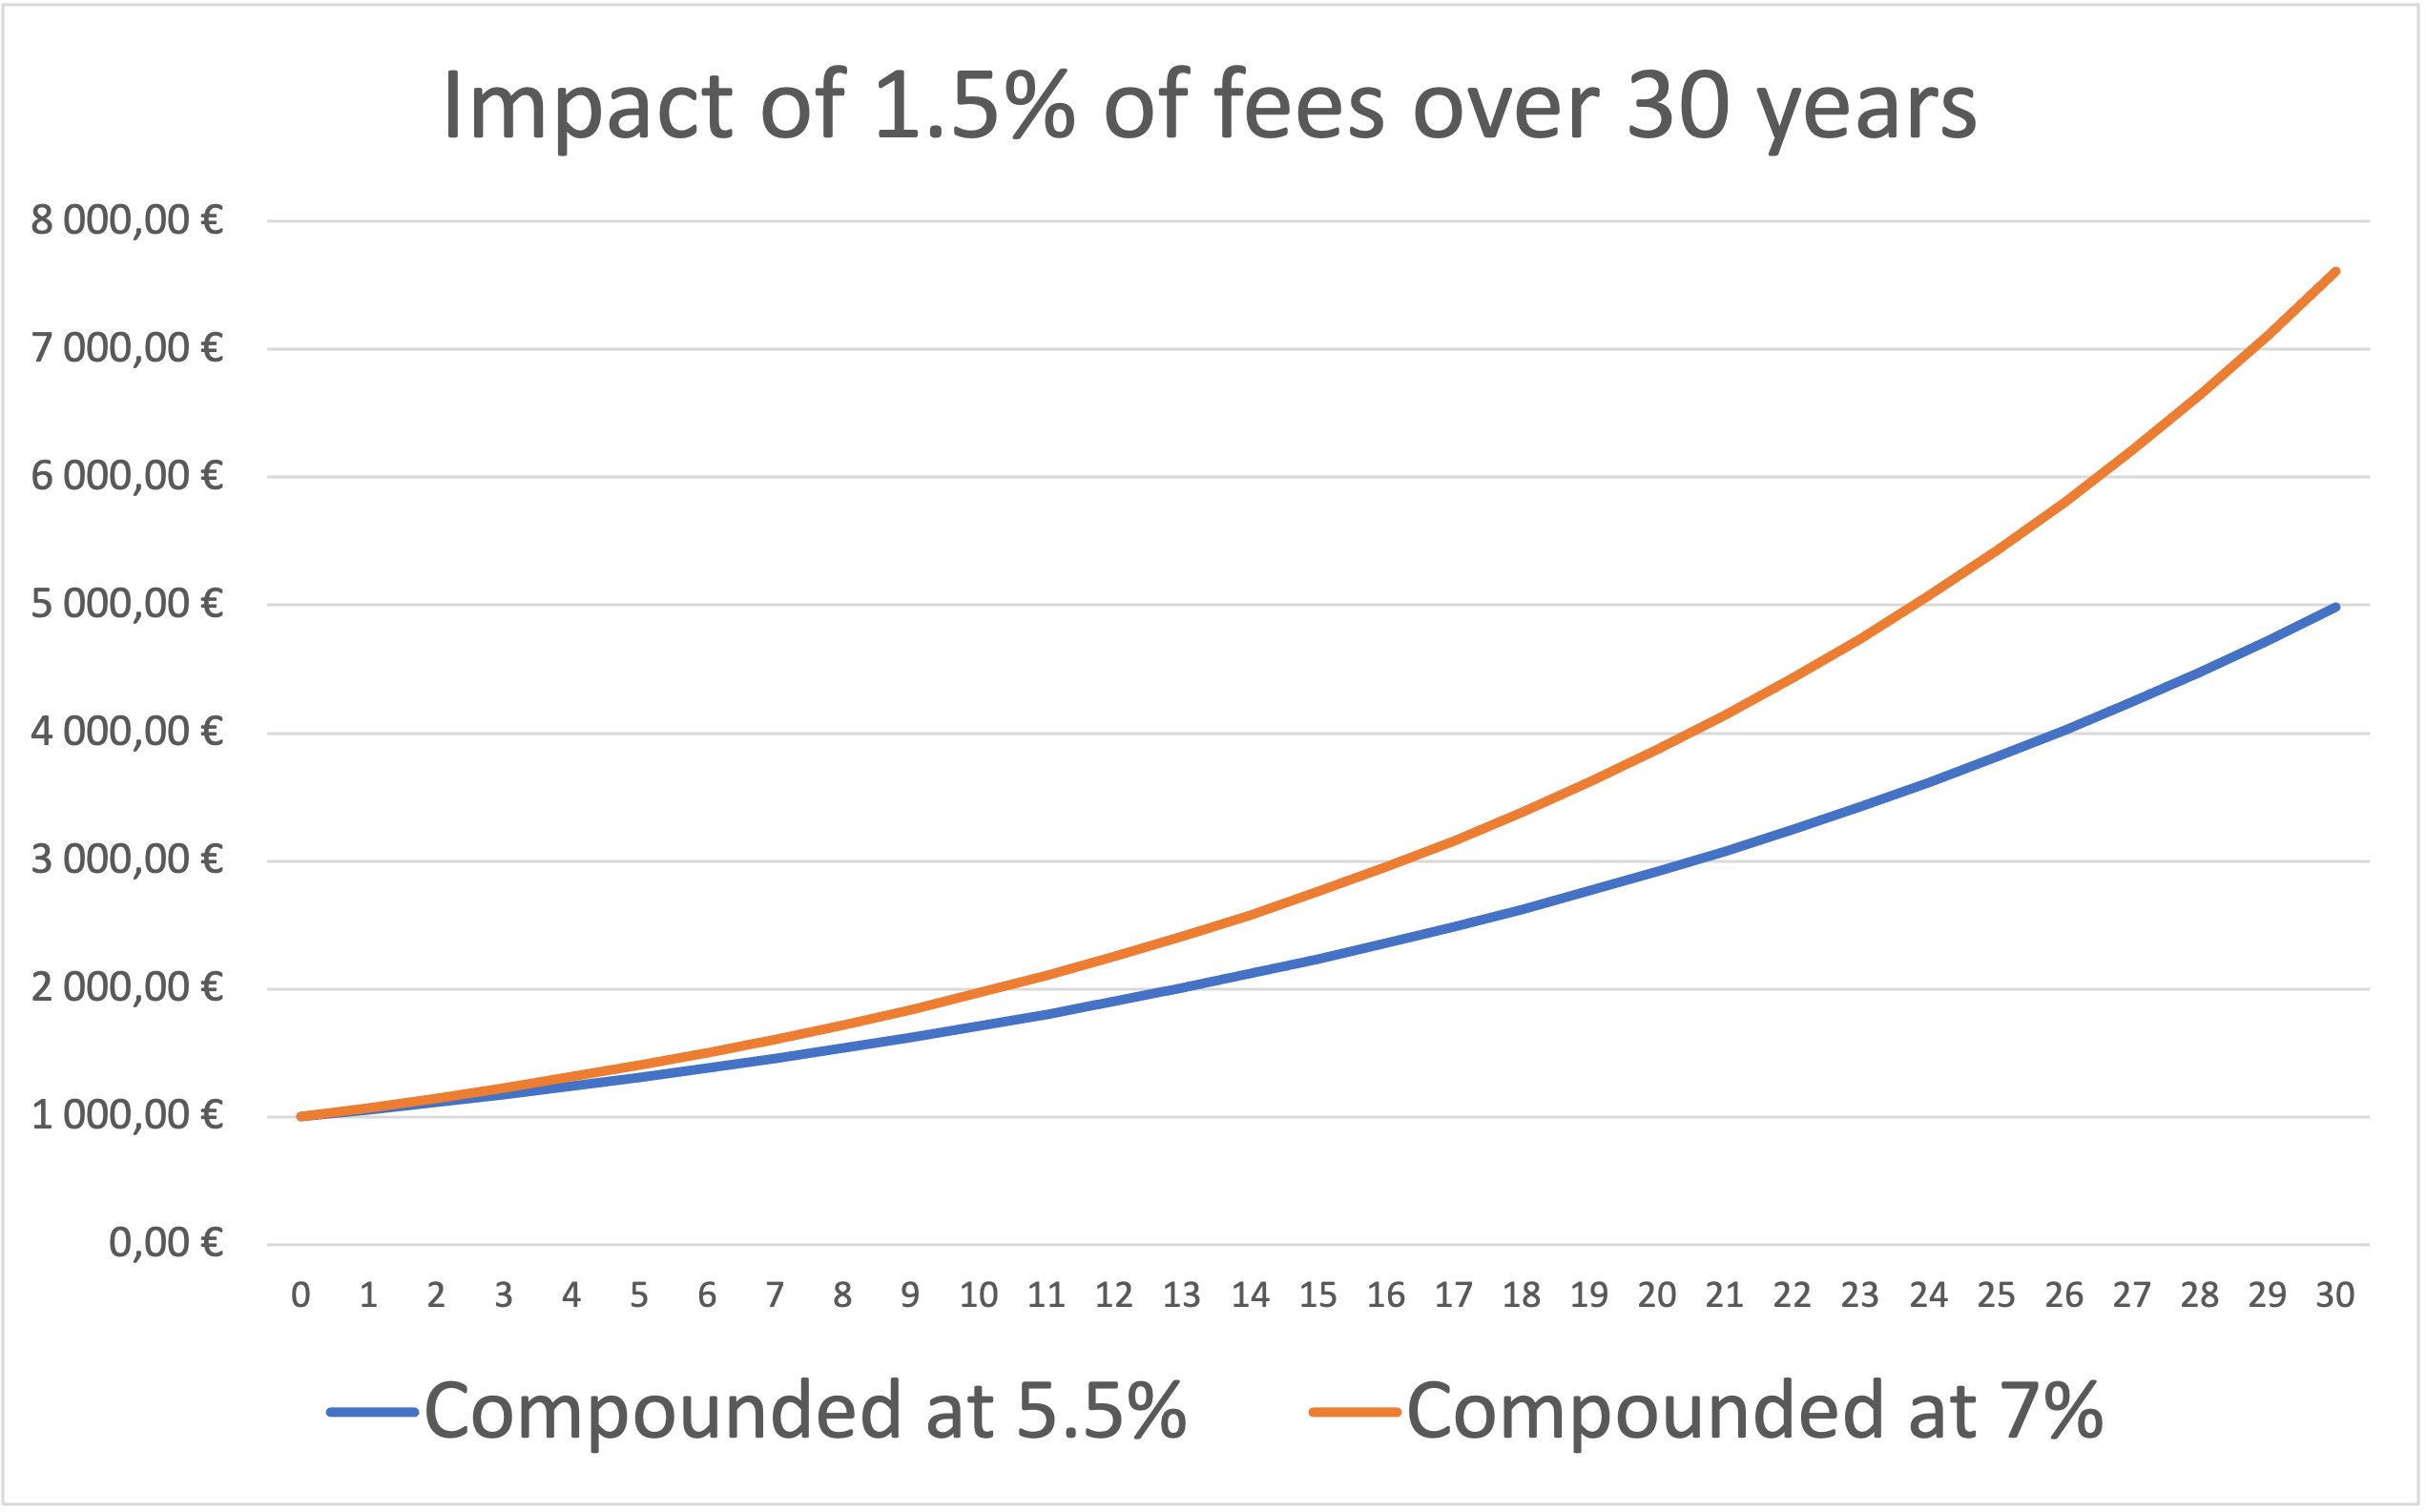
The concept of compound interest is perhaps the most direct financial parallel to Gates’ insight. In investing, the growth of wealth is not linear: returns earned on investments generate additional returns over time, producing an exponential effect. Individuals who understand and leverage compound interest can turn modest contributions into significant wealth over decades, whereas those who focus on immediate gains often miss the cumulative benefits. Gates’ quote captures this principle in human effort and strategic planning, emphasizing that patience and consistency are more powerful than short bursts of activity.

This is why Einstein famously called compound interest the “eighth wonder of the world.”

A graph showing the difference between simple and compounded interest

This graph shows how investing €1,000 over 30 years leads to exponential growth through compounding.

To better understand compounding, download this excel file and try to play around with the interest rate.

Download the Excel file to learn more about how compounding works

Investment horizons

Successful investing often relies on a long-term perspective. Markets can be volatile in the short term, but sustained investment in fundamentally sound assets typically produces growth over extended periods. Investors who overreact to short-term fluctuations may underperform by frequently buying and selling, while those who commit to a long-term strategy benefit from the power of time. Gates’ insight mirrors this approach.

From a financial standpoint, this is also a question of μ vs σ: in the short run, market movements are dominated by σ (sigma; volatility), which makes returns unpredictable and often discouraging. But over longer horizons, μ (mu; the average expected return) becomes more visible, and the noise of volatility fades relative to the trend. In other words, the longer you stay invested, the more likely the underlying growth of the market (and not short-term fluctuations) will determine your outcome.

A graph of the S&P 500 index since 1900

As you can see on this graph, the S&P 500 index tends to perform well on the long run and always recover from times of crisis.

Just as how small investments compound over many years, consistent effort in personal or professional life produces results far greater than what is visible in a single year.

Strategic planning and time diversification

In economics and business, strategic planning means looking beyond immediate gains and considering how decisions will play out over multiple years or even decades. Investments in areas such as research and development, employee training, or infrastructure rarely pay off right away. Yet, as these efforts accumulate, they can create lasting competitive advantages, foster innovation, and drive long-term profitability.

A similar logic applies in finance through time diversification. Short-term market fluctuations can be unpredictable, but the longer an investor stays committed to a well-constructed portfolio, the greater the chance that temporary volatility smooths out and long-term growth prevails.

Gates’ quote captures the essence of both ideas: meaningful results (in business, investing, or personal development) come not from quick wins but from sustained effort and the willingness to think further ahead than the next quarter or the next year.

My opinion about this quote

This quote feels especially relevant today, as the pace of technological change accelerates with the rise of artificial intelligence and other innovations. Society is not accustomed to this level of speed, which can distort our perception of what is achievable. While there is a temptation to believe that technological advances will produce massive change within just a few years, Gates’ quote reminds us to temper optimism with realistic expectations. In reality, it often takes considerable time for firms to integrate new technologies and realize meaningful productivity gains, as seen with the adoption of the internet and, more recently, with AI.

This dynamic is clearly illustrated in the graph below, known as the Gartner Hype Cycle. This framework describes the typical pattern of expectations surrounding new technologies. When a breakthrough such as generative AI emerges, public enthusiasm and media attention often inflate expectations far beyond what is achievable in the short term. As a result, we tend to overestimate the immediate impact of the innovation.

However, as the technology progresses through the different phases of the cycle (from initial excitement to disillusionment, and eventually to maturity), its long-term transformative potential becomes clearer. The Gartner Hype Cycle helps explain why we so often underestimate what a technology can achieve over a decade, even while exaggerating what it can achieve in its first year.

A graph of the Gartner Curve

The Gartner Hype Cycle, illustrating the typical progression of expectations around new technologies (Source: Gartner).

At the same time, the quote encourages reflection on long-term potential. Even if technologies develop more slowly than expected, incremental improvements over a decade can still lead to transformative outcomes. The lesson is to maintain both patience and vigilance, avoiding the extremes of overconfidence or neglect.

This principle also applies to personal finance and life planning. Many people set short-term goals and become frustrated when progress seems slow. Yet, the cumulative effect of consistent action, thoughtful saving, learning, or skill development often surpasses what we anticipate in the first year. By recognizing the value of long-term effort, individuals can better allocate resources, set meaningful goals, and make decisions that pay off over time.

In professional contexts, such as career progression or entrepreneurship, the quote is equally valuable. Building a company, developing expertise, or pursuing innovation rarely produces instant results. Sustained effort, compounded knowledge, and consistent decision-making are what lead to exceptional achievements over the long term.

Why should you be interested in this post?

Bill Gates’ quote is a reminder to plan thoughtfully, embrace patience, and recognize the exponential power of effort. While no one can predict the future with certainty, adopting a long-term perspective allows individuals to maximize the impact of their actions and investments.

This insight is particularly relevant for students and young professionals. You do not need a detailed plan for the next ten years, but considering the direction of your efforts and making incremental progress can dramatically improve outcomes over time. Recognizing the gap between short-term overestimation and long-term underestimation fosters discipline, focus, and resilience in both personal and financial decisions.

Whether applied to investing, professional development, or personal goals, this quote encourages a mindset that values consistency, foresight, and the compounding power of effort. Understanding this principle allows individuals to avoid the pitfalls of impatience while harnessing the opportunities presented by sustained dedication.

Related posts

   ▶ All posts about Quotes

Useful resources

– The Tipping Point: How Little Things Can Make a Big Difference by Malcolm Gladwell

About the Author

This article was written in 2025 by Hadrien Puche (ESSEC, Grande École, Master in Management 2023 to 2027)

My internship at Valori Asset Management

Roberto Restelli

In this article, Roberto RESTELLI (ESSEC Business School, Master in Finance (MiF), 2025–2026) shares key takeaways from a four‑month off‑cycle internship as an Investment Analyst Intern at Valori Asset Management, focusing on subordinated debt within the Fixed Income team.

Introduction

Before starting my Master in Finance at ESSEC Business School, I completed a four‑month off‑cycle internship at a €2.5bn asset management firm. The role developed my skills in credit risk assessment and gave me hands‑on exposure to macroeconomic analysis, performance‑measurement methodologies, the Bloomberg Terminal, and problem‑solving under time pressure. Within the Fixed Income team, I supported a subordinated debt fund through top‑down macro work and bottom‑up credit analysis on AT1 (CoCo), Tier 2, and RT1 bonds: subordinated bank and insurance capital instruments designed to absorb losses and meet regulatory capital requirements, sitting below senior debt in the capital structure and therefore offering higher yields in exchange for higher risk. AT1 (CoCo) and RT1 can be perpetual with discretionary coupons and loss-absorption features (write-down or equity conversion), while Tier 2 is typically dated, less deeply subordinated and only absorbs losses in gone-concern situations (resolution or insolvency). This post summarizes what I did at Valori Asset Management and what I learned—professionally and personally.

This was my first deep dive into fixed income after prior experience in private banking and equities. I learned that fixed income is not only about valuations and ratings; it also requires a macro view, policy awareness, trading considerations, and clear, critical thinking on portfolio positions.

About Valori Asset Management

Valori AM is an investment boutique founded 11 years ago, initially in Luxembourg and later expanding to Milan (Italy) and Chiasso, near Lugano (Switzerland). The SICAV (investment company with variable capital) are managed out of Luxembourg; advisory and family‑office services are in Milan; and the investment team in Chiasso manages nine funds. As of July 2025, assets under management and advisory (AUMA) were €2.5bn, with a target of €3bn by January 2026.

Logo of Valori AM.
Logo of Valori AM
Source: the company.

What I did during my internship

My work focused on three areas: ESG (Environmental, Social, and Governance) macro research and reporting; sovereign credit‑risk analysis across EMEA (Europe, the Middle East, and Africa), LATAM (Latin America), and the US; and two macro‑quantitative models.

ESG macro research and reporting

I conducted 30+ ESG country studies across EMEA and LATAM, using the Bloomberg Terminal to gather data and charts, and building Excel models to compare composite ESG scores and rankings. I complemented this with Morningstar Sustainalytics to benchmark carbon footprints and relative positioning. Bloomberg and Morningstar are two essential tools for working in asset management and hedge funds. Through the Bloomberg terminal, you can track real-time news on equities, fixed income, interest rates and all major financial markets, as well as access key economic and macro data for fixed income analysis, financial statements for equity positions, and even route securities orders via brokers. Morningstar is likewise crucial, not only for financial and economic news but also for ESG metrics and fund analytics. I produced concise reports highlighting the strongest ESG profiles—both in absolute terms and relative to the fund’s existing bond exposures. These outputs fed directly into portfolio discussions, ensuring ESG considerations were integrated alongside risk and return.

Sovereign credit‑risk valuation (EMEA, LATAM, US)

I performed 20+ sovereign credit assessments using indicators such as GDP growth, PMI, retail sales, current‑account balance (% of GDP), and unemployment. Sourcing data from Bloomberg and IMF (International Monetary Fund) forecasts, I translated the metrics into comparable Excel scorecards to surface relative value across regions. I then presented actionable ideas—such as Romanian government bonds, U.S. Treasuries, and Spanish bonds—to initiate new positions or reaffirm existing ones, linking macro fundamentals to valuation, liquidity, and timing.

Two macro‑quantitative models

  • BTP–Bund spread positioning model: an Excel‑based quant‑positioning model using ETF (exchange traded funds) flow data, Z‑scores (statistical measure that indicates how many standard deviations a value is away from the mean of a data set, allowing comparisons across different scales), regression analysis, CDS (credit default swaps), and macro‑financial indicators to generate daily signals and stay updated on the BTP (italian government bond)–Bund spread.
  • EU (europe) macroeconomic VAR (Vector Autoregression) model: a model for EU countries using key economic indicators and yield curves (GDP, PMI, retail sales, and 2‑ to 30‑year yields). I applied VAR analysis in EViews to forecast future movements of indicators and prices, with outputs aggregated in Excel; This macroeconomic VAR model is used to analyze how shocks to one variable (for example GDP or long-term yields) propagate over time to the other macro and yield-curve variables, and to generate consistent scenario analyses for EU economies. Using EViews, I estimated the VAR and produced multi-period forecasts for all the variables jointly, building different future scenarios and updating these forecasts as new data became available. EViews is a widely used econometrics and time-series analysis software, designed for estimating models, running statistical tests, and generating forecasts in a user-friendly interface.

Required skills and knowledge

The internship demanded both technical and soft skills. Technically, I worked extensively in Excel (modeling and forecasting), Bloomberg (market data and news), EViews (econometrics), and PowerPoint (investment pitches). On the soft‑skills side, I learned to prioritize under tight deadlines, double‑check deliverables, and solve problems independently to deliver high‑quality work.

What I learned

This internship provided practical experience in investment management within a professional, multicultural environment. I learned the importance of active listening: carefully understanding the initial brief and following colleagues’ discussions improves the quality and speed of the work. In a fast‑paced desk environment, acting like a sponge accelerates learning and connects day‑to‑day tasks with the bigger investment picture.

I deepened my fixed‑income knowledge beyond coursework: how rates, the broader debt market, and derivative hedges interact; how to think and debate credit; and how to combine top‑down macro views with bottom‑up analysis to form clear, defensible portfolio decisions. I also gained practical command of execution tools—building and stress‑testing Excel models, using Bloomberg for data and news, preparing pitches in PowerPoint, and applying econometrics in EViews. Altogether, the experience strengthened my analytical discipline and confirmed my long‑term interest in financial markets.

Financial concepts related to my internship

The role of AT1

AT1s typically offer equity‑like yields with bond‑like structures; frequent call features can create pull‑to‑par upside when issuers refinance at the first call. Post‑crisis capital buffers and resilient profitability support coupon sustainability and a steady call culture, improving carry reliability. Dislocations and regulatory risk premia often leave AT1 spreads wide vs. senior/RT1—creating room for outperformance if sentiment, capital ratios, or rates volatility improve.

The importance of balancing an ESG portfolio

Building a well‑diversified portfolio with a robust ESG process can improve long‑term resilience and broaden the investor base, especially among institutional allocators with sustainability mandates.
The key role of financial news

Investors need both analytical depth and speed in reacting to market‑moving news and policy announcements. Consistently reading high‑quality reports and newsflow helps anticipate paths for markets and frame timely responses.

Why should I be interested in this post?

If you are a student interested in business and finance—especially fixed income—this post offers practical, desk‑level insights: how the work is structured, the skills required, and how to grow in a markets‑focused role, based on months on the desk alongside a 15+ person team.

Conclusion

My internship at Valori AM sharpened my analytical abilities and helped me grow personally. Learning from colleagues taught me how to contribute from day one and confirmed my interest in investment management and fixed income. Looking ahead, I aim to pursue a buy‑side role at a fund or bank, focusing on portfolio strategy in financial markets.

Related posts on the SimTrade blog

   ▶ All posts about Professional experiences

   ▶ Matthieu MENAGER My professional experience as a credit analyst at Targobank

   ▶ Praduman AGRAWAL My Professional Experience as a Quantitative Analyst Intern at Findoc Financial Services

   ▶ Alexandre VERLET Classic brain teasers from real-life interviews

Useful resources

Bloomberg

International Monetary Fund (IMF)

Morningstar Sustainalytics

Valori Asset Management

About the author

The article was written in November 2025 by Roberto RESTELLI (ESSEC Business School, Master in Finance (MiF), 2025–2026).

My internship experience at Bpifrance – Finance Export Analyst

Julien MAUROY

In this article, Julien MAUROY (ESSEC Business School, Global Bachelor in Business Administration (GBBA), 2021-2025) shares his professional experience as a Finance Export Analyst at Bpifrance.

Overview of Bpifrance and Bpifrance Assurance Export

Bpifrance is France’s public investment bank. Created in 2012 to support businesses at every stage of their development, from start-up to international expansion, through financing, investment, innovation and guarantees.

Here is a chart showing the organization of Bpifrance and its entities in 2023.

Bpifrance organizational chart as of December 31st 2023.
Bpifrance organizational chart 2023
Source: the company.

Today, Bpifrance plays a major role in the French economy. In 2023, the institution supported more than 84,000 companies, mobilizing over €69 billion in financing, guarantees, investment and export support.

Bpifrance currently employs approximately 3 700 people across France, making it one of the largest public financial institutions in Europe.

Since 2017, Bpifrance Assurance Export has been managing public export guarantees on behalf of and under the control of the State (more specifically, the Treasury Department). These guarantees secure and facilitate the international operations of French companies by covering the economic and political risks associated with their export contracts.

Before 2017, the management of public export guarantees was carried out by Coface. The transfer of this activity to Bpifrance aimed at strengthening the alignment between France’s industrial policy, export strategy, and financing tools.

My experience and service

I joined this department as an Export Finance Analyst intern, working at the intersection of three departments: ASR (Administration and Risk Monitoring), ESC (Social Environment and Governance) and NTI (Internal Rating and Pricing). I had the opportunity to work with teams responsible for portfolio monitoring (€69 billion in outstanding loans and nearly 1,500 companies) and teams responsible for analysing and reviewing export insurance applications. This internship had a strong economic, strategic and geopolitical aspect, and working in collaboration with the treasury was very enriching.

Here is a chart showing the distribution of services and the managerial structure of Bpifrance.

Organization of Bpifrance.
Bpifrance network organization
Source: the company.

During this internship, my tasks were varied and demanding:

  • Participating in the analysis of the financial and non-financial situation of exporting companies and their foreign counterparts,
  • Carrying out an assignment on the credit insurance portfolio in order to better manage reporting on behalf of the Treasury Department,
  • Producing benchmarks and memos for the Treasury, participating in various committees (rating, pricing, guarantees commission).

These tasks enabled me to understand the importance of export financing and guarantees in the French economy and in supporting exporters who wish to carry out projects abroad.

Macroeconomic vision, economic diplomacy and geopolitics

Working in this context allowed me to broaden my macroeconomic vision and better understand the interactions between finance, politics and geopolitics. Analysing transactions that sometimes involved governments directly and institutional players made me aware of the challenges of sovereign risk management. I was able to observe how financial decisions are part of a foreign economic policy approach: supporting a strategic project in an emerging country or strengthening a French industrial sector.

I understood that risk analysis is not limited to reading a company’s financial statements, but requires a detailed understanding of the economic, social and political environment of the buyer or the purchasing country.

What I learnt from this experience

This internship was a rich and decisive experience in my career. It taught me to think on a macroeconomic scale and analyze risks from a strategic perspective.

I worked on sometimes complex economic issues between exporting companies and foreign buyers. I developed rigorous analytical skills and a more comprehensive understanding of the challenges of export financing and insurance in the French economy.

Finally, this immersion at the crossroads of finance, strategy and macroeconomics was fascinating. I gained a lot from it and am certain that I want to continue my career in multidimensional roles like this one.

Related posts on the SimTrade blog

   ▶ All posts about Professional experiences

   ▶ Frédéric ADAM Senior banker (coverage)

   ▶ Dawn DENG Assessing a Company’s Creditworthiness: Understanding the 5C Framework and Its Practical Applications

   ▶ AnnieY EUNG Understanding the Economics of Tariffs

Useful resources

Business

bpifrance

OECD

Direction générale du Trésor

Academic articles

Hayez S. and F. Savel (2018) Bpifrance : entreprises et territoires, Revue d’économie financière, 132(4):179-189.

Gervais F., Guillermain E., Parker D., Venin E., Wagenhausen F., Mayrhofer U., Soathan G.A., Aymard T., Meurier M. B., Varet S., Arzumanyan L. and Ph. Blesbois (2020) Module 22. La gestion du risque de crédit, Exporter – Pratique du commerce international Foucher (27th edition), 22: 332-347.

Alferdo P. (2019) Fiche 15. L’assurance-crédit export, Fiches de droit du commerce international, 215-223.

About the author

The article was written in November 2025 by Julien MAUROY (ESSEC Business School, Global Bachelor in Business Administration (GBBA), 2021-2025).

The market is never wrong, only opinions are

Hadrien PUCHE

In this article, Hadrien PUCHE (ESSEC Business School, Grande École Program, Master in Management, 2023-2027) comments on Jesse Livermore’s timeless quote and explores its relevance for modern investors and students seeking to understand market psychology.

About Jesse Livermore

Jesse Livermore (1877–1940) was one of Wall Street’s first great speculators, a man who understood the rhythm of markets long before data screens and algorithms existed. He made and lost several fortunes, most famously by shorting stocks ahead of the Panic of 1907 and the Great Depression of 1929.

Livermore’s life was both brilliant and tragic, but his insights into crowd behavior and emotional discipline remain essential reading for anyone who wishes to understand how markets truly work.

Jesse Livermore
Jesse Livermore

Analysis of the quote

“The market is never wrong, only opinions are.” – Jesse Livermore

When Livermore says, “The market is never wrong, only opinions are,” he reminds us that prices are not moral judgments or forecasts of truth — they are the product of human behavior under uncertainty.

Markets do not care about fairness or logic. They reflect the collective sum of all opinions, weighted by money. To claim that “the market is wrong” is to claim that your personal view outweighs the collective intelligence and capital of millions of other participants.

That rarely ends well. The market may sometimes overreact, but it is almost always the individual who misunderstands its message.

This quote, in the end, is a lesson in humility. Investors lose not because they lack intelligence, but because they refuse to admit when the market has proven them wrong.

Economic and financial concepts related to the quote

1 – Market efficiency

Livermore’s idea anticipates the theory of market efficiency introduced many decades later by Eugene Fama in 1970. This theory suggests that prices incorporate all available information, which means it is almost impossible to consistently beat the market.

Even if markets are not perfectly efficient, they are highly competitive ecosystems. Information spreads very quickly, and any mispricing is soon corrected by professionals equipped with technology and capital.

So when you decide that the market is wrong, you are effectively betting that your insight is sharper than everyone else’s, from hedge funds to central banks. Occasionally, some investors do have that edge, but they are the exception, not the rule.

2 – The Wisdom and the Madness of Crowds

In The Wisdom of Crowds (2004), James Surowiecki argues that large groups can make remarkably accurate collective judgments, even when individual members are biased or imperfectly informed. Financial markets often exemplify this phenomenon: while single investors are prone to emotion and error, the aggregation of their independent views can produce a consensus that efficiently reflects available information.

Yet, Surowiecki also cautions that collective intelligence breaks down when independence disappears. In markets, this occurs when participants are driven by shared emotions: panic during crashes or euphoria during bubbles. At such moments, the “wisdom” of the crowd can turn to madness.

3 – Risk management and flexibility

Livermore’s warning remains as relevant as ever: never fight the market. Every investor is wrong sometimes, but what matters is how quickly you realize it and act. The real danger isn’t being wrong, it’s refusing to admit it. Livermore’s rule captures this perfectly: “Cut your losses short and let your winners run.”

Good risk management starts there. It means knowing how much you can afford to lose, setting a stop-loss before entering a trade, and sticking to it. A stop-loss isn’t a sign of weakness, it’s a protection. It prevents small mistakes from turning into big ones and keeps you in the game for the long run.

As Keynes famously said, “Markets can stay irrational longer than you can stay solvent.” Managing risk isn’t about predicting the market, it’s about surviving it.

My opinion about this quote

Livermore’s insight feels even more relevant in today’s world of instant information and algorithmic trading. Social media multiplies opinions at unprecedented speed, creating noise that can easily obscure reality.

Recent market episodes illustrate this perfectly. In 2021, for example, the GameStop saga showed how collective emotion on Reddit briefly overwhelmed fundamental analysis, sending the stock to irrational highs before gravity reasserted itself.

Similarly, during the cryptocurrency boom of 2021 and 2022, investors often claimed that “this time is different,” only to face sharp corrections when enthusiasm faded.

Closer to home, the Atos case in 2024 reflected the same dynamic. Despite the company’s severe financial distress and an announced dilution that effectively made the stock almost worthless, waves of speculative buying pushed its valuation to absurd levels for a few days. When reality returned, the correction was brutal.

Atos stock price chart

These examples confirm Livermore’s message: opinions can be wrong for a long time, but the market always has the final word.

Why should you be interested in this post?

For students and young professionals, Livermore’s lesson is a call for intellectual humility. Markets are complex and adaptive systems, impossible to predict with precision but possible to understand with patience.

Learning to separate your opinions from what the market is telling you will make you a better analyst, investor, and decision-maker. It will also help you develop emotional intelligence, a skill far rarer than technical knowledge.

In finance, as in life, the goal is not to be right, it is to adapt faster when you are wrong.

Related posts on the SimTrade blog

   ▶ All posts about Quotes

Useful resources

Reminiscences of a Stock Operator – Edwin Lefèvre (1923)

The Efficient Market Hypothesis and Its Critics – Burton Malkiel (2003)

Thinking, Fast and Slow – Daniel Kahneman (2011)

SimTrade course Market information

Academic research

Fama E. (1970) Efficient Capital Markets: A Review of Theory and Empirical Work, Journal of Finance, 25, 383–417.

Fama E. (1991) Efficient Capital Markets: II, Journal of Finance, 46, 1575–617.

Grossman S.J. and J.E. Stiglitz (1980) On the Impossibility of Informationally Efficient Markets, The American Economic Review, 70, 393–408.

Chicago Booth Review (30/06/2016) Are markets efficient? Debate between Eugene Fama and Richard Thaler (YouTube video)

About the author

This article was written in November 2025 by Hadrien PUCHE (ESSEC, Grande École Program, Master in Management – 2023–2027).

Don’t look for the needle in the haystack. Just buy the haystack.

Hadrien PUCHEOver the past decade, investing has become more accessible than ever. Anyone with a smartphone can now buy or sell shares, cryptocurrencies, or ETFs within seconds. While this democratization of finance has clear benefits, it has also led many to lose money by chasing “the next big stock.” Retail investors often believe they can find the next Tesla or Nvidia: the famous “needle in the haystack.” Yet, as history repeatedly shows, only a small fraction succeed.

That is precisely what John C. Bogle, the founder of Vanguard and the father of index investing, warned against. His advice was simple yet profound: stop trying to find the needle, just buy the entire haystack.

In this article, Hadrien PUCHE (ESSEC Business School, Grande École Program, Master in Management, 2023-2027) comments on Bogle’s timeless quote, exploring how it captures one of the most important principles in modern investing: diversification.

About John C. Bogle

John Clifton Bogle (1929 – 2019) was an American investor and philanthropist best known as the founder of The Vanguard Group, one of the world’s largest asset management firms. In 1976, Bogle created the first index fund available to individual investors, the Vanguard 500 Index Fund, designed to replicate the performance of the S&P 500 index rather than beat it.

At the time, his idea was revolutionary. The prevailing belief was that skilled managers could consistently outperform the market through superior stock selection and market timing. Bogle argued the opposite: after accounting for management fees, transaction costs, and human error, most active managers fail to beat the market over the long term. His philosophy emphasized simplicity, discipline, and cost-efficiency, principles that now underpin the $12 trillion global index fund industry.

John C. Bogle
John Bogle

Analysis of the quote

Bogle’s quote encapsulates a powerful truth: successful investing does not require finding hidden gems, but rather owning the market as a whole. The “needle in the haystack” represents the elusive high-performing stock every investor dreams of. Yet statistically, most attempts to find it fail. By buying the entire “haystack” (that is, the full market) investors automatically own all the winners and minimize the risk of missing them.

Empirical research overwhelmingly supports this idea. Over time, a small number of stocks account for the majority of total market gains. A study by Hendrik Bessembinder (2018) found that, since 1926, just 4% of U.S. stocks generated the entire net wealth created by the stock market. Most others either underperformed or disappeared entirely. Thus, identifying the few long-term winners ex ante is nearly impossible. The rational solution is to own the entire market, a strategy that index funds make accessible and affordable.

Bogle’s insight also reflects humility: acknowledging that even professionals struggle to outperform broad market indexes. By accepting this, investors shift their focus from beating the market to participating in its long-term growth.

Financial concepts related to the quote

I present below three fiancial concepts: diversification, index funds, and the efficient portfolio frontier.

Diversification

Diversification is the cornerstone of modern portfolio theory. It refers to spreading investments across different assets or sectors to reduce risk. By owning a broad range of companies, an investor limits the impact of any single firm’s poor performance.

Bogle’s philosophy embodies this principle. Buying the entire market, through an index fund tracking, for example, the S&P 500 or the CAC 40, ensures exposure to hundreds of firms across multiple sectors. The failure of one or two is offset by the success of others.

In practice, diversification improves a portfolio’s risk-adjusted return. It does not eliminate risk entirely but reduces idiosyncratic risk (the risk specific to individual companies). What remains is systematic risk, which affects the entire market and cannot be diversified away. This relationship is evident when observing how portfolio risk declines as the number of securities increases.

 Risk of a portfolio as a function of the number of assets

Index funds

Index funds are collective investment vehicles that aim to replicate the performance of a specific market index, such as the S&P 500 (U.S.), the MSCI World (Global), or the CAC 40 (France). They hold the same securities as the index, in the same proportions, ensuring the fund’s return closely matches that of the benchmark. Because they are passively managed, index funds have very low management fees (often 10 to 20 times cheaper than traditional mutual funds). They also provide instant diversification: by buying one share of an S&P 500 ETF, you effectively invest in 500 companies.

This simplicity explains their rapid growth. According to Morningstar, index funds and ETFs now represent more than 50% of all U.S. equity fund assets. Their accessibility and transparency have fundamentally reshaped global investing.

However, one subtle limitation is that most major indexes are market-cap weighted, meaning the largest companies exert the greatest influence. As of 2025, the “Magnificent 7” (Tesla, Nvidia, Apple, Microsoft, Alphabet, Meta, and Amazon) represent nearly 35% of the index’s total value. The chart below illustrates their growing share of total market capitalization over time, highlighting how even “diversified” investors are increasingly concentrated in a handful of mega-cap technology firms.

 Market capitalization of the Magnificent 7 as a share of index total

The efficient portfolio frontier

Introduced by Harry Markowitz in 1952, the efficient frontier illustrates the optimal trade-off between risk and (expected) return for a diversified portfolio. Each point on the curve represents the best possible expected return for a given level of risk.

Efficient frontier graph

Index investing often lies near this efficient frontier. Because broad indexes like the S&P 500 already aggregate thousands of investors’ information and preferences, they effectively represent a “market portfolio” close to the optimal mix. Passive investors benefit from this efficiency without needing to forecast which assets will outperform.

Understanding the efficient frontier also reveals why chasing high returns through concentrated bets is dangerous. While such strategies may yield spectacular results occasionally, they almost always involve disproportionate risk.

My opinion about this quote

I believe this quote perfectly captures the essence of modern investing: simplicity often outperforms sophistication. Many individuals (and professionals) spend enormous time and money trying to beat the market, often with limited success. The SPIVA (S&P Indices Versus Active) report consistently shows that the majority of actively managed funds underperform their benchmark indexes over the long term. As of 2024, for instance, more than 85% of U.S. equity funds lagged the S&P 500 over a 10-year period.

The chart below illustrates this trend across different investment horizons, showing that the longer the time frame, the harder it becomes for active managers to outperform their benchmarks.

Most US equities fund managers fail at outperforming the S&P500 index

The reasons are clear: high management fees, excessive trading, and the psychological pressure to deliver short-term results. Fund managers often prioritize annual bonuses over long-term compounding, leading to decisions driven by incentives rather than rational analysis.

At the same time, Bogle’s approach is not entirely without nuance. Index funds may appear perfectly diversified, but as noted earlier, their concentration risk has increased with the rise of mega-cap tech firms. Buying “the market” today means owning a portfolio dominated by a handful of giants. That, too, is an investment choice, one that has worked well recently but may not always hold true.

Therefore, the essence of Bogle’s wisdom is not that index investing is flawless, but that it is rational. It reflects humility, an understanding that long-term success comes not from prediction, but from participation, discipline, and patience.

Why should you be interested in this post?

For students and young professionals, this quote offers two critical lessons.

First, from a personal investing perspective, it highlights the power of simplicity. Investing through low-cost index funds allows anyone, regardless of expertise, to participate in long-term market growth without the stress of constant stock-picking. It is a proven strategy for building wealth steadily over time.

Second, from a professional standpoint, understanding how and why index funds dominate modern markets is essential. Whether you aim to work in asset management, corporate finance, or risk consulting, you must grasp how passive investing shapes market dynamics, liquidity, and valuation.

Ultimately, Bogle’s message goes beyond finance. It teaches intellectual humility: the recognition that long-term discipline often triumphs over short-term brilliance.

Related posts on the SimTrade blog

   ▶ All posts about Quotes

Useful resources

Vanguard official website

Bessembinder, H. (2018). Do Stocks Outperform Treasury Bills? Journal of Financial Economics.

SPIVA U.S. Scorecard (2024)

Markowitz, H. (1952). Portfolio Selection. Journal of Finance.

Bogle, J. C. (2017). The Little Book of Common Sense Investing.

About the Author

The article was written in November 2025 by Hadrien PUCHE (ESSEC Business School, Grande École Program, Master in Management, 2023-2027).

Book by Slah Boughattas: State of the Art in Structured Products

Slah Boughattas

In this post, Slah BOUGHATTAS (Ph.D., Associate of the Chartered Institute for Securities & Investment (CISI), London) provides an extract from the book ‘State of the Art in Structured Products: Fundamentals, Designing, Pricing, and Hedging’ (2022).

This post presents pedagogical philosophy, structure, and target audience, including graduate students in finance, university professors, and practitioners in derivatives and structured products.

State of the Art in Structured Products: Fundamentals, Designing, Pricing, and Hedging
 State of the Art in Structured Products: Fundamentals, Designing, Pricing, and Hedging
Source: the company.

Summary of the book

The book aims to provide both the theoretical background and the practical applications of structured products in modern financial markets. It systematically explores the fundamentals of derivatives, equity and interest rate markets, stochastic calculus, Monte Carlo simulations, Constant Proportion Portfolio Insurance (CPPI), risk management, and the financial engineering processes involved in designing, pricing, and hedging structured products.

Financial concepts related to the book

Structured Products, Derivatives, Options, Swaps, Structured Notes, Bonus certificates, Constant Proportion Portfolio Insurance (CPPI), Monte Carlo Simulation, Fixed Income, Floating Rate-Note (FRN), Reverse FRN, CMS-Linked Notes, Callable Bond, Financial Engineering, Risk Management, Pricing, and Hedging.

Context and Motivation

The financial engineering of structured products remains one of the most sophisticated domains of quantitative finance. While the literature on derivatives pricing is vast, comprehensive references specifically dedicated to the end-to-end process of structured product creation — designing, pricing, and hedging — remain scarce.

State of the Art in Structured Products bridges this gap. The work is structured to serve both as a teaching manual and a professional reference, progressively building from fundamental principles to advanced practical implementations.

Structure of the Book

  • Derivatives Fundamentals and Market Instruments – recalls the essential mechanics of equity and interest-rate derivatives
  • Designing Structured Products – shows how term sheets and payoff structures emerge logically from financial objectives
  • Pricing and Risk Analysis – provides analytical and simulation-based approaches, including Monte Carlo method
  • Hedging and Risk Management – explores dynamic replication, sensitivities, and practical hedging of structured notes.
  • Advanced Topics – covers Constant Proportion Portfolio Insurance (CPPI), callable and floating-rate instruments, and swaptions

Why should I be interested in this post?

The book’s main contribution lies in its integrated approach combining conceptual clarity, quantitative rigor, and practical implementation examples. It is intended for professors and instructors of Master’s programs in Finance, graduate students specializing in derivatives or structured products, and professionals such as financial engineers, product controllers, traders, dealing room staff and salespeople, risk managers, quantitative analysts, middle office managers, fund managers, investors, senior managers, research and system developers.

The book is currently referenced in several academic libraries, including ESSEC Business School Paris, Princeton University, London School of Economics, HEC Montreal, Erasmus University Rotterdam, ETH Zurich, IE University, Erasmus University Rotterdam, and NTU Singapore.

Related posts on the SimTrade blog

   ▶ Mahé FERRET Selling Structured Products in France

   ▶ Akshit GUPTA Equity Structured Products

   ▶ Youssef LOURAOUI Interest rate term structure and yield curve calibration

   ▶ Jayati WALIA Brownian Motion in Finance

   ▶ Shengyu ZHENG Capital Guaranteed Products

   ▶ Shengyu ZHENG Reverse Convertibles

Useful resources

Slah Boughattas (2022) State of the Art in Structured Products: Fundamentals, Designing, Pricing, and Hedging Advanced Education in Financial Engineering Editions.

About the author

The article was written in November 2025 by Slah BOUGHATTAS (Ph.D., Associate of the Chartered Institute for Securities & Investment (CISI), London).

Remember that time is money

Hadrien PUCHE

Turning one euro into a billion euros is the simplest thing in the world. All you need is one euro – and a nearly infinite amount of time.

In this article, Hadrien PUCHE (ESSEC Business School, Grande École Program, Master in Management, 2023-2027) comments on Benjamin Franklin’s famous quote and explores why treating time as both a scarce resource and a wealth multiplier can radically improve your productivity, your mindset, and your financial outcomes.

About Benjamin Franklin

Benjamin Franklin (1706-1790) was one of the founding fathers of the United States. Beyond politics, he was also a scientist, inventor, writer, and, more relevantly here, an economist.

Benjamin Franklin
Portrait Benjamin Franklin by Joseph Siffrein Duplessis
Source: portrait by Joseph Siffrein Duplessis

About the quote

The aphorism ‘Time is money’ comes from his 1748 essay Advice to a Young Tradesman. In it, Franklin advises working men to use their hours wisely in order to maximize the productivity of their labor. Remarkably, this 18th century advice remains more relevant than ever in the modern age of finance and personal efficiency.

Another modern interpretation relates to financial investments: the more time you leave capital to grow via interest, the higher its accumulated value. Time literally multiplies money through compounding.

To my Friend A. B.
As you have desired it of me, I write the following Hints, which have been of Service to me, and may, if observed, be so to you.
Remember that Time is Money. He that can earn Ten Shillings a Day by his Labour, and goes abroad, or sits idle one half of that Day, tho’ he spends but Sixpence during his Diversion or Idleness, ought not to reckon That the only Expence; he has really spent or rather thrown away Five Shillings besides.

Analysis of the quote

Franklin’s phrase can be interpreted on several levels. Fundamentally, it highlights that time is a limited resource and money is a stored form of that time. Think of money as a stock, and time as the flow that feeds it.

Every euro you earn is, in essence, a small unit of your time and effort converted into a convenient medium of exchange. You trade your own work hours for money, and later spend this money to buy someone else’s time and effort — the chef who prepared your lunch or the engineer who built your car.

While you can always earn back money, you can never regain lost time. Time is therefore much scarcer, and ultimately more valuable. Treating it with the same discipline as any limited resource can transform the way you approach productivity, work, and value creation.

You should also aim at buying back your time whenever possible. Whether through automation, delegation, or investing, let your capital work for you and use the proceeds to buy back your own time. In the end, true wealth is measured by how much time you can recover.

Economic and financial concepts related to this quote

The time value of money

The time value of money (TVM) is one of the most important concepts in finance: a euro today is worth more than a euro tomorrow.

Reasons:

  • People are risk averse and prefer present consumption over future consumption.
  • Inflation erodes purchasing power over time.
  • Money today can be invested to earn interest.

If you lend 100 euros today and only get back 100 euros next year, you’ve lost value. Lenders charge interest to compensate, even before accounting for default risk. This principle underpins most of modern finance.

The formula below gives the relation between the present value (PV) and the future value (FV).

Formula to link PV (Present Value) and FV (Future Value)

where r is the discount or compounding rate and 𝑡 t is time.

The opportunity cost

Opportunity cost reminds us that inaction carries a cost. By not investing your time or capital, you miss potential returns.

Example: €1,000 idle in a bank account for one year:

  • Lend it at 5% and earn €50.
  • Do nothing and earn €0.

The opportunity cost is €50. This principle extends beyond finance: career, education, or hobbies — always evaluate what you forgo by not choosing the alternative.

Discounting and compounding

Money grows over time through compounding, and its future value can be discounted to present value. These mechanisms allow investors to determine how much a future cash flow is worth today.

Compounding: earnings generate additional earnings over time, as interest accrues on interest. The longer the investment, the faster growth accelerates.

Example: €10,000 invested at 7% annually yields:

  • €19,671 after 10 years
  • €76,123 after 30 years
  • €294,570 after 50 years

Discounting: brings future sums back to present value, reflecting that a euro today is worth more than a euro tomorrow.

Together, compounding and discounting illustrate the fundamental relationship between time and value: time itself can create, or erode, wealth (when we consider the future or the present).

The figure below represents the impact of time on the value of an investment with simple and compound interests.

Graph showing how compounded interest works
Source : The author

You can download the Excel below to study the impact of time on money.

Download the Excel file to learn more about simple and compound interests

My opinion about this quote

This quote is especially relevant today — many forget that just as time is money, money is also time. We exchange time for money and spend money to access others’ time, often without reflection.

Example: buying a risotto at a restaurant — you pay not only for the food, but for the time of the chef, farmer, and delivery staff, who contributed hours of their lives for your convenience.

Franklin also reminds us of productivity: in many professions, including finance, people work long hours with diminishing returns. Working more isn’t the same as working efficiently; the challenge is maximizing value per unit of time.

Why should you be interested in this post?

Understanding the dual nature of time (scarce resource and wealth multiplier) is key for personal, professional, and financial success.

Whether investing, studying finance, building a business, or learning a skill, remember: every hour counts and starting early amplifies returns.

  • Allocate your time wisely.
  • Invest your time strategically.
  • Let both your time and capital work for you.

Related posts on the SimTrade blog

   ▶ All posts about Quotes

   ▶ How to compute the present value of an asset

   ▶ Understanding discount rate : a key concept in finance

Useful resources

Benjamin Franklin (1748) Advice to a Young Tradesman.

Morgan Housel (2020) The Psychology of Money.

Aswath Damodaran Time Value of Money (Aswath Damodaran) NYU Stern – Foundations of Finance Course.

About the Author

This article was written in October 2025 by Hadrien PUCHE (ESSEC Business School, Grande École Program, Master in Management – 2023-2027).

Top 5 companies in the defense sector

Nithisha CHALLA

In this article, Nithisha CHALLA (ESSEC Business School, Grande Ecole Program – Master in Management (MiM), 2021-2024) delves into the top five companies in the defense sector by market capitalization and provides information into their origins, latest announcements, and notable developments to provide financial professionals and students with actionable insights.

Introduction: The Global Defense Landscape

In the 2020s, the global defense industry is undergoing a period of profound and structural transformation. A confluence of escalating geopolitical tensions, rapid technological advancement, and a fundamental reassessment of national security priorities has catalyzed an unprecedented surge in military spending. In 2024, global military expenditure reached an astonishing $2.718 trillion, marking a 9.4% year-on-year increase—the steepest rise recorded since at least 1988. This marks the tenth consecutive year of rising expenditures, signaling a definitive end to the post-Cold War “peace dividend” and the dawn of a new era of sustained, high-level investment in great power competition.

This spending surge is not a monolithic trend but is driven by specific, interlocking security challenges. The protracted conflict in Ukraine has compelled NATO allies to not only replenish stockpiles of munitions and equipment but also to fundamentally modernize their forces for high-intensity conventional warfare. Concurrently, persistent instability in the Middle East and rising strategic competition in the Indo-Pacific are fueling demand for advanced capabilities across all domains. This has created a demand environment of a scale and duration not seen in decades, providing the world’s leading defense contractors with unparalleled long-term revenue visibility.

The modern technological battlefield is also evolving at a breakneck pace. The key domains driving research, development, and procurement have shifted to areas such as hypersonic weapons, artificial intelligence (AI) for command and control, cyber and electronic warfare, autonomous systems, and space-based intelligence and communications assets. These technologies represent the future of warfare and are central to the corporate strategies and investment priorities of the industry’s top firms. The defense industrial base is a unique ecosystem characterized by multi-decade program cycles, exceptionally high technological and capital barriers to entry, and a deeply symbiotic relationship with a concentrated customer base, dominated by the U.S. Department of Defense (DoD) and allied governments.

This report provides a detailed financial and strategic analysis of the five largest defense contractors in the world. These firms are ranked based on their most recent full-year defense-related revenue, the most direct and relevant metric for assessing their scale and influence within the sector. This primary ranking is augmented by an examination of total revenue, market capitalization, and crucially, the size and composition of their order backlogs, which serve as a key indicator of future financial performance.

The picture below shows the world’s top 5 valuable defense companies by market capitalization (Companies Market Cap, August 2025).

World’s top 5 valuable companies by market capitalization in the defense industry
World’s top 5 valuable companies by market capitalization in defense industry
Source: Companies Market Cap.

The market capitalization, commonly called a “market cap”, is the total market value of a publicly traded company’s outstanding shares and is widely used to measure how much a company is worth. In most cases, it can be easily calculated by multiplying the share price by the amount of outstanding shares.

Lockheed Martin Corporation (LMT)

Lockheed Martin Corporation is the world’s largest defense contractor, a global security and aerospace giant with a legacy of pioneering advanced military technology. The modern corporation was formed in 1995 through the merger of two of America’s largest defense firms, Lockheed Corporation and Martin Marietta, creating an entity with unparalleled scale and a comprehensive portfolio. Headquartered in Bethesda, Maryland, the company is led by Chairman, President, and CEO James D. Taiclet, a former U.S. Air Force officer who brings a deep understanding of the company’s primary customer.

Lockheed Martin’s operations are organized into four core business segments, each a leader in its respective domain: Aeronautics, Rotary and Mission Systems (RMS), Missiles and Fire Control (MFC), and Space.

  • Aeronautics: This is the company’s largest segment, accounting for approximately 41% of total revenue in fiscal year 2023 with sales of $27.5 billion. It is the home of the F-35 Lightning II, the cornerstone of modern air power for the U.S. and its allies. The segment also produces the C-130 Hercules transport aircraft and houses the legendary Skunk Works® advanced development division, responsible for iconic aircraft like the U-2 and SR-71 Blackbird.
  • Rotary and Mission Systems (RMS): Generating 24% of revenue ($16.2 billion), this segment includes Sikorsky helicopters, the manufacturer of the ubiquitous UH-60 Black Hawk. It is also a leader in naval systems, producing the Aegis Combat System, ship-based missile defense systems, and advanced radar technologies.
  • Missiles and Fire Control (MFC): This segment, with 17% of revenue ($11.3 billion), is a premier provider of precision engagement systems. Its portfolio includes the High Mobility Artillery Rocket System (HIMARS), the Javelin anti-tank missile, and cutting-edge hypersonic weapons programs.
  • Space: Accounting for 19% of revenue ($12.6 billion), the Space segment is a critical player in national security, developing and producing satellites for communications and missile warning, space transportation systems, and strategic defensive systems.

The F-35 program is the central pillar of Lockheed Martin’s financial and strategic position. It is far more than a simple product line; it represents a multi-decade, global platform that has created an entire ecosystem of revenue streams. The initial sale of each aircraft is merely the entry point into a long-term relationship that generates recurring, high-margin revenue from sustainment, software and hardware upgrades, pilot training, and spare parts for the next 30 to 50 years. As more allied nations join the F-35 program, it creates a powerful network effect, fostering interoperability and effectively locking out competitors for a generation. This transforms the F-35 from a manufacturing program into a long-term service annuity that underpins the company’s entire financial structure.

Logo of Lockheed Martin Corporation
 Logo of Lockheed Martin Corporation
Source: the company.

Lockheed Martin’s recent financial performance reflects both the strength of its portfolio and the inherent risks of large-scale development programs. In the second quarter of 2025, the company reported sales of $18.2 billion. However, this was overshadowed by the recognition of $1.8 billion in losses on several legacy and classified programs, which prompted a downward revision of its full-year 2025 earnings per share (EPS) guidance.

Despite these challenges, the company’s future revenue is secured by an immense order backlog, which stood at a record $166.5 billion as of June 30, 2025. This massive backlog provides exceptional visibility into future sales but also highlights the company’s exposure to execution risk on complex, fixed-price development contracts. The company continues to secure major contracts, including a recent $900.5 million award for Javelin missile production and a $720 million contract for Joint Air-to-Ground Missiles (JAGM) and HELLFIRE missiles.

The picture below shows the market capitalization history of Lockheed Martin Corporation from 1996 to 2025.

Market cap history of Lockheed Martin Corporation from 1996 to 2025
Source: Companies Market Cap.

The picture below shows the stock price history of Lockheed Martin Corporation from 1970 to 2025.

Stock price history of Lockheed Martin Corporation from 1970 to 2025
Source: Companies Market Cap.

Lockheed Martin’s strategy is centered on its “21st Century Security” vision, which prioritizes investment in high-growth areas critical to modern warfare, such as hypersonics, integrated air and missile defense, and Joint All-Domain Operations (JADO). The company is positioned to be a prime beneficiary of the DoD’s modernization priorities. Financial analysts currently hold a consensus “Hold” rating on the stock, with 12-month price targets ranging from approximately $425 to $590, reflecting both the company’s strong market position and concerns over recent program charges and execution risk.

RTX Corporation (RTX)

RTX Corporation was forged into its current form through the colossal 2020 merger of Raytheon Company, a leader in defense electronics and missiles, and United Technologies Corporation, a powerhouse in aerospace systems and engines. This transaction created a new type of defense prime: an integrated technology company with a balanced portfolio spanning both defense and commercial aerospace. The company, led by Chairman and CEO Christopher T. Calio, is a leader in developing and manufacturing some of the most advanced technology systems in the world.

RTX operates through three highly complementary business segments that provide a broad range of products and services : Collins Aerospace, Pratt & Whitney, and Raytheon

  • Collins Aerospace: This segment is a top-tier supplier of technologically advanced aerospace and defense products. Its portfolio includes everything from aerostructures and avionics to mission systems and power controls for a vast array of commercial and military aircraft.
  • Pratt & Whitney: One of the world’s foremost manufacturers of aircraft engines, Pratt & Whitney supplies propulsion systems for commercial airliners (including the Geared Turbofan™ engine for the Airbus A320neo family), military fighter jets (such as the F135 engine for the F-35), and business jets.
  • Raytheon: This segment is the core of RTX’s defense offerings and a global leader in sensing, effects, and command and control solutions. It is the world’s largest producer of guided missiles and is renowned for its integrated air and missile defense systems, particularly the Patriot system, as well as advanced radars and precision weapons.

The strategic rationale of the merger is evident in this structure. The combination of Raytheon’s defense technologies with the aerospace systems of Collins and Pratt & Whitney allows RTX to offer more integrated solutions and benefit from technology synergies across its portfolio. The current geopolitical climate, with its emphasis on replenishing munitions and bolstering air and missile defense capabilities, has placed RTX’s Raytheon segment in an exceptionally strong position. Systems like the Patriot, AMRAAM, and Stinger missiles are in high demand globally, a direct consequence of the war in Ukraine and rising tensions elsewhere. Unlike long-cycle platforms such as aircraft carriers, these systems are being consumed in active conflicts and require rapid, high-volume replenishment. This creates a high-velocity, high-margin revenue cycle that the market has recognized, affording RTX a premium valuation relative to many of its peers.

Logo of RTX
 Logo of RTX
Source: the company.

RTX’s financial results demonstrate the strength of its balanced portfolio. In the second quarter of 2025, the company reported sales of $21.6 billion, an increase of 9% on an organic basis, with adjusted EPS rising 11% to $1.56. The performance was driven by strong growth in the commercial aftermarket as air travel continues to recover, alongside robust demand in the defense segments.

The company’s future is underpinned by the largest backlog in the industry, which stood at a staggering $236 billion at the end of Q2 2025. This backlog is well-balanced, comprising $144 billion in commercial aerospace orders and $92 billion in defense orders, providing multi-year revenue visibility. RTX continues to win significant contracts, including a landmark $50 billion, 20-year umbrella contract with the U.S. Defense Logistics Agency to provide a wide range of systems, spare parts, and support services across the DoD.

The picture below shows the market capitalization history of RTX Corporation from 1996 to 2025.

Market cap history of RTX Corporation from 1996 to 2025
Source: Companies Market Cap.

The picture below shows the Stock price history of RTX Corporation from 1970 to 2025.

Stock price history of RTX Corporation from 1970 to 2025
Source: Companies Market Cap.

RTX is uniquely positioned to capitalize on dual tailwinds: the long-term growth of global commercial aviation and the structural increase in global defense spending. The company’s strategy focuses on leveraging its vast technology portfolio to deliver innovative solutions in areas like connected battlespace and advanced propulsion. Wall Street analysts hold a consensus “Buy” rating for the stock, with 12-month price targets generally ranging from $150 to $200, reflecting confidence in the company’s strong market position and growth prospects.

Northrop Grumman Corporation (NOC)

Northrop Grumman Corporation has a storied history of pushing the boundaries of aerospace and defense technology, particularly in the realm of advanced aircraft and stealth capabilities. The modern company was formed in 1994 through the acquisition of Grumman Corporation by Northrop Corporation, bringing together the creators of the F-14 Tomcat and the B-2 Spirit stealth bomber. Under the leadership of Chair, CEO, and President Kathy Warden, Northrop Grumman has solidified its position as a technology-first company focused on delivering innovative systems for air, space, cyber, and sea domains.

Northrop Grumman’s business is organized into four technology-driven sectors : Aeronautics Systems, Space Systems, Mission Systems, and Defense Systems

  • Aeronautics Systems: Generating $12.0 billion in revenue in fiscal year 2024, this segment is at the forefront of military aviation. Its flagship program is the B-21 Raider, the next-generation stealth bomber for the U.S. Air Force. It also produces autonomous systems like the Global Hawk surveillance drone and is a major subcontractor on the F-35 program.
  • Space Systems: A major growth engine for the company, this segment ($11.7 billion in revenue) is a leading provider of satellites, launch vehicles, and missile defense systems. It is also the prime contractor for the Sentinel program, the replacement for the Minuteman III Intercontinental Ballistic Missile (ICBM) system.
  • Mission Systems: With $11.4 billion in revenue, this segment is a leader in advanced radars, sensors, and cyber and electronic warfare systems. It provides the critical “eyes and ears” for a wide range of platforms.
  • Defense Systems: This segment ($8.6 billion in revenue) focuses on battle management, command and control systems, and precision weapons, delivering integrated solutions to enhance mission readiness.

Northrop Grumman’s portfolio is uniquely concentrated in the most advanced, highest-priority, and often most secretive areas of U.S. defense strategy. The B-21 Raider and the Sentinel ICBM programs are the two cornerstones of the modernization of the U.S. nuclear triad, making them programs of paramount national importance that are highly insulated from budget pressures. This gives the company a powerful, often sole-source, position on franchises that will generate revenue for decades. However, this strategic focus on the technological frontier also carries significant execution risk. Developing unprecedented capabilities on fixed-price contracts, as seen with the recent loss provision on the B-21’s low-rate initial production (LRIP) phase, can lead to substantial financial charges. An investment in Northrop Grumman is therefore a bet on its unique technological supremacy and its ability to navigate the immense complexity and risk inherent in pioneering the future of defense.

Logo of Northrop Grumman
 Logo of Northrop Grumman
Source: the company.

The company’s recent financial results reflect this dual reality of strong demand and program-specific challenges. In the second quarter of 2025, Northrop Grumman reported sales of $10.4 billion, a 1% increase year-over-year. However, net earnings were impacted by a significant loss provision on the B-21 program.

Despite this, demand for the company’s products remains exceptionally strong. Northrop Grumman ended the first quarter of 2025 with a record order backlog of $92.8 billion, driven by large awards for restricted programs in its space and aeronautics segments. Recent major contracts include an $801 million indefinite-delivery/indefinite-quantity (IDIQ) award for combat air forces distributed mission operations services and a $39 million contract for electronic warfare support.

The picture below shows the market capitalization history of Northrop Grumman Corporation from 1996 to 2025.

Market cap history of Northrop Grumman Corporation from 1996 to 2025.
Source: Companies Market Cap.

The picture below shows the Stock price history of Northrop Grumman from 1981 to 2025.

Stock price history of Northrop Grumman from 1981 to 2025
Source: Companies Market Cap.

Northrop Grumman’s strategic future is inextricably linked to its successful execution of the nation’s most critical defense modernization programs. Its leadership in stealth, space, and strategic deterrence positions it at the heart of the Pentagon’s long-term investment strategy. The financial analyst community maintains a consensus “Buy” rating on the stock, with an average 12-month price target of approximately $613, indicating confidence in the long-term value of its unique portfolio despite near-term program risks.

General Dynamics Corporation (GD)

General Dynamics Corporation has one of the longest and most distinguished histories in the defense industry, with roots tracing back to the Holland Torpedo Boat Company in 1899, which built the U.S. Navy’s first modern submarines. Incorporated in its modern form in 1952, the company has evolved into a global aerospace and defense powerhouse with a uniquely diversified portfolio. Under the leadership of Chairman and CEO Phebe Novakovic, General Dynamics is renowned for its relentless focus on operational excellence and strong cash generation.

General Dynamics’ strength lies in its balanced portfolio of four distinct business groups, which includes a world-class commercial business alongside its core defense franchises : Aerospace, Marine Systems, Combat Systems, and Technologies.

  • Aerospace: This segment is home to Gulfstream Aerospace, the undisputed leader in the large-cabin, long-range business jet market. Gulfstream aircraft are synonymous with performance, luxury, and technological innovation.
  • Marine Systems: This segment is a cornerstone of the U.S. naval industrial base. Through its Electric Boat and Bath Iron Works shipyards, General Dynamics is the prime contractor for the nation’s most critical naval platforms, including Virginia-class attack submarines, the next-generation Columbia-class ballistic missile submarines, and Arleigh Burke-class destroyers.
  • Combat Systems: A global leader in land combat vehicles, this segment produces the Abrams main battle tank, the Stryker family of wheeled combat vehicles, and a wide range of weapons systems and munitions.
  • Technologies: This segment provides a broad array of mission-critical information technology (IT) services, C4ISR (Command, Control, Communications, Computers, Intelligence, Surveillance, and Reconnaissance) solutions, and mobile communication systems to defense, intelligence, and federal civilian customers.

This unique corporate structure, which pairs a top-tier commercial business with indispensable defense franchises, creates a remarkably resilient business model. The market for Gulfstream business jets is tied to corporate profitability and global wealth creation, while the defense segments are driven by government budgets and the geopolitical security environment. These cycles are not perfectly correlated, allowing the segments to provide a natural hedge for one another. This diversification provides a level of earnings stability that is unique among the top defense primes, smoothing out the cyclicality inherent in both markets.

Logo of General Dynamics
 Logo of General Dynamics
Source: the company.

General Dynamics’ recent financial results highlight the strength of this diversified model. In the second quarter of 2025, the company reported strong earnings of $3.74 per share, beating analyst consensus estimates, with robust revenue growth driven by the Marine Systems segment.

The company’s future revenue is secured by a record-breaking order backlog, which surged to $103.7 billion at the end of Q2 2025, a 14% increase from the prior year. This growth was fueled by major, multi-year contracts for Virginia-class submarine construction. The company continues to win significant contracts across its portfolio, including a $5.57 billion contract for mission partner environment services and a $335 million award for submarine fire control systems.

The picture below shows the market capitalization history of General Dynamics Corporation from 1996 to 2025.

Market cap history of General Dynamics Corporation from 1996 to 2025.
Source: Companies Market Cap.

The picture below shows the Stock price history of General Dynamics from 1970 to 2025.

Stock price history of General Dynamics from 1970 to 2025
Source: Companies Market Cap.

General Dynamics’ strategy is focused on operational execution and disciplined capital deployment. The company is making significant capital investments in its shipyards to support the U.S. Navy’s multi-decade shipbuilding plan while simultaneously investing in the development of the next generation of Gulfstream aircraft. Analysts hold a consensus “Buy” rating on the stock, with an average 12-month price target of approximately $325, reflecting confidence in the company’s strong execution, massive backlog, and balanced business model.

The Boeing Company – Defense, Space & Security (BDS)

The Boeing Company, founded by William Boeing in 1916, is one of the most iconic names in aerospace history. While best known for its commercial airliners, its Defense, Space & Security (BDS) unit is a formidable global enterprise in its own right. BDS is a leading developer and manufacturer of military aircraft, satellites, weapons, and space exploration systems, serving as a critical partner to the U.S. government and international allies.

The BDS portfolio is vast and covers nearly every aspect of military aerospace and space operations : Military Aircraft, Space and Launch, and Weapons and Systems.

  • Military Aircraft: BDS produces a wide range of combat, transport, and special mission aircraft. Key platforms include the F/A-18 Super Hornet and F-15EX Eagle II fighter jets, the P-8 Poseidon maritime patrol aircraft, the KC-46 Pegasus aerial refueling tanker, and the AH-64 Apache attack helicopter.
  • Space and Launch: This division is responsible for government and commercial satellites, the Space Launch System (SLS) rocket that powers NASA’s Artemis missions, and the CST-100 Starliner commercial crew vehicle.
  • Weapons and Systems: BDS also develops and produces a variety of munitions and integrated systems, contributing to missile defense and other critical capabilities.

In the context of the broader Boeing enterprise, the Defense, Space & Security segment plays a crucial role as a stabilizing force. While the much larger Commercial Airplanes division has faced significant operational turmoil and financial volatility in recent years, BDS provides a steady and predictable stream of revenue and cash flow backed by long-term government contracts. While the BDS backlog of approximately $62 billion is dwarfed by the commercial backlog, its profitability is more consistent and less susceptible to the extreme cyclicality of the airline industry. This makes BDS a critical, though often overlooked, pillar of the overall Boeing investment case, providing a financial buffer that allows the commercial side to navigate its ongoing recover.

Logo of Boeing
 Logo of Boeing
Source: the company.

Boeing’s overall financial results have been on an improving trajectory. For the second quarter of 2025, the parent company reported a 35% year-over-year increase in revenue to $22.75 billion, although it still posted a net loss. The BDS segment contributed $6.61 billion in revenue for the quarter.

The total company backlog is a massive $619 billion, overwhelmingly dominated by orders for commercial aircraft. The BDS backlog stood at $61.57 billion at the end of the first quarter of 2025, providing solid near-term revenue visibility. BDS continues to secure important contracts, such as a recent $2.39 billion award for 15 KC-46A tanker aircraft for the U.S. Air Force.

The picture below shows the market capitalization history of Boeing from 1996 to 2025.

Market cap history of Boeing from 1996 to 2025
Source: Companies Market Cap.

The picture below shows the stock price history of Boeing from 1970 to 2025.

Stock price history of Boeing from 1970 to 2025
Source: Companies Market Cap.

The primary strategic challenge for Boeing is to stabilize its production systems, improve quality control, and restore confidence with its customers and regulators. The BDS segment is a key part of this recovery, providing a foundation of stable government work. The analyst community currently holds a consensus “Buy” rating on Boeing’s stock (BA), with an average 12-month price target of around $240. This optimism is largely predicated on the expected long-term recovery of the commercial aviation market, supported by the steady performance of the defense and services businesses.

Conclusion

The global defense sector is in the midst of a historic upcycle, driven by a return to great power competition and the urgent need for technological modernization. The five contractors at the apex of this industry—Lockheed Martin, RTX, Northrop Grumman, General Dynamics, and Boeing—are uniquely positioned to benefit from this long-term trend, each leveraging a distinct set of capabilities and strategic advantages..

Why should I be interested in this post?

Finance students should delve into the defense industry and its leading contractors to understand unique financial dynamics shaped by government contracts, long-term program cycles, and significant geopolitical influences. Studying this sector provides valuable insights into valuing companies with substantial order backlogs, analyzing industries with high barriers to entry and concentrated customer bases, assessing the financial implications of large-scale R&D investments, and understanding how global security trends directly impact corporate performance and sector stability.

Related posts on the SimTrade blog

   ▶ Nithisha CHALLATop 5 companies by market capitalization in the US

   ▶ Nithisha CHALLA Market Capitalization

   ▶ Nithisha CHALLAThe NASDAQ index

Useful resources

Defense News Top 100 Top 100 | Defense News

SIPRI Trends in World Military Expenditure, 2024 | SIPRI

Lockheed Martin Investor Relations Investor Overview | Lockheed Martin Corp.

RTX Investor Relations Investors :: RTX

Northrop Grumman Investor Relations Investor Home – Northrop Grumman

General Dynamics Investor Relations Investor Relations – General Dynamics

About the author

The article was written in October 2025 by Nithisha CHALLA (ESSEC Business School, Grande Ecole Program – Master in Management (MiM), 2021-2024).

Top 5 companies in the luxury sector

Nithisha CHALLA

In this article, Nithisha CHALLA (ESSEC Business School, Grande Ecole Program – Master in Management (MiM), 2021-2024) delves into the top five companies in the luxury sector by market capitalization and provides information into their origins, latest announcements, and notable developments to provide financial professionals and students with actionable insights.

Introduction: The State of the Global Luxury Market

The global luxury goods market, a sector synonymous with exclusivity, craftsmanship, and enduring value, stands at a pivotal juncture. Characterized by its resilience and deep connection to global wealth dynamics, the market reached a valuation of approximately USD 346.19 billion in 2024. Projections indicate a robust growth trajectory, with forecasts anticipating the market will expand at a Compound Annual Growth Rate (CAGR) of between 4.40% and 6.5%, potentially reaching a value between USD 532.50 billion and USD 724.99 billion by 2034. This expansion is not merely a function of economic cycles but is propelled by fundamental shifts in consumer behavior, wealth distribution, and technological integration.

The industry’s leading firms are navigating this complex environment by anchoring their strategies to three core pillars: digitalization, sustainability, and brand heritage. Digital innovation, through the deployment of Artificial Intelligence (AI) for personalization, Augmented Reality (AR) for immersive shopping, and sophisticated omnichannel retail strategies, has become a critical tool for engaging with a tech-savvy consumer base. Sustainability has transitioned from a peripheral concern to a central tenet of brand value, with consumers demanding transparency in sourcing, ethical production, and the availability of circular models such as resale and repair services. Finally, in an increasingly crowded market, the authentic heritage and unparalleled craftsmanship of a brand remain its most defensible assets, providing the narrative and quality that justify a premium price point.

This report provides a comprehensive financial and strategic analysis of the top five firms that define the global luxury sector. These titans are ranked primarily by their market capitalization, a metric that reflects the market’s collective, forward-looking assessment of a company’s brand equity, strategic positioning, and future earnings potential.

The picture below shows the world’s top 5 valuable companies by market capitalization (Companies Market Cap, August 2025).

World’s top 5 valuable companies by market capitalization in luxury industry
Source: Companies Market Cap.

The market capitalization, commonly called a “market cap”, is the total market value of a publicly traded company’s outstanding shares and is widely used to measure how much a company is worth. In most cases, it can be easily calculated by multiplying the share price with the amount of outstanding shares.

LVMH Moët Hennessy Louis Vuitton

LVMH Moët Hennessy Louis Vuitton SE stands as the undisputed titan of the luxury industry, a sprawling conglomerate whose scale and influence are without parallel. The modern group was formed in 1987 through the strategic merger of two iconic French entities: Moët Hennessy, itself a product of the 1971 union between champagne producer Moët & Chandon and cognac maker Hennessy, and Louis Vuitton, the legendary trunk-maker founded in 1854. Since 1989, the group has been steered by the vision of its Chairman and Chief Executive Officer, Bernard Arnault, who has meticulously transformed it into the world’s preeminent luxury powerhouse. LVMH’s core mission is to embody “The Art of Crafting Dreams,” a philosophy that guides the long-term development of its diverse portfolio while ensuring each brand’s unique identity, heritage, and expertise are meticulously preserved and nurtured.

LVMH’s primary strategic advantage lies in its decentralized “House of Brands” model. The group’s portfolio comprises over 75 distinct brands, referred to as “Maisons,” organized across six synergistic business groups: Wines & Spirits, Fashion & Leather Goods, Perfumes & Cosmetics, Watches & Jewelry, Selective Retailing, and Other Activities.

The Wines & Spirits group includes legendary names such as Dom Pérignon, Hennessy, Moët & Chandon, and Veuve Clicquot. The Fashion & Leather Goods division, the group’s largest revenue and profit driver, is home to icons like Louis Vuitton, Christian Dior, Fendi, and Celine. Perfumes & Cosmetics features powerhouses like Parfums Christian Dior, Guerlain, and the globally dominant retailer Sephora. The Watches & Jewelry segment boasts titans such as Tiffany & Co., Bulgari, TAG Heuer, and Hublot. Finally, the Selective Retailing group includes Sephora and the luxury department store Le Bon Marché, providing a powerful direct-to-consumer channel.

Logo of LVMH
 Logo of LVMH
Source: the company.

LVMH’s financial results underscore its dominant market position. For the fiscal year 2024, the group delivered a solid performance despite a challenging global economic environment, reporting total revenue of €84.7 billion. Profit from recurring operations stood at €19.6 billion, with a group share of net profit amounting to €12.55 billion. The Fashion & Leather Goods group was the primary contributor, generating €41.06 billion in revenue, followed by Selective Retailing at €18.26 billion.

Recent performance indicates a potential stabilization in the luxury market. In the third quarter of 2025, LVMH reported revenue of €18.28 billion ($21.25 billion), representing a 1% organic increase year-over-year that surpassed analyst expectations. This result was seen as a positive signal for the entire sector, suggesting that consumer demand may be steady after a period of normalization.

As of mid-October 2025, LVMH’s market capitalization was approximately $350 billion, cementing its status as the most valuable luxury company in the world by a significant margin. The company’s stock has delivered a 5-year total return of approximately 40-45%, reflecting its consistent growth and profitability. Key valuation metrics, such as its price-to-earnings (P/E) and price-to-sales (P/S) ratios, are closely watched by investors, and the stock maintains a broadly positive consensus among analysts, with a majority issuing “Buy” ratings.

The picture below shows the market capitalization history of LVMH from 2002 to 2025.

Market cap history of LVMH from 2002 to 2025
Source: Companies Market Cap.

The picture below shows the stock price history of LVMH from 2000 to 2025.

Stock price history of LVMH from 2000 to 2025
Source: Companies Market Cap.

Looking forward, LVMH’s strategy is heavily focused on leveraging technology to enhance its competitive advantages. The group’s digital transformation is spearheaded by its “Omnichannel & Data” division, which aims to create a seamless and personalized customer journey across all touchpoints. Central to this effort are two key initiatives: the AI Factory and the 3D Factory.

Sustainability is another core pillar of LVMH’s long-term vision. The group’s commitments are detailed in its comprehensive 2024 Social and Environmental Responsibility Report, which outlines ambitious targets for reducing its environmental footprint, promoting circularity, and ensuring responsible sourcing across its vast supply chain. By integrating these digital and sustainability initiatives, LVMH aims not only to drive operational efficiency but also to deepen its connection with a new generation of consumers who demand both technological sophistication and corporate responsibility.

Hermès International

Hermès International represents the apex of the luxury pyramid, a brand whose name is synonymous with uncompromising quality, artisanal craftsmanship, and unparalleled exclusivity. The company’s story began in 1837, when founder Thierry Hermès established a harness-making workshop in Paris, dedicated to serving the needs of European nobility. Over six generations, the family-run business has evolved from its equestrian roots into a global symbol of high luxury, guided by a singular vision of creating timeless objects designed to be passed down through generations. Today, the company is led by Executive Chairman Axel Dumas, a sixth-generation family member who continues to uphold the house’s foundational values of creativity, quality, and long-term vision.

In stark contrast to the conglomerate strategy of LVMH, Hermès has built its empire on the power of a single, iconic brand. The company’s business model is a masterclass in managing scarcity to create extreme desirability. Rather than chasing volume, Hermès consciously limits the production of its most sought-after items, most notably the legendary Birkin and Kelly handbags. This strategy is not an artificial marketing ploy but a direct result of its commitment to craftsmanship; each bag is handcrafted by a single artisan in one of the company’s workshops in France, a process that can take many hours to complete.

This scarcity model transforms Hermès products from mere consumer goods into a distinct asset class. Data on the resale market (secondary market for luxury goods) provides compelling evidence of this phenomenon. The Hermès Constance and Picotin bags, for example, have been shown to retain 127% and 120% of their retail value (meaning that bags are more expensive on the secondary market than the primary market), respectively, while the Louis Vuitton Neverfull, another iconic bag from a different house, retains 136%. For rarer items, the appreciation is even more dramatic, with special editions like the Himalaya Birkin fetching markups of 300-500% at auction. For investors, this means that Hermès stock is valued not just on its ability to manufacture and sell goods, but on its capacity to meticulously manage and preserve the “asset value” of its core products, justifying its premium market valuation.

Logo of Hermès International
 Logo of Hermès International
Source: the company.

Hermès’ financial performance is a direct reflection of its successful scarcity model, characterized by industry-leading profitability and consistent growth. For the fiscal year 2024, the company delivered outstanding results, with consolidated revenue reaching €15.2 billion, a remarkable increase of 15% at constant exchange rates. Recurring operating income grew to €6.2 billion, translating to a recurring operating margin of 40.5%—a figure that is the envy of the luxury sector and a testament to the brand’s immense pricing power. Growth was robust across all regions, with particularly exceptional performance in Japan (+23% at constant exchange rates) and Europe excluding France (+19%). This momentum continued into the first half of 2025, with revenues reaching €8 billion.

This exceptional profitability and steady growth have earned Hermès a market capitalization of approximately $270 billion as of mid-October 2025, making it the second most valuable luxury company in the world despite having revenues that are a fraction of LVMH’s.1 The stock’s performance reflects this “scarcity premium,” with a 5-year total return of approximately 200%.2 Its valuation multiples are accordingly high, with a P/E ratio often exceeding 50, as investors price in the brand’s unique and highly defensible competitive position.3 The stock maintains a generally positive, though often cautious, rating from analysts who acknowledge its quality but are wary of its high valuation.

The picture below shows the market capitalization history of Hermès International from 2003 to 2025.

Market cap history of Hermès International from 2003 to 2025
Source: Companies Market Cap.

The picture below shows the Stock price history of Hermes International from 2000 to 2025.

Stock price history of Hermes International from 2000 to 2025
Stock price history of Hermès International from 2000 to 2025
Source: Companies Market Cap.

Hermès’ forward-looking strategy is one of steadfast continuity and disciplined investment. The company is committed to deepening its vertical integration by continuing to invest in its production capabilities. This includes the regular opening of new leather goods workshops, or “maroquineries,” across France, with three new sites planned between 2025 and 2027.

In contrast to its peers, Hermès has adopted a more measured and deliberate approach to digitalization. Its online presence serves more as a brand-building and storytelling platform than a high-volume sales channel, ensuring that the digital experience complements, rather than dilutes, the brand’s aura of exclusivity. The company’s comprehensive approach to sustainability, which emphasizes the durability, repairability, and timelessness of its products, is detailed in its 2024 Universal Registration Document and is inherent to its business model of creating objects that last a lifetime.

Compagnie Financière Richemont

Compagnie Financière Richemont SA, the Swiss-based luxury goods group, occupies a distinct and powerful position in the industry as the preeminent specialist in “hard luxury” (durable products like trunks, suitcases, etc.). Founded in 1988 by South African businessman Johann Rupert, who remains the company’s Chairman, Richemont has cultivated a portfolio of some of the world’s most prestigious Maisons in jewelry and watchmaking. The group’s strategic direction is now guided by CEO Nicolas Bos, who previously led the highly successful Van Cleef & Arpels Maison. Richemont’s corporate structure is deliberately focused on preserving the heritage and autonomy of its brands while providing them with the resources and strategic oversight of a global powerhouse.

Richemont’s strength lies in the depth and prestige of its portfolio, which is organized into three main divisions: Jewelry Maisons, Specialist Watchmakers, and Other Businesses. The Jewelry Maisons division is the group’s financial engine, anchored by two of the most iconic names in high jewelry: Cartier and Van Cleef & Arpels. These brands alone account for the vast majority of the group’s revenue and profits, representing a formidable duopoly in the branded jewelry market.

The Specialist Watchmakers division is a veritable hall of fame of Swiss haute horlogerie, including revered names such as Vacheron Constantin, A. Lange & Söhne, Jaeger-LeCoultre, IWC Schaffhausen, and Piaget. This collection of brands gives Richemont an unparalleled position in the high-end watch market, from classic complications to modern sports timepieces. The “Other” division includes fashion and accessories brands like Chloé and Montblanc, as well as the group’s online distributors. This heavy concentration in hard luxury provides Richemont with a unique risk and return profile. The value of its products is tied to timeless design, precious materials, and mechanical craftsmanship, making them less susceptible to the volatile, trend-driven cycles of the fashion industry. This positions the company as a pure play on long-term global wealth creation and the enduring appeal of tangible assets as a store of value.

Logo of Compagnie Financière Richemont
 Logo of Compagnie Financière Richemont
Source: the company.

Richemont’s financial performance reflects its strong position in the resilient hard luxury segment. For the fiscal year ending March 31, 2025 (FY25), the group reported robust sales of €21.4 billion and an operating profit of €4.5 billion. The company maintains a very strong balance sheet, with a net cash position of €8.3 billion. Geographically, the group’s sales are well-diversified, with Asia Pacific accounting for 33% of revenue, followed by the Americas (25%), Europe (23%), Japan (10%), and the Middle East & Africa (9%).

With a market capitalization of approximately $118 billion as of mid-October 2025, Richemont is the third-largest publicly traded luxury goods company. Its stock has been a strong performer, delivering an impressive 5-year total return in the range of 174% to 188%, outperforming many of its peers. Its valuation metrics are typically viewed as more moderate than those of Hermès, reflecting its different business mix and growth profile. The consensus among financial analysts is generally positive, with a majority holding “Buy” ratings on the stock.

The picture below shows the market capitalization history of Compagnie Financière Richemont from 2003 to 2025.

Market cap history of Compagnie Financière Richemont from 2003 to 2025
Source: Companies Market Cap.

The picture below shows the stock price history of Compagnie Financière Richemont from 1995 to 2025.

Stock price history of Compagnie Financière Richemont from 1995 to 2025
Source: Companies Market Cap.

Richemont’s strategic priorities are centered on enhancing its direct-to-consumer engagement and navigating the digital transformation of the luxury market. A key initiative is the “Luxury New Retail” (LNR) model, which aims to create a seamless omnichannel experience (contacts from different selling channels like internet websites, social networks, phone calls, etc.) for customers. This strategy has been supported by a strategic partnership with Alibaba in China to leverage its Tmall Luxury Pavilion platform, providing Richemont’s Maisons with unparalleled access to the vast Chinese consumer market.

Sustainability is also a core focus, as detailed in the company’s FY25 Non-Financial Report. Richemont is moving towards a “Double Materiality Assessment” to evaluate both its impact on the environment and society, and the corresponding risks and opportunities for the business. This approach highlights the group’s commitment to responsible sourcing, talent development, and the preservation of cultural heritage—values that are intrinsic to the world of high jewelry and watchmaking.

Kering S.A.

Kering SA represents a unique model in the luxury sector, one built on the principle of acquiring and creatively reinvigorating high-fashion houses. The group’s origins are unconventional for a luxury titan; it was founded as a timber trading company, Pinault S.A., in 1962 by French entrepreneur François Pinault. Through a series of strategic acquisitions in the retail sector, the company evolved into Pinault-Printemps-Redoute (PPR). The pivotal moment in its transformation came in 1999 with the audacious acquisition of a controlling stake in the Gucci Group. This move marked the company’s definitive shift towards luxury and set the stage for its future. In 2013, the group was rebranded as Kering to reflect its new identity. Today, it is led by François-Henri Pinault, son of the founder, who serves as Chairman and CEO.

Kering’s portfolio is a curated collection of some of the most influential names in fashion and leather goods, including Gucci, Saint Laurent, Bottega Veneta, Balenciaga, and Alexander McQueen. The group’s strategy is distinct from its peers; it operates more like a “private equity” model for high-fashion brands, granting significant creative freedom to its appointed artistic directors to drive brand identity and commercial success. This approach has historically yielded spectacular results, such as the explosive growth of Gucci under Alessandro Michele and Saint Laurent under Hedi Slimane.

The model is inherently cyclical and carries a higher degree of risk, as the group’s fortunes are heavily dependent on the success of these creative visions. When a creative cycle flourishes, the growth can be exponential; however, when a brand’s momentum wanes, the financial impact can be severe due to the portfolio’s concentration. Kering has also strategically expanded into adjacent categories, establishing Kering Eyewear and Kering Beauté to gain greater control over these profitable licensed businesses.

Logo of Kering
 Logo of Kering
Source: the company.

Kering’s recent financial performance illustrates the inherent volatility of its creative-led model. The fiscal year 2024 proved to be a challenging period of transition for the group. Total revenue declined by 12% on a comparable basis to €17.2 billion. This downturn was driven primarily by its largest brand, Gucci, which saw its revenue fall by 21% on a comparable basis to €7.7 billion as it undergoes a major creative and strategic reset. Other major houses also faced headwinds, with Saint Laurent’s revenue declining by 9%. In contrast, Bottega Veneta showed resilience with a 6% increase in comparable revenue. The impact on profitability was significant, with the group’s recurring operating income falling by 46% to €2.6 billion, and the operating margin contracting from 24.3% in 2023 to 14.9% in 2024. Geographically, retail revenue declined across most major regions, including the Asia-Pacific (-24%) and North America (-11%), with Japan being the only region to post growth.

This performance has been reflected in the company’s market valuation. As of mid-October 2025, Kering’s market capitalization stood at approximately $45 billion, a significant discount to its peers. The stock has underperformed, with a 5-year total return of approximately -10% to -43%, highlighting investor concerns over the Gucci turnaround. Analyst ratings are currently mixed, with a significant number of “Hold” recommendations, as the market awaits tangible signs of a successful creative relaunch at its flagship brand.

The picture below shows the market capitalization history of Kering from 2003 to 2025.

Market cap history of Kering from 2003 to 2025
Source: Companies Market Cap.

The picture below shows the Stock price history of Kering from 2000 to 2025.

Stock price history of Kering from 2000 to 2025
Source: Companies Market Cap.

Kering’s foremost strategic imperative is the successful execution of its brand transformations, particularly at Gucci. The group is focused on strengthening the desirability and exclusivity of its houses through elevated communications, refined product strategies, and higher-quality distribution networks. This includes continuing to reduce its exposure to the wholesale channel to gain greater control over pricing and brand presentation.

Beyond the immediate turnarounds, Kering remains a leader in sustainability within the luxury sector. It was a pioneer in implementing an Environmental Profit & Loss (EP&L) account, a tool that measures and monetizes the environmental impact of its operations and supply chain from raw materials to retail.

The group’s digital strategy is also a key focus, with investments in data science and customer relationship management (CRM) to support its houses’ growth and enhance the client experience. An investment in Kering is therefore not a bet on the stable growth of the luxury market, but a specific, higher-risk wager on management’s proven ability to orchestrate successful creative and commercial turnarounds

Essilor Luxottica

Essilor Luxottica SA represents a unique and dominant force at the intersection of luxury, healthcare, and technology. The Franco-Italian conglomerate was formed in 2018 through the landmark merger of Essilor, the world’s leading manufacturer of ophthalmic lenses, and Luxottica, the global leader in eyewear frames. This combination created a vertically integrated behemoth with an unparalleled position across the entire eyewear value chain, from lens technology and frame manufacturing to a global retail footprint. The company is led by Chairman and CEO Francesco Milleri and Deputy CEO Paul du Saillant, who oversee its complex and highly synergistic operations.

Essilor Luxottica’s market power is derived from its comprehensive control over the eyewear industry. The company’s portfolio includes over 150 brands, a mix of powerful proprietary names and a vast array of highly profitable licensed brands. Its proprietary portfolio is anchored by global icons such as Ray-Ban, Oakley, Persol, and Oliver Peoples. On the lens technology side, it owns industry standards like Varilux, Crizal, and Transitions. The company also holds the exclusive licenses to design, manufacture, and distribute eyewear for a who’s who of luxury fashion houses, including Chanel, Prada, Giorgio Armani, Burberry, and Versace.

This dominance in product is matched by its control over distribution. Essilor Luxottica operates a global retail network of approximately 18,000 stores, including major chains like LensCrafters, Sunglass Hut, and Pearle Vision, as well as a growing e-commerce presence. Furthermore, its ownership of EyeMed, one of the largest vision insurance providers in the United States, gives it significant influence over the consumer’s purchasing journey. This level of vertical integration, from manufacturing to insurance, is unprecedented in the industry and has led to scrutiny regarding its market power, with some critics characterizing its position as a near-monopoly.

Logo of Essilor Luxottica
 Logo of Essilor Luxottica
Source: the company.

The financial strength of EssilorLuxottica’s integrated model is evident in its results. For the fiscal year 2024, the group achieved revenues of €26.5 billion, representing a 6% increase at constant exchange rates, and an adjusted net profit of €3.1 billion. Growth was geographically balanced, with strong performances in Latin America (+9.7%) and Asia Pacific (+9.3%).

The company’s momentum continued with a record-breaking third quarter in 2025, which saw revenues climb to €6.87 billion, an 11.7% increase at constant exchange rates. This strong performance was driven by robust demand across all regions and channels, with a notable contribution from the burgeoning wearables category.

With a market capitalization of approximately $168 billion as of mid-October 2025, EssilorLuxottica is firmly positioned among the top-tier global luxury and consumer goods companies.1 The company’s stock has performed exceptionally well, delivering a 5-year total return of approximately 126% to 168%.2 Its valuation reflects its dominant market position and future growth prospects, and it holds a generally positive consensus rating from financial analysts.3

The picture below shows the market capitalization history of Essilor Luxottica from 2003 to 2025.

Market cap history of Essilor Luxottica from 2003 to 2025
Source: Companies Market Cap.

The picture below shows the Stock price history of Essilor Luxottica from 2000 to 2025.

Stock price history of Essilor Luxottica from 2000 to 2025
Source: Companies Market Cap.

EssilorLuxottica’s strategy is focused on blurring the lines between eyewear, technology, and healthcare. The company is moving beyond traditional vision correction to establish itself as a leader in the broader “wearable technology” ecosystem. The most prominent example of this is its collaboration with Meta on Ray-Ban | Meta smart glasses, which integrate live streaming and AI capabilities into an iconic fashion accessory. By leveraging the brand power of Ray-Ban and its vast retail network, EssilorLuxottica is positioned to succeed in a market where pure-play tech companies have previously struggled.

The company is also expanding into the hearing solutions market with its proprietary Nuance Audio technology, which integrates hearing assistance into fashionable eyewear, targeting the 1.2 billion consumers with mild to moderate hearing loss. This strategic pivot into “med-tech” and wearables, combined with its ongoing innovation in lens technology and its “Eyes on the Planet” sustainability program, positions EssilorLuxottica not just as an eyewear company, but as a comprehensive vision and hearing health technology platform with a powerful luxury and lifestyle component.

Conclusion

The global luxury market is in a state of dynamic evolution, shaped by the crosscurrents of economic uncertainty, demographic shifts, and technological disruption. The five firms profiled in this analysis—LVMH, Hermès, Richemont, Kering, and EssilorLuxottica—are not merely participants in this market; they are its primary architects, each with a distinct strategy for navigating the path forward.

Why should I be interested in this post?

Finance students should study the luxury industry and its giants to learn about resilient business models, exceptional pricing power, and how to value and manage intangible assets like brand equity. Analyzing this sector offers a deeper understanding of financial strategies that are less sensitive to economic downturns and achieve high profitability.

Related posts on the SimTrade blog

   ▶ Nithisha CHALLA Top 5 companies by market capitalization in the US

   ▶ Nithisha CHALLA Market Capitalization

   ▶ Nithisha CHALLA The NASDAQ index

Useful resources

Companies market cap Largest luxury companies by market cap

LVMH Key figures of LVMH

Essilor Luxottica Brand portfolio of Essilor Luxottica

Kering 2024 annual Kering results

Richemont Ranked: Richemont Maisons

About the author

The article was written in October 2025 by Nithisha CHALLA (ESSEC Business School, Grande Ecole Program – Master in Management (MiM), 2021-2024).

Price is what you pay, value is what you get

Hadrien PUCHE

In this article, Hadrien PUCHE (ESSEC Business School, Grande École Program, Master in Management, 2023-2027) comments on Warren Buffett’s famous quote about the fundamental difference between price and value, and discusses how this distinction remains crucial for modern investors navigating today’s volatile markets.

About Warren Buffett

Warren Buffett is the chairman and CEO of Berkshire Hathaway, a financial holding company. He is widely considered one of the most successful long-term investors in history, known for his value-driven approach. Buffett often praised patience and a deep understanding of the intrinsic value of companies over speculation and short-term trends.

Warren Buffett
Warren Buffett
Source: Wikimedia Commons

About the quote

This quote, “price is what you pay, value is what you get”, is often attributed to Warren Buffett and is sometimes said to originate from one of his 1987 shareholder letters. However, its first verifiable appearance is in his 2008 shareholder letter, where Buffett uses it to emphasize the timeless lesson he learned from Benjamin Graham. The quote perfectly captures the essence of value investing, the philosophy that made Buffett so successful.

“Additionally, the market value of the bonds and stocks that we continue to hold suffered a significant decline along with the general market. This does not bother Charlie and me. Indeed, we enjoy such price declines if we have funds available to increase our positions. Long ago, Ben Graham taught me that ‘Price is what you pay; value is what you get.’ Whether we’re talking about socks or stocks, I like buying quality merchandise when it is marked down.”
(Warren E. Buffett, Berkshire Hathaway Shareholder Letter, 2008)

Analysis of the quote

Buffett’s quote highlights a key idea in both economics and finance: the difference between the price of an asset and its actual value.

The price is simply what you pay in a transaction, reflecting a market consensus at a specific moment in time. The value, however, is the abstract idea of the true worth of an asset, based on its capacity to generate future cash flows for its owner.

Buffett points out that market movements are largely shaped by human behavior, especially fear and greed, which can cause assets to be mispriced. The essence of long-term investing lies in identifying these inefficiencies and using them to build wealth over time.

Benjamin Graham, Buffett’s mentor, often illustrated this idea with the allegory of Mr. Market: a moody business partner who offers to buy or sell his stake in your company at changing prices every day. Sometimes he’s euphoric and offers too much, sometimes he’s depressed and offers too little. A wise investor listens politely, but never lets Mr. Market influence his view of the company.

Financial concepts related to the quote

We can relate this quote to three financial concepts: Intrinsic value, Efficient Market Hypothesis, and Market cycles.

Intrinsic value

The concept of intrinsic value suggests that any item can be given a “true worth”, based on its fundamentals: profits, growth, and overall future cash flows.

Models like the Discounted Cash Flow (DCF) analysis help investors estimate this value, by projecting how much cash an asset will generate and discounting it back to today’s money. Cash flows represent the real money a business produces — not just accounting profits, but the actual funds available to reinvest, repay debt, or distribute to shareholders.

The formula for the present value (PV) of a series of cash flows, denoted by CFt, discounted with the discount rate r, is given by:

Present value of a series of cash flows

The discount rate reflects both the time value of money — the idea that a euro today is worth more than a euro tomorrow, and the risk attached to the investment. The riskier the cash flows, the higher the discount rate investors will apply, and therefore the lower the intrinsic value. Understanding both the amount and the uncertainty of future cash flows is essential to determining what a company is truly worth.

Buffett’s philosophy is simple: always make investment decisions when you understand the intrinsic value and are therefore able to make informed and rational choices.

Efficient Market Hypothesis

According to the Efficient Market Hypothesis (EMH), formalized by Eugene Fama in 1970, asset prices in perfectly competitive markets instantly reflect all available information, implying that price always equals value.

However, value investing strongly challenges this idea. Markets often misprice assets, at least temporarily. Behavioral biases such as overconfidence, herd behavior or the tranquility paradox (a behavioral bias where prolonged stability increases risk-taking) can lead market prices to diverge from fundamentals, allowing some investors to buy undervalued assets and achieve superior long-term returns.

Market cycles

It is often believed that market prices move in cycles, driven by alternating periods of optimism and pessimism. When prices increase, investors are more optimistic and keep buying, pushing prices even higher. When prices start decreasing, investors start selling. All of this often happens without any major changes in the intrinsic value of the underlying companies.

Understanding these cycles may allow investors to act counter-cyclically: to buy when others are afraid and sell when they are greedy. Recognizing the difference between market emotion and fundamental value is what separates value investors from speculators.

My opinion about this quote

I believe that this quote is often forgotten by many investors. With the democratization of trading apps and financial content on social media, anyone can trade, but not many understand what they are doing.

I find value investing particularly challenging in today’s market. Take Nvidia as an example: as of 2025, the company is a global leader in graphics processing units (GPUs) and AI computing. With a Price-to-Earnings ratio around 51, can its intrinsic value truly justify a $4 trillion market capitalization? Perhaps, if you believe that the AI ecosystem will sustain the massive profits investors currently expect, but there is no doubt that the stock is currently expensive.

P/E ratio comparison of Nvidia, Amazon, Microsoft, Apple, Google

The challenge of identifying true value is not new : a historical parallel can be drawn with the dot-com bubble of the late 1990s, when companies with minimal earnings, like pets.com and America Online, saw sky-high valuations, that perhaps were disconnected from their actual values. Such episodes should remind investors of the importance of nuancing enthusiasm with careful analysis.

Graph of the cyclically adjusted P/E ratio of the SP500, from 1930 to today

The point isn’t to be pessimistic, but to make every investment decision with a clear and well-reasoned understanding of the underlying business and how it will evolve.

A similar question arises with Bitcoin. What is one Bitcoin worth? The only serious answer to this question is that one Bitcoin is worth whatever someone else is willing to pay for it. Value investors, like Buffett, avoid these hype-driven assets and choose to focus on assets that have fundamentals they can understand.

Price of bitcoin from 2010 to sept 2025

Why should you be interested in this post?

This quote offers a timeless lesson for anyone studying or working in finance: investing is all about discipline, critical thinking, and analytical rigor.

Whether you want to work in trading, M&A, private equity, private debt, asset management, or any other financial field, understanding the distinction between price and value is essential.

As a final thought, you may find it very interesting to apply this principle to your own career choices. Look beyond appearances and seek roles that align with your long-term values and curiosity.

Related posts on the SimTrade blog

   ▶ All posts about Quotes

Useful resources

Business

Berkshire Hathaway

Warren Buffett (2024) Warren Buffett’s 2024 letter to investors, Berkshire Hathaway.

Academic research

Fama E. (1970) Efficient Capital Markets: A Review of Theory and Empirical Work, Journal of Finance, 25, 383-417.

Fama E. (1991) Efficient Capital Markets: II Journal of Finance, 46, 1575-617.

Hou K., H. Mo, L. Zhang (2017) The Economics of Value Investing, NBER Working paper 25563.

About the author

The article was written in October 2025 by Hadrien PUCHE (ESSEC Business School, Grande École Program, Master in Management, 2023-2027).

The Business Model of Proprietary Trading Firms

Anis MAAZ

In this article, Anis MAAZ (ESSEC Business School, Global Bachelor in Business Administration (GBBA), 2023-2027) explains how prop firms work, from understanding their business model and evaluation processes, to fee structures and risk management rules. The goal is not to promise guaranteed profits, but to provide a transparent, realistic overview of how proprietary trading firms operate and what traders should know before joining one.

Context and objective

  • Goal: demystify how prop firms make money, how their rules work, and what realistic outcomes look like, even if you are new to prop firms.
  • Outcome: a technical but accessible guide with a simple numeric example and a due diligence checklist.

What a prop firm is

Proprietary trading firms (prop firms) use their own capital to trade in financial markets, leveraging advanced risk management techniques and state-of-the-art technologies. But how exactly do prop firms make money, and what makes them attractive to aspiring traders? Traders who meet the firm’s rules get access to buying power and share in the profits. Firms protect their capital with strict risk limits (daily loss, max drawdown, product caps). Two operating styles you will encounter: In house/desk model: you trade live firm capital on a desk with a risk manager. Evaluation (“challenge”) model: you pay a fee to prove you can hit a target without breaking rules. If you pass, you receive a “funded” account with payout rules. For example, a classic challenge can be to reach a profit of 6% without losing more than 4% of your initial challenge capital to become funded.

The Proprietary Trading Industry: Origins and Scale

Proprietary trading as a business model emerged in the 1980s-1990s in the US, initially within investment banks’ trading desks before regulatory changes (notably the Volcker Rule in 2010) pushed prop trading into independent firms. The modern “retail prop firm” model, offering funded accounts to individual traders via evaluation challenges, gained momentum in the 2010s, particularly after 2015 with firms like FTMO (Czech Republic, 2014) and TopstepTrader (US, 2012).

Today, the industry includes an estimated 200+ prop firms globally, concentrated in the US, UK, and UAE (Dubai has become a hub due to favorable regulations). Major players include FTMO, TopstepTrader, Apex Trader Funding, Alphafutures, and MyForexFunds. Most are privately owned by founders or small investor groups and some (like Topstep) have received venture capital. The market size is difficult to quantify precisely, but industry reports estimate the global prop trading sector handles billions in trading capital, with the retail-focused segment growing 40-50% annually from 2020-2024.

Core Characteristics of prop firms

  • Capital Allocation: Prop firms provide traders with access to firm capital, enabling them to trade larger positions than they could on their own.
  • Profit Sharing: A trader’s earnings are typically a percentage of the profits generated. This incentivizes high-caliber performance.
  • Training Programs: Many prop firms invest in the development of new traders via structured training programs, equipping them with proven strategies and technologies.
  • Diverse Markets: Prop traders operate across various asset classes, such as stocks, forex, options, cryptocurrencies, and commodities.

How the business model works

The money comes from evaluation fees and resets: a major revenue line for challenge-style firms because most applicants do not pass the challenges. Once funded, a trader keeps the majority of the profits generated (often 70–90%) and the firm keeps the rest. Some firms charge for platform, data or advanced tools such as a complete order book, and pay exchange/clearing fees on futures.

In some cases, firms may charge onboarding or monthly platform fees to cover operational costs, such as trading infrastructure, data services, and proprietary software. However, top firms often waive such fees for consistently profitable traders.

For example, a firm charging $150 for a $50,000 evaluation challenge that attracts 10,000 applicants per month generates $1.5M in fee revenue. If 8% pass (800 traders) and receive funded accounts, and only 20% of those (160) reach a payout, the firm pays out perhaps $500,000-$800,000 in profit splits while retaining the rest as margin. Add-on services (resets at $100 each, platform fees) further boost revenue.

Who Are the Traders?

Prop firm traders come from diverse backgrounds: retail traders seeking leverage, former bank traders, students, and career-changers. No formal degree is required. The average trader age ranges from 25-40, though firms accept anyone 18+. Most traders operate as “independent contractors”, not employees, they receive profit splits, bearing their own tax obligations.

Retention is actually very low: industry data suggests 60-70% of funded traders lose their accounts within 3 months due to rule violations or drawdowns. Only 10-15% maintain funded status beyond 6 months. The model is inherently high-churn: firms continuously recruit through affiliates and ads, knowing most will fail but a small percentage will generate consistent trading activity and profit-share revenue.

What successful traders share :

  • The ability to manage risk and follow rules.
  • Analytical skills and a deep understanding of market behavior.
  • Psychological toughness to handle the highs and lows of trading.

It’s not an easy industry at all, and it’s better to have a real job, because only a small fraction of traders pass and an even smaller fraction reach payouts after succeeding in a challenge. Fee income arrives upfront, payouts happen later and only for those who succeed and manage to be disciplined through time.

For new traders, it’s not easy to pass a challenge when the rules are strict, because trading with someone else’s capital often amplifies fear and greed. Success is judged not only by profitability but also by consistency and adherence to firm guidelines, and any new traders struggle to maintain profitability and burn out within months.

EU regulators have long reported that most retail accounts lose money on leveraged products like CFDs: typically 74–89%, which helps explain why challenge pass rates are low without strong process and discipline.

Success rates: what is typical and why most traders fail

“Pass rate” (applicants who complete the challenge) is commonly cited around 5–10%. “Payout rate among funded traders” is often ~20%. End to end, only ~1–2% of all applicants reach a payout. All of these statistics vary by firm, product, and rules. Most people fail due to rule breaches under pressure (daily loss, news locks), overtrading, and inconsistent execution. Psychological factors like revenge trading, FOMO (Fear of missing out), are the usual culprits.

Trading Strategies, Markets, and Tools

Which Markets?

Most prop firms focus on futures (E-mini S&P, Nasdaq, crude oil), forex (EUR/USD, GBP/USD), and increasingly cryptocurrencies (Bitcoin, Ethereum). Some firms also offer equities (US stocks). The choice depends on the firm’s clearing relationships and risk appetite. Futures dominate because of high leverage, deep liquidity, and high trading windows.

Common Strategies

Prop traders typically employ “intraday strategies”:

  • Scalping (holding positions seconds to minutes)
  • Momentum trading (riding short-term trends), and mean reversion (fading extremes)
  • Swing trading (multi-day holds) is less common due to overnight risk rules
  • High-frequency strategies are rare in retail prop firms, and most traders use setups based on technical indicators (moving averages, RSI, volume profiles).

Tools and Platforms

Firms provide access to professional platforms like NinjaTrader, TradingView, MetaTrader 4/5,). Traders receive Level 2 data (order book), news feeds (Bloomberg, Reuters), and sometimes proprietary risk dashboards. Some firms offer replay tools to practice historical data.

The key performance idea

Positive expectancy = you make more on your average winning trade than you lose on your average losing trade, often enough to overcome costs. Here is a simple way to check:

Step 1: Out of 10 trades, how many are winners? Example: 5 winners, 5 losers (50% win rate). Step 2: What’s your average win and average loss? Example: average win €120; average loss €80. Step 3: Expected profit per trade ≈ (wins × avg win − losses × avg loss) ÷ number of trades. Here: (5 × 120 − 5 × 80) ÷ 10 = (€600 − €400) ÷ 10 = €20 per trade. If costs/slippage are below €20 per trade, you likely have an edge worth scaling, subject to the firm’s risk limits.

The firm wants you to stay inside limits, your average loss is controlled (stops respected), and your results are repeatable across days. They avoid the “luck factor” by putting rules like 2 minimum winning days to pass a challenge and impossible to make more than half of the challenge target in one day.

There are many ways to pass a challenge, depending on your trading strategy: If you aim for trades where your win is 5 times higher than what you risk, you do not need a winrate of 50% or 80% to pass the challenges and be profitable.

Payout mechanics: example with Topstep (to clarify the “50%” point)

Profit split: you keep 100% of the first $ 10,000 you withdraw; after that, the split is 90% to you / 10% to Topstep (per trader, across accounts).

Per request cap: Express Funded Account: request up to the lesser of $ 5,000 or 50% of your account balance per payout, after 5 winning days. Live Funded Account: up to 50% of the balance per request (no $ 5,000 cap). After 30 non consecutive “winning days” in Live, you can unlock daily payouts up to 100% of balance.

Note: “50%” here is a cap on how much you may withdraw per request—not the profit split. Other firms differ (some advertise 80–90% splits, 7–30 day payout cycles, or higher first withdrawal shares), so always read the current Terms.

Why traders choose prop firms (psychology and practical reasons)

Traders are attracted to prop firms for both psychological and practical reasons. The appeal starts with small upfront risk: instead of depositing a large personal account, you pay a fixed evaluation fee. If you perform well within the rules, you gain access to greater buying power, which lets you scale faster than you could with a small personal account.

But this method is indeed a psychological trap, because most of the traders will fail their first account, buy another one because it’s “cheap” and it will become an addiction when they will start burning accounts every day because it “doesn’t feel real” for them. The trade offs are real, evaluation fees and resets can add up, rules may feel restrictive, and pressure tends to spike near limits or payout thresholds. All these factors contribute to why many candidates ultimately fail.

However, for experimented traders who can manage psychology, the built in structure, risk limits, reviews, and a community adds accountability and often improves discipline. Payouts can also serve as a capital building path, gradually seeding your own account over time.

Regulation: A Gray Zone

Proprietary trading firms operate in a largely unregulated space, especially the evaluation-based model. In the US, prop firms are not broker-dealers; they typically collaborate with registered FCMs (Futures Commission Merchants) or brokers who handle execution and clearing, but the firm itself is often a private LLC with minimal oversight. The CFTC (Commodity Futures Trading Commission) regulates futures markets but not prop firms’ internal challenge mechanisms.

In France, the AMF has issued warnings about unregulated prop firms and emphasized that if a firm collects fees from French residents, it may fall under consumer protection law. Some firms have pulled out of France or adjusted terms. The UK FCA has similarly warned consumers. The UAE (DIFC, DMCC) offers more permissive environments, attracting many firms to Dubai.

Conclusion

Prop trading firms offer a compelling proposition: controlled access to institutional sized buying power, standardized risk limits, and a structured pathway for transforming skill into capital without large personal deposits. In this model, firms protect capital through rules and fees, while profitable traders create a scalable environment for strategy development and execution.

At the same time, the evaluation-and-payout cycle can amplify cognitive and emotional traps. Fee resets, drawdown thresholds, and profit targets concentrate attention on short-term outcomes, which can foster overtrading, sensation seeking, and schedule-driven risk-taking. The same leverage that accelerates account growth also magnifies behavioral errors and variance, making intermittent reinforcement (occasional big wins amid frequent setbacks) psychologically sticky and potentially addictive.

In the end, prop firms are neither shortcut nor scam, but a high-constraint laboratory. They reward, stable execution, rule adherence, and penalize improvisation and impulse. As a venue, they are well suited to disciplined traders with repeatable processes, robust risk controls, and patience for incremental scale. Without those traits, the structure that protects the firm can become a treadmill for the trader.

At the end of the day, the prop firm model is designed for the firm to profit from fees, not trader success. With 1-2% end-to-end success rates, it’s closer to a paid training lottery than a career path.

If your goal is to learn trading, SimTrade, paper trading, or small personal accounts teach discipline without predatory fee structures. Joining a bank’s graduate program gives you access to senior traders, research, and real market-making or flow trading experience.

If you’ve already traded profitably for 1-2 years, have a proven strategy, need leverage, and fully understand the fee economics, then a top-tier firm (FTMO, Topstep) could provide capital to scale. But as a first step out of ESSEC, I would prioritize banking or buy-side roles that offer mentorship, stability, and credentials.

Why should I be interested in this post?

Prop firms reveal how trading businesses monetize edge while enforcing strict risk management and incentive design. Grasping evaluation rules, fee structures, and payout mechanics sharpens your ability to assess unit economics and governance. This knowledge is directly applicable to careers in trading, risk, and fintech—helping you make informed choices before joining a program.

Related posts on the SimTrade blog

   ▶ Theo SCHWERTLE Can technical analysis actually help to make better trading decisions?

   ▶ Michel VERHASSELT Trading strategies based on market profiles and volume profiles

   ▶ Vardaan CHAWLA Real-Time Risk Management in the Trading Arena

Useful Resources

Topstep payout policy and FAQs (current rules and examples)

The Funded Trader statistics on pass/payout rates

How prop firms make money (evaluation fees vs profit share): neutral primers and industry explainers

General overviews of prop trading mechanics and risk controls

About the author

The article was written in October 2025 by Anis MAAZ (ESSEC Business School, Global Bachelor in Business Administration (GBBA), 2023-2027).

Modern Portfolio Theory: What is it and what are its limitations?

Yann TANGUY

In this article, Yann TANGUY (ESSEC Business School, Global Bachelor in Business Administration (GBBA), 2023-2027) explains the Modern Portfolio Theory and how Post-Modern Portfolio Theory solves some of its limitations.

Creation of Modern Portfolio Theory (MPT)

Developed in 1952 by Nobel laureate Harry Markowitz, MPT revolutionized the way investors think about portfolios. Before Markowitz, investment decisions were mostly based on the relative nature of each investment. MPT changed the way to think about investing by showing that an investment cannot be thought of in isolation but as part of contribution to portfolio risk and return.

At the center of MPT is the diversification theory. The adage “don’t put all your eggs in one basket” is the base of this theory. By diversifying a portfolio with assets having different risk and return profiles and a low correlation, an investor can build a portfolio that has a lower risk than any of its components.

A Practical Example

Let’s assume that we have just two assets: stocks and bonds. Stocks have given higher returns over a long period of time compared to bonds but are riskier. On the other hand, bonds are less risky but return less.

An investor who puts all their money in stocks will have huge returns in a bull market but will suffer huge losses in a bear market. A conservative investor who puts money in bonds alone will have a smooth portfolio but will be denied the chance of better growth.

MPT believes that the combination of different investments in a portfolio can have a better risk-reward ratio than single investments. The key is the correlation of the assets. If the correlation is less than 1, the portfolio’s risk will be less than the weighted average of each individual asset’s risk. In this simplified example, stocks are performing poorly when bonds are performing well and vice versa, so they have a negative correlation, hedging out the overall returns of the portfolio.

Mathematical explanation

To estimate the risk of a portfolio, MPT uses statistical measures like variance and standard deviation. Variance is calculated to then obtain the standard deviation, which we use to assess the risk of an asset as it indicates how much said asset’s price fluctuates.

On the other hand, correlation and covariance quantify how two assets move compared to each other. Covariance and correlation give an indication of change in value, i.e. Do the assets move in the same way. Correlation is between -1 and 1, a correlation of 1 means that the asset moves in the exact same way and -1 means that they move in opposite ways.

The portfolio variance is calculated as follows for a portfolio of asset A and asset B:

Portfolio Variance Formula

Where:

  • R = return
  • w = weight of the asset
  • Var = variance
  • Cov = covariance

The variance of a portfolio is then not equal to the weighted average risk of its components because we factor in the covariance of said components.

The aim of MPT is to find the optimal portfolio mix that minimizes the portfolio standard deviation for a given level of expected return or that maximizes the portfolio expected return for a given level of standard deviation. This can be graphically represented as the efficient frontier, a line representing the set of optimal portfolios.

This Efficient Frontier represents different allocations of assets in a portfolio. All portfolios on this frontier are called efficient portfolios, meaning that they have the best risk adjusted returns possible with this combination of assets. This means that when choosing the allocation for a portfolio one should pick a portfolio located on the frontier based on their risk tolerance and return objective.

The figure below represents the efficient frontier when investors can invest in risky assets only.

Efficient Portfolio Frontier.
Portfolio Efficient Frontier
Source: Computation by the Author.

Quantifying performance

To quantify the performance of a portfolio, MPT utilizes Sharpe ratio. The Sharpe ratio measures the excess return of the portfolio (the return over the risk-free rate) for the risk of the portfolio (defined by portfolio standard deviation). The formula is as follows:

Sharpe Ratio Formula

Where:

  • E(RP) = expected return of portfolio P
  • Rf = risk-free rate
  • σP = standard deviation of returns of portfolio P

A higher Sharpe ratio indicates a better risk-adjusted return.

Limitations of MPT

Even though MPT has been around in finance for decades now, it is not universally accepted. The biggest criticism against it is that it employs standard deviation to measure price movement, but the problem is that no difference is made between positive and negative volatility. They are both seen as risky.

However, many investors would be happy with a portfolio that performs 20% or 40% returns every year, but this portfolio could be considered risky by MPT, even if it always performs better than the return needed as there is a lot of variation, however this variation does not matter to you if your return objective is always met. This means that investors care more about downside risks, the risk of performing worse than your return objective.

Emergence of Post-Modern Portfolio Theory (PMPT)

PMPT, introduced in 1991 by software designers Brian M. Rom and Kathleen Ferguson, is a refinement of MPT to overcome its main shortcoming. The key difference lies in the fact that PMPT focuses on downside deviation as a measure of risk, rather than the normal standard deviation that takes every form of deviation into account.

The origins of PMPT can be linked to the work of A. D. Roy with his “Safety First” principle in his 1952 paper, “Safety First and the Holding of Assets”. In his paper, Roy argued that investors are primarily motivated by the desire to avoid disaster rather than to maximize their gains. As he put it, “Decisions taken in practice are less concerned with whether a little more of this or of that will yield the largest net increase in satisfaction than with avoiding known rocks of uncertain position or with deploying forces so that, if there is an ambush round the next corner, total disaster is avoided.” Roy proposed that investors should seek to minimize the probability that their portfolio’s return will fall below a certain minimum acceptable level, or “disaster” level which is now known as MAR for “Minimum Acceptable Return”.

PMPT introduces the concept of the Minimum Acceptable Return (MAR), i.e., the lowest return that the investor wishes to receive. Instead of looking at the overall volatility of a portfolio, PMPT looks only at the returns below the MAR.
Calculating Downside Deviation

To compute downside deviation, we carry out the following:

  1. Define the Minimum Acceptable Return (MAR).
  2. Calculate the difference between the portfolio return and the MAR for each period.
  3. Square the negative differences.
  4. Sum the squared negative differences.
  5. Divide by the number of periods.
  6. Take the square root of the result to obtain the downside deviation.

You can download the Excel file below which illustrates the difference between MPT and PMPT with two examples of market conditions (correlation).

Download the Excel file for the data for MPT and PMPT

In this file we find 2 combinations of assets: Example 1 and Example 2. The first combination has a positive correlation (0.72) and the second combination a negative one (-0.75) all the while having very similar standard deviation and returns for each asset.

First, using MPT, we demonstrate how high correlation leads to a worsened diversification effect, and a lower increase in portfolio efficiency (Sharpe Ratio) compared to a very similar portfolio with a low correlation.

Diversification effect on Sharpe Ratio (High correlation)

Diversification effect on Sharpe Ratio (Low correlation)

Afterwards, we use PMPT to show how correlation also impacts the diversification effect through the lens of downside deviation, meaning how much does the portfolio moves below the MAR, keeping in mind that these portfolios have only around a 0.1% difference in average return and originally have almost the same volatility.

Diversification effect on Downside Deviation (High correlation)

Diversification effect on Downside Deviation (Low correlation)

Focusing on downside risk is made even more important when you consider that financial returns are rarely normally distributed, as is often assumed in MPT. In their 2004 paper, “Portfolio Diversification Effects of Downside Risk,” Namwon Hyung and Casper G. de Vries show that returns often show signs of what they call “fat tails,” meaning that extreme negative events are more common than a normal distribution would predict.

They find that in this environment; diversification is even more powerful in reducing downside risk. They state: “The VaR-diversification-speed is higher for the class of (finite variance) fat tailed distributions in comparison to the normal distribution”. Meaning that for investors concerned about downside risk, diversification is a more potent tool than they might realize as diversification becomes even more efficient when taking into account the real distribution of returns.

Conclusion

Modern Portfolio Theory has been the main theory used by investors for more than half a century. Its basic premise of diversification and asset allocation is as valid as it ever was. But the usage of Standard Deviation of returns only gives a side of picture, a picture fully captured by PMPT.

Post-Modern Portfolio Theory is more advanced way of managing risk. With its focus on downside deviation, it provides investors with an accurate sense of what they are risking and allows them to build portfolios better aligned with their goals and risk tolerance. MPT was the first iteration, but PMPT has built a more practical framework to effectively diversify a portfolio.

An effective diversification strategy is built on a solid foundation of asset allocation among low-correlation asset classes. By focusing on the quality of diversification rather than only the quantity of holdings, investors can build portfolios that are better aligned with their goals, avoiding the unnecessary costs and diluted returns that come with a diworsified approach.

Why should I be interested in this post?

MPT is a theory widely used in Asset management, the understanding of its principles and limitations is primordial in nowadays financial landscape.

Related posts on the SimTrade blog

   ▶ Rayan AKKAWI Warren Buffet and his basket of eggs

   ▶ Raphael TRAEN Understanding Correlation in the Financial Landscape: How It Drives Portfolio Diversification

   ▶ Rishika YADAV Understanding Risk-Adjusted Return: Sharpe Ratio & Beyond

   ▶ Youssef LOURAOUI Minimum Volatility Portfolio

   ▶ All posts about Financial techniques

Useful resources

Ferguson, K. (1994) Post-Modern Portfolio Theory Comes of Age, The Journal of Investing, 1:349-364

Geambasu, C., Sova, R., Jianu, I., and Geambasu, L., (2013) Risk measurement in post-modern portfolio theory: Differences from modern portfolio theory, Economic Computation and Economic Cybernetics Studies and Research, 47:113-132.

Markowitz, H. (1952) Portfolio Selection, The Journal of Finance, 7(1):77–91.

Roy, A.D. (1952) Safety First and the Holding of Assets, Econometrica, 20, 431-449.

Hyung, N., & de Vries, C. G. (2004) Portfolio Diversification Effects of Downside Risk, Working paper.

Sharpe, W.F. (1966) Mutual Fund Performance, Journal of Business, 39(1), 119–138.

Sharpe, W.F. (1994) The Sharpe Ratio, Journal of Portfolio Management, 21(1), 49–58.

About the author

This article was written in October 2025 by Yann TANGUY (ESSEC Business School, Global Bachelor in Business Administration (GBBA), 2023-2027).

Understanding Risk-Adjusted Return: Sharpe Ratio & Beyond

Rishika YADAV

In this article, Rishika YADAV (ESSEC Business School, Global Bachelor in Business Administration (GBBA), 2023–2027) explains the concept of risk-adjusted return, with a focus on the Sharpe ratio and complementary performance measures used in portfolio management.

Risk-adjusted return

Risk-adjusted return measures how much return an investment generates relative to the level of risk taken. This allows meaningful comparisons across portfolios and funds. For example, two portfolios may both generate a 12% return, but the one with lower volatility is superior because most investors are risk-averse — they prefer stable and predictable returns. A portfolio that achieves the same return with less risk provides higher utility to a risk-averse investor. In other words, it offers better compensation for the risk taken, which is precisely what risk-adjusted measures like the Sharpe Ratio capture.

The Sharpe Ratio

The Sharpe Ratio is the most widely used risk-adjusted performance measure. It standardizes excess return (return minus the risk-free rate) by total volatility and answers the question: how much additional return does an investor earn per unit of risk?

Sharpe Ratio = (E[RP] − Rf) / σP

where Rp = portfolio return, Rf = risk-free rate (e.g., T-bill yield), and σp = standard deviation of portfolio returns (volatility).

Interpretation

The Sharpe Ratio was developed by Nobel Laureate William F. Sharpe (1966) as a way to measure the excess return of an investment relative to its risk. A higher Sharpe ratio indicates better risk-adjusted performance.

  • < 1 = sub-optimal
  • 1–2 = acceptable to good
  • 2–3 = very good
  • > 3 = excellent (rarely achieved consistently)

In real financial markets, sustained Sharpe Ratios above 1.0 are uncommon. Over the past four decades, broad equity indices like the S&P 500 have averaged between 0.4 and 0.7, while balanced multi-asset portfolios often fall in the 0.6–0.9 range. Only a handful of hedge funds or quantitative strategies have achieved Sharpe ratios consistently above 1.0, and values exceeding 1.5 are exceptionally rare. Thus, while the Sharpe ratio is a useful comparative tool, the theoretical thresholds (e.g., >3 as “excellent”) are not typically observed in real markets.

Capital Allocation Line (CAL) and Capital Market Line (CML)

The Capital Allocation Line (CAL) represents the set of portfolios obtainable by combining a risk-free asset with a chosen risky portfolio P. It is a straight line in the (risk, expected return) plane: investors choose a point on the CAL according to their risk preference.

The equation of the CAL is:

E[RQ] = Rf + ((E[RP] − Rf) / σP) × σQ

where:

  • E[Rp] = expected return of the combined portfolio
  • Rf = risk-free rate
  • E[RP] = expected return of risky portfolio P
  • σP = standard deviation of P
  • σQ = resulting standard deviation of the combined portfolio (proportional to weight in P)

The slope of the CAL equals the Sharpe ratio of portfolio P:

Slope(CAL) = (E[RP] − Rf) / σP = Sharpe(P)

The Capital Market Line (CML) is the CAL when the risky portfolio Q is the market portfolio (M). Under CAPM/Markowitz assumptions the market portfolio is the tangent (highest Sharpe) point on the efficient frontier and the CML is tangent to the efficient frontier at M.

The equation of the CML is:

E[RQ] = Rf + ((E[RM] − Rf) / σM) × σQ

where M denotes the market portfolio.

The slope of the CML, (E[RM] − Rf) / σM, is the Sharpe ratio of the market portfolio.

The link between the CAL, CML and Sharpe ratio is illustrated in the figure below.

Figure 1. Capital Allocation Line (CAL), Capital Market Line (CML) and the Sharpe ratio.
Capital Allocation Line and Sharpe ratio
Source: computation by author.

Strengths of the Sharpe Ratio

  • Simple and intuitive — easy to compute and interpret.
  • Versatile — applicable across asset classes, funds, and portfolios.
  • Balances reward and risk — combines excess return and volatility into a single metric.

Limitations of the Sharpe Ratio

  • Assumes returns are approximately normally distributed — real returns often show skewness and fat tails.
  • Penalizes upside and downside volatility equally — it does not distinguish harmful downside movements from beneficial upside.
  • Sensitive to the chosen risk-free rate and the return measurement horizon (daily/monthly/annual).

Beyond Sharpe: Alternative measures

  • Treynor Ratio — uses systematic risk (β) instead of total volatility: Treynor = (Rp − Rf) / βp. Best for well-diversified portfolios.
  • Sortino Ratio — focuses only on downside deviation, so it penalizes harmful volatility (losses) but not upside variability.
  • Jensen’s Alpha — α = Rp − [Rf + βp(Rm − Rf)]; measures manager skill relative to CAPM expectations.
  • Information Ratio — active return (vs benchmark) divided by tracking error; useful for evaluating active managers.

Applications in portfolio management

Risk-adjusted metrics are used by asset managers to screen and rank funds, by institutional investors for capital allocation, and by analysts to determine whether outperformance is due to skill or increased risk exposure. When two funds have similar absolute returns, the one with the higher Sharpe Ratio is typically preferred.

Why should I be interested in this post?

Understanding the Sharpe Ratio and complementary risk-adjusted measures is essential for students interested in careers in asset management, equity research, or investment analysis. These tools help you evaluate performance meaningfully and make better investment decisions.

Related posts on the SimTrade blog

   ▶ Capital Market Line (CML)

   ▶ Understanding Correlation and Portfolio Diversification

   ▶ Implementing the Markowitz Asset Allocation Model

   ▶ Markowitz and Modern Portfolio Theory

Useful resources

Jensen, M. (1968) The Performance of Mutual Funds in the Period 1945–1964, Journal of Finance, 23(2), 389–416.

Sharpe, W.F. (1966) Mutual Fund Performance, Journal of Business, 39(1), 119–138.

Sharpe, W.F. (1994) The Sharpe Ratio, Journal of Portfolio Management, 21(1), 49–58.

Sortino, F. and Price, L. (1994) Performance Measurement in a Downside Risk Framework, Journal of Investing, 3(3), 59–64.

About the author

This article was written in October 2025 by Rishika YADAV (ESSEC Business School, Global Bachelor in Business Administration (GBBA), 2023–2027). Her academic interests lie in strategy, finance, and global industries, with a focus on the intersection of policy, innovation, and sustainable development.

My Internship Experience as a Financial Analyst at Ophéa

Anis MAAZ

In this article, Anis MAAZ (ESSEC Business School, Global Bachelor in Business Administration (GBBA), 2023-2027) shares his professional experience as a Financial Analyst at Ophéa.

Introduction

As a Global BBA student at ESSEC Business School, I had the opportunity to join Ophéa as a Financial Analyst Intern during the summer of 2024. This four-month experience gave me hands-on exposure to financial reporting, budget monitoring, and compliance work within the public housing sector.

My missions ranged from participating in profit and loss commissions overseeing €68 million in annual investments, to preparing balance sheets and income statements, and conducting property tax audits. In this post, I will share my professional journey at Ophéa and reflect on how financial analysis supports decision-making in mission-driven organizations.

This experience allowed me to see firsthand how management control systems function in practice. Management control is the process by which managers influence organizational members to implement strategy. At Ophéa, financial analysis was not just about numbers, it was about creating information flows that enabled strategic decision-making in resource allocation, cost optimization, and compliance management.

About Ophéa

Ophéa is a public housing authority (Office Public de l’Habitat) based in Strasbourg, serving the Grand Est region of France. As a social landlord, Ophéa manages thousands of affordable housing units and oversees approximately €68 million in annual investments dedicated to property maintenance, renovations, and new construction projects.

Logo of OPHEA.
Logo of OPHEA
Source: the company.

Public housing authorities in France operate under strict regulatory frameworks, balancing social missions with financial sustainability. This requires rigorous budget management, transparent financial reporting, and careful cost optimization, all areas where the finance team plays a central role.

My Internship

During my internship at Ophéa, my missions focused on three main areas: Budget Monitoring and Profit & Loss Commissions, Balance Sheets and Income Statements, and Property Tax Analysis and Compliance Audits.

Budget Monitoring and Profit & Loss Commissions

I contributed to monthly profit and loss commissions, where the finance team reviewed budget execution across all departments. With €68 million in annual investments, tracking variances between forecasted and actual spending was critical. I extracted data from the accounting system, identified significant deviations, and prepared summary reports for management review.

Balance Sheets and Income Statements

A core responsibility was preparing and updating the company’s balance sheets and income statements using Excel. I consolidated financial data from various sources, ensured consistency across accounts, and formatted reports according to public accounting standards. This required attention to detail and understanding how transactions flow through financial statements.

Property Tax Analysis and Compliance Audits

I conducted detailed property tax analyses for Ophéa’s property portfolio, auditing over 150 individual tax assessments. My role was to verify tax calculations, identify discrepancies, and ensure regulatory compliance. Through systematic review, I identified more than €20,000 in annual overpayments across multiple properties, primarily due to outdated property classifications and incorrect square footage assessments. By filing correction requests with tax authorities, I helped recover these funds and optimize ongoing tax expenses by roughly 3% for the affected properties..

Required Skills and Knowledge

This internship demanded both hard and soft skills. On the technical side, I worked extensively with Excel, pivot tables, advanced formulas (VLOOKUP, INDEX-MATCH, SUMIFS), and data validation. I also learned public accounting principles according to French standards.

Beyond tools, discipline and consistency were essential. In financial reporting, small errors compound quickly. I learned to double-check figures, reconcile accounts systematically, and maintain clear documentation. Speed also mattered: closing processes run on tight schedules, and producing accurate reports quickly became a key skill.

What I Learned

This experience gave me a realistic view of financial analysis in practice, especially in a regulated environment.

First, I learned that discipline is the foundation of financial work. When preparing statements that will be audited by public authorities, every line must be traceable and justified. I developed habits around data validation and structured workflows that will serve me throughout my career.

Second, I understood how financial reporting operates as a diagnostic control system, where variance reports don’t just track performance but enable strategic conversations about resource allocation, project prioritization, and operational challenges. Financial data became the language connecting operational reality with strategic objectives.

Third, I gained confidence with Excel as a professional tool, moving beyond basic spreadsheets to building dynamic models and automating repetitive tasks. For instance, I created a pivot-table that reduced my reporting time by approximately 30%, allowing the team to focus on analysis rather than data compilation.

Finally, this internship confirmed my interest in investment-related careers. While operational, it gave me a solid foundation in financial mechanics, how companies track performance, manage budgets, and ensure compliance. These skills are directly transferable to roles in investment analysis or corporate finance.

Financial Concepts Related to My Internship

I present below three financial concepts related to my internship experience: budget variance analysis, accrual accounting, and working capital management.

Budget Variance Analysis

During monthly reviews of Ophéa’s €68 million investment budget, I analyzed variances across 5+ active projects. For example, I identified a renovation project that exceeded its initial budget by 10% (approximately €150,000) due to unforeseen structural issues. By documenting this variance and presenting it to management with supporting data, I helped facilitate timely discussions with project managers about cost controls and timeline adjustments.

Variance analysis is fundamental in public institutions where financial transparency is required, and it is a core skill in investment analysis when evaluating company performance against guidance.

Accrual Accounting

Accrual accounting records revenues and expenses when they are incurred, not when cash changes hands. At Ophéa, if we invoiced rent in December but received payment in January, revenue was still recorded in December. This provides a more accurate picture of financial performance but requires careful tracking. I learned to reconcile accounts receivable and payable, ensuring that transaction timing aligned with service delivery. Understanding accruals is essential for analyzing financial statements in investment decisions.

Working Capital Management

Working capital is the difference between current assets and current liabilities, which measures short-term financial health. Ophéa’s operations required careful cash flow planning: rent collection had to cover ongoing expenses. During property tax audits, I identified €20,000 of overpayments that tied up cash unnecessarily. By correcting these and claiming refunds,we improved cash availability for priority investments. Investors closely monitor working capital trends because deteriorating metrics can signal operational problems.

Why Should You Be Interested in This Post

This post offers a realistic view of a financial analyst internship in a mission-driven organization. If you are considering careers in corporate finance or investment analysis, understanding budget processes, financial reporting, and compliance work is essential.
This internship also highlights the value of foundational skills like Excel proficiency, attention to detail, and working with structured data. For students interested in sustainable finance, the public housing sector shows how financial analysis supports social outcomes.
Conclusion

My internship at Ophéa sharpened my analytical, technical, and organizational skills. Through budget monitoring, financial reporting, and compliance work, I learned how financial analysis translates into strategic decisions.

This experience confirmed my interest in investment-related careers. I now have a solid foundation in financial mechanics and understand the importance of rigor and consistency in financial work. Looking ahead, I want to pursue roles that combine financial analysis with strategic decision-making, whether in corporate finance, equity research, or portfolio management.

Related posts on the SimTrade blog

   ▶ All posts about Professional experiences

   ▶ Anouk GHERCHANOC My Internship Experience as a Corporate Finance Analyst in the 2IF Department of Inter Invest Group

   ▶ Martin VAN DER BORGHT My experience as an intern in the Corporate Finance department at Maison Chanel

   ▶ Pierre BERGES My first experience in corporate finance inside a CAC40 group

Useful Resources

Academic references

Ophéa website

Academic references

Anthony, R. N., & Govindarajan, V. (2007) Management Control Systems (12th ed.). McGraw-Hill.

Horngren, C. T., Datar, S. M., & Rajan, M. (2015) Cost Accounting: A Managerial Emphasis (15th ed.). Pearson.

Drury, C. (2018) Management and Cost Accounting (10th ed.)

About the author

The article was written in October 2025 by Anis MAAZ (ESSEC Business School, Global Bachelor in Business Administration (GBBA) 2027).