

In this article, Youssef LOURAOUI (ESSEC Business School, Global Bachelor of Business Administration, 2017-2021) presents the concept of smart beta used in the asset management industry.
Mutual funds and Exchange traded funds (ETF) based on the smart beta approach have increased in size during the recent years. As Burton Malkiel (2014), we also wonder if the smart beta approach is really smart.
The smart beta industry
Smart beta funds have experienced a significant growth with total assets under management approaching market 620 billion dollar in the U.S. as shown in Figure 1 (Morningstar Reseach, 2017).
Figure 1. Smart Beta Exchange Traded Products growth in the US market (2000-2017).
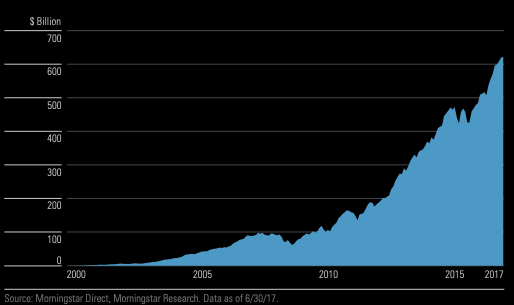
Source: Morningstar Research (2017).
Traditional approach in portfolio management
The traditional approach to build asset portfolio is to define asset weights based on the market capitalization. The framework of this traditional approach is based on the Capital Asset Pricing Model (CAPM) introduced by the work of Henry Markowitz and William Sharpe in 1964. The CAPM is based on a set of hypotheses about the market structure and investors:
- No intermediaries
- No constraints (possibility of short selling)
- Supply and demand equilibrium
- Inexistence of transaction cost
- Investors seeks to maximise its portfolio value by optimizing the mean associated with expected returns while minimizing variance associated with risk
- Investors are considered as “rational” with a risk averse profile
- Investors have access to the information simultaneously in order to execute their investment ideas
Under this framework, Markowitz developed a model relating the expected return of a given asset and its risk:
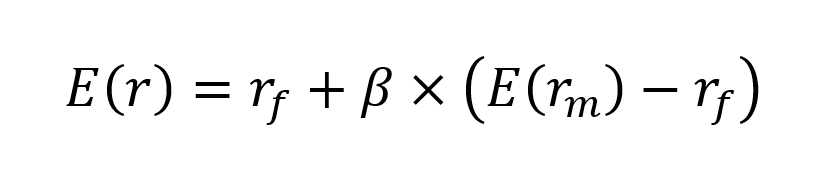
where E(r) represents the expected return of the asset, rf the risk-free rate, β a measure of the risk of the asset and E(rm) the expected return of the market.
In this model, the beta (β) parameter is a key parameter and is defined as:
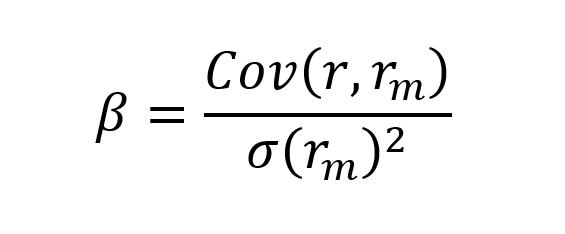
where Cov(r,rm) represents the covariance of the asset with the overall market, and σ(rm)2 is the variance of market return.
The beta represents the sensibility of the asset to the fluctuations of the market. This risk measure helps investors to predict the movements of their asset according to the movement of the market overall. It measures the asset volatility in comparison with the systematic risk inherent to the market. Statistically, the beta represents the slope of the line through a regression of data points between the stock returns in comparison to the market returns. It helps investors to explain how the asset moves compared to the market.
More specifically, we can consider the following cases for beta values:
- β = 1 indicates a fluctuation between the asset and its benchmark, thus the asset tends to move in a similar rate than the market fluctuations. A passive ETF replicating an index will present a beta close to 1 with its associated index.
- 0 < β < 1 indicates that the asset moves in a slower rate than market fluctuations. Defensive stocks, stocks that deliver consistent returns without regarding the market state like P&G or Coca Cola in the US, tend to have a beta with the market lower than 1.
- β > 1 indicates a more aggressive effect of amplification between the asset price movements with the market movements. Call options tend to have higher betas than their underlying asset.
- β = 0 indicates that the asset or portfolio is uncorrelated to the market. Govies, or sovereign debt bonds, tend to have a beta-neutral exposure to the market.
- β < 0 indicates an inverse effect of market fluctuation impact in the asset volatility. In this sense, the asset would behave inversely in terms of volatility compared to the market movements. Put options and Gold typically tend to have negative betas.
In order to better monitor the performance of an actively managed fund, active fund managers seek to improve the performance of their fund compared to the market. This additional performance is measured by the “alpha” (Jensen, 1968) defined by:
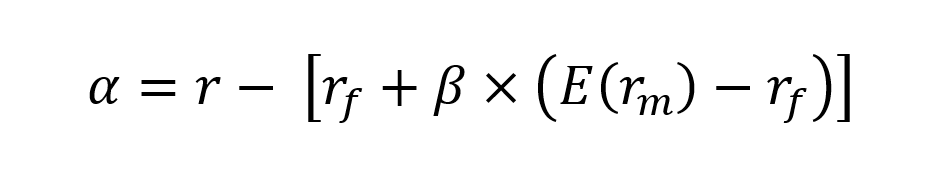
where E(r) is the average return of the fund over the period studied, rf the risk-free rate, E(rm) the expected return of the market, and β×(E(rm)-rf) represents the systematic risk of the fund.
Jensen’s alpha (α) represents the abnormal returns of the fund.
The Smart beta approach
The smart beta approach is based on the construction of a portfolio of assets using several different yield enhancement “factors”. BlackRock Investment Solutions (2021) lists the following factors mainly used in the smart beta approach:
- Quality, which aims to study the financial environment of the underlying asset.
- Volatility which aims to filter assets according to their risk.
- Momentum, which aims to identify trends in the selection of assets to be retained by focusing on stocks that have performed strongly in the short term.
- Growth is the approach that aims to select securities that have strong return expectations in the medium to long term.
- Size which aims to classify according to the size of the assets.
- Value that seeks to denote undervalued assets that are close to their fundamental values.
The smart beta approach is opposed to the traditional portfolio approach where a portfolio is constructed using the weights defined by the market capitalization of its assets. The smart beta approach aims to position the portfolio sensitivity or “beta” according to the market environment expectation of the asset manager. For a bull market, the fund manager will select a set of factors to achieve a pronounced exposure of his portfolio. Symmetrically, for a bear market, the fund manager will select another set of factors opting for a beta neutral approach to protect the sensitivity of his portfolio against bear market fluctuations.
Performance and impact factor
S&P Group (2016) studied the performance of different factors (volatility, momentum, quality, value, dividend yield, growth and size) on the S&P500 index for 1994-2014 broken down into sub-sectors (see Table 1). This study finds that each sector is impacted differently by choosing one factor over another. For example, in the energy sector, the strategies of value and growth has led to a positive performance with respectively 1.22% and 2.56%, while in the industrial sector, the strategies of size were the only factor with a positive performance of 1.66%. In practice, there are two approaches: focusing on a single factor or finding a combination of factors that offers the most interesting risk-adjusted return to the investor in view of his/her investment strategy.
Table 1. Sector exposures to smart beta factors (1994-2014).
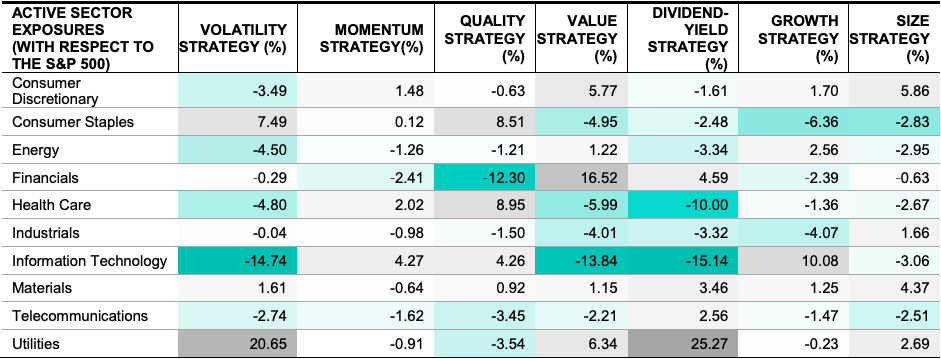
Source: S&P Research (2014).
S&P Group (2016) also studies the performance of the factors according to the market cycles (bull, bear or recovery markets), business cycles (expansion or contraction) and investor sentiment (neutral, bullish and bearish). The study shows how each factor has been mostly effective for every market condition.
Table 2. Performance of factors according to different market cycles, business cycles and investor sentiment.
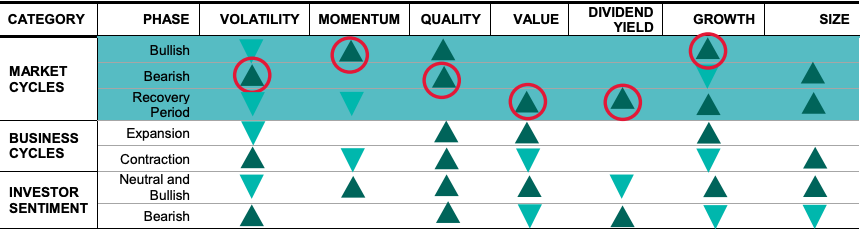
Source: S&P Research (2014).
In summary, the following characteristics of the different approaches discussed in this article can be identified:
- The CAPM approach aims to give a practical configuration of the relationship between the return of an asset with the market return as well as the return considered as risk-free.
- Alpha is an essential metric in the calculation of the portfolio manager’s return in an actively managed fund. In this sense, alpha and CAPM are linked in the fund given the nature of the formulas used.
- Smart beta or factor investing follows an approach that straddles the line between active and passive management where the manager of this type of fund will use factors to filter its source of return generation which differs from the common approach based on CAPM reasoning (Fidelity, 2021).
- The conductive link of these three reasoning is closely related to the fact that historically the CAPM model has been a pillar in financial theory, the smart beta being a more recent approach that tries to disrupt the codes of the so-called market capitalization based investment by integrating factors to increase the sources of return. Alpha is related to smart beta in the sense that the manager of this type of fund will want to outperform a benchmark and therefore, alpha allows to know the nature of this out-performance of the manager compared to a benchmark.
Is smart beta really smart?
Nevertheless, the vision of this smart beta approach has raised criticisms regarding the relevance of the financial results that this strategy brings to a portfolio’s return. Malkiel (2014) questioned the smartness of smart beta and found that the performance of this new strategy is only the result of chance in the sense that the persistence of performance is dependent in large part on the market configuration.
In his analysis of the performance of the smart ETF fund called FTSE RAFI over the period 2009-2014, he attributed the out-performance to luck. The portfolio allocation was highly exposed to two financial stocks, Citigroup and Bank of America, which accounted for 15% of the portfolio allocation. Note that Citigroup and Bank of America were prosecuted by the American courts for post-crisis financial events and interest rate manipulation operations related to the LIBOR scandal. This smart beta fund outperformed the passive managed US large cap ETF (SPY). Malkiel associated the asset selection of the FTSE RAFI fund with a bet on Bank of America that with another market configuration it could have ended in a sadder way.
Figure 2. FTSE RAFI ETF (orange) compared with its benchmark (FTSE RAFI US 1000) and with SPY ETF (green).
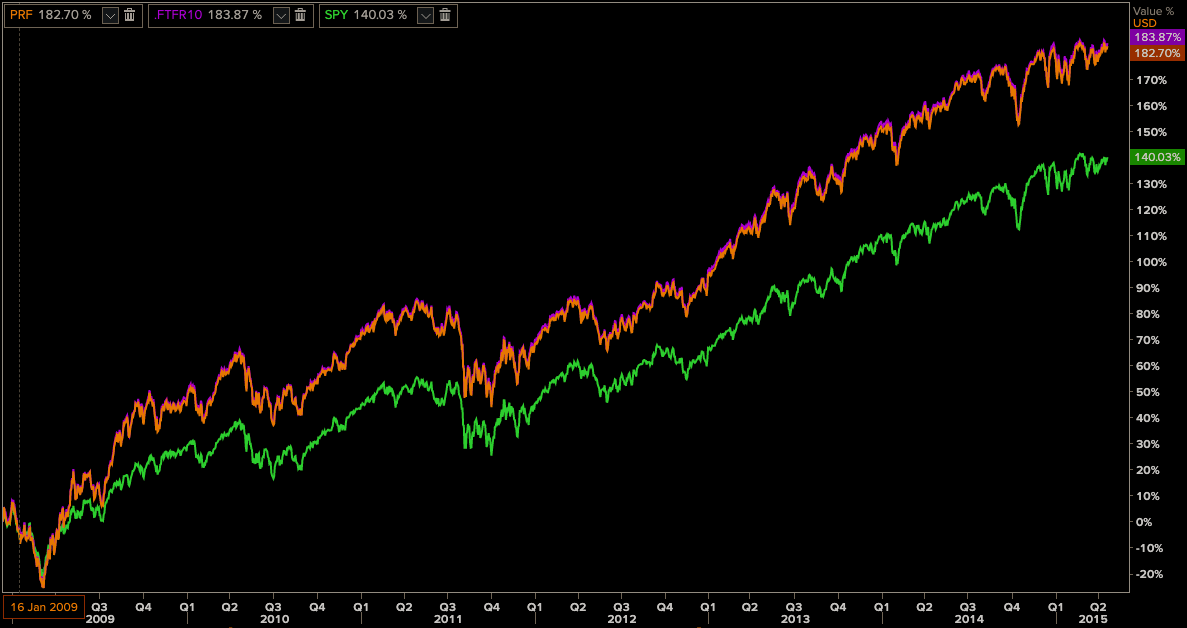
Source: Thomson Reuters Datastream.
We can conclude that the smart beta strategy can allow, as outlined in Blackrock’s research (BlackRock Investment Solutions, 2021), an opportunity to improve portfolio performance while seeking to manage variables such as portfolio out-performance, minimizing its volatility compared to the market or seeking diversification to reduce the risk of the investor’s portfolio. It is an instrument that must be taken judiciously in order to be able to affirm in fine if it is smart in the end, as Malkiel would say.
Related posts on the SimTrade blog
▶ Jayati WALIA Capital Asset Pricing Model (CAPM)
▶ Youssef LOURAOUI Beta
▶ Youssef LOURAOUI MSCI Factor Indexes
▶ Youssef LOURAOUI Factor Investing
▶ Youssef LOURAOUI Origin of factor investing
Useful resources
Academic articles
Malkiel, B. (2014). Is Smart Beta smart? The Journal of Portfolio Management 40, 5: 127-134
El Lamti N. (2017) Are smart beta strategies really smart? HEC Paris.
Business resources
BlackRock Investment Solutions (2021) What is Factor Investing
Fidelity (2021) Smart beta
S&P Global Research (2016) What Is in Your Smart Beta Portfolio? A Fundamental and Macroeconomic Analysis
Morningstar Research (2017) A Global Guide to Strategic-Beta Exchange-Traded Products
Fidelity (2021) Smart beta
About the author
The article in April 2021 was written by Youssef LOURAOUI (ESSEC Business School, Global Bachelor of Business Administration, 2017-2021).
1 thought on “Is smart beta really smart?”
Comments are closed.