Could the 2008 financial crisis been foreseen?

Could the 2008 financial crisis been foreseen?

img_SimTrade_Photo1_Raphael_Roero_de_Cortanze

In September 2008, the bankruptcy of Lehman Brothers broke the news and disclosed to the public what would become the biggest financial crisis since 1929. This crisis, fuelled by the speculation around ill-rated and poorly packaged mortgage securities, has been explained by some by the “black swan” theory.

Developed by Nassim Nicholas Taleb (2007), the black swan theory states that, similarly to black swans which were unthinkable for Europeans before they conquered Australia, exceptional financial events have a very low probability of occurring and are unpredictable from a statistics point of view. Nonetheless, is it fair to consider the 2008 as an unpredictable “black swan”?

According to the dominant economic theory, 2008 was a surprise

From the 1980’ to 2007, the “great moderation” period has reinforced in the dominant economic school of thought (the new classical economy) the idea of a stable long-term growth, uninterrupted by economics shocks and crisis. Indeed, from the 1980’, especially in the United States, all the indicators are green. The GDP is growing steadily, unemployment is low (under 4% for three years in a row under the Clinton presidency) and credit is accessible.

The “great moderation” is characterized by the reduction in the volatility of business cycle fluctuations in developed nations compared with the decades before. The flattening of business cycle fluctuations had been on the public debate since the 1967 and the famous conference led by Social Science Research Council Committee On Economic Stability called “Is the business cycle obsolete”.
During this period, Central banks became more independent, and governments began to widely use counter-cyclical policies in order to maintain growth in the long term with a balanced budget.

In “La Grande Crise: comment en sortir autrement”, James K. Galbraith describes this thirty-year period as a “great mirage”: everything was going well, so economists believed that everything was going well in the economy, and that everything would go well in the economy. Ben Bernanke, Governor of the Federal Reserve between 2005 and 2014, explained in 2015 that between the 1980’ and 2007, developed economics had returned to a stable economic pattern, thus that a shock could inevitably come from outside the economy. This framework of thought shared by most economists, politicians and central bankers at that time can explain why the 2008 crisis was not even foreseeable, as it is impossible to foresee an external shock.

Nonetheless, the analysis of certain parameters foreshadowed an upcoming financial crisis

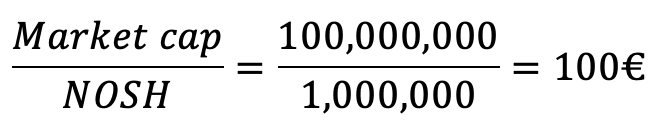
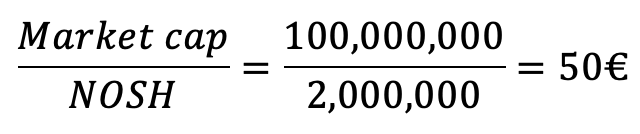
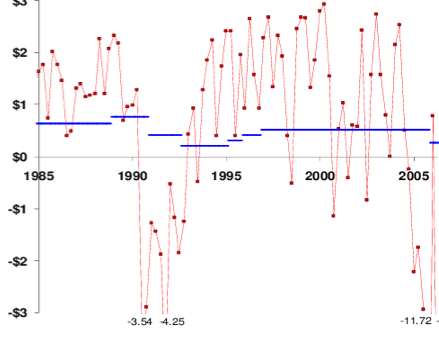
During the early 2000s, Dean Baker studied the evolution of bubbles across history in order to understand when the future crisis would occur. He specifically studied the price-to-earnings ratio (stock price / net income) of stocks on the stock market. He explained that a bubble appears when the gap between price and earnings widens in a non-proportional way (i.e., the stock prices increase more quickly than the net income or earnings does). During the course of his analysis, Dean Baker has even estimated the size of the mortgage bubble. He valued the bubble at $8,000 billion, which is strangely equivalent to the total amount of wealth destroyed during the 2008 financial crisis…

Minsky in 1986 stated that financial crises are a moment of the financial cycle. He explained that during a period of stability (here the “great moderation”), speculators get bored and begin to take more and more risks, until they reach a Ponzi phase, and the economy collapses. According to Minsky, the international wave of financial deregulation and the recombination of investment and commercial banks during the 1980s have allowed the speculative game to become even more dangerous. According to this theory, the 2008 crisis was thus bound to happen, the only uncertainty has been the exact date of the collapse of the economy.

Financial crisis are not black swans: they are rather common

Modern history is paved with financial crises. In 1637 the “tulip mania” in Holland led to a dramatic increase and then collapse in the price of the tulip bulb. At the height of the tulip craze, in February 1637, promises to sell a bulb were negotiated for ten times the annual salary of a skilled craftsman. Some historians have called this crisis the “first speculative bubble” in history, as the sudden drop in prices is similar to a crash and the financial instruments used (futures sales, “options” contracts – purchase/sale at a fixed price in advance) make it a real financial crisis.

Picture7
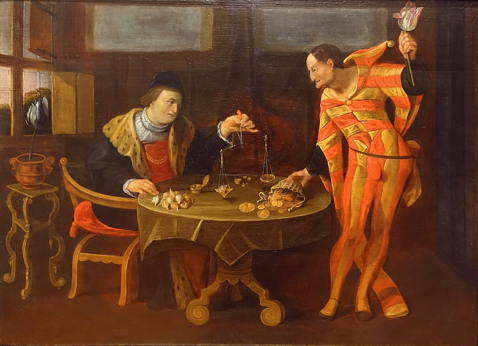
Anonymous, The Sale of Tulip Onions, 17th century. Oil on wood

During the XIXth century, the crises of the modern era appear. They are usually overproduction industrial crises which spread internationally. In 1857 occurred the “1st international crisis of the industrial era”. A series of bank failures in the US spread to the financial spheres in Europe, and then to the real economy, impacting industrial production and generating wage decreases. In May 1873, an intense speculation around real-estate led to a financial crash which spread to the rest of developed world. It was followed by a depression, a thirty-year period of depression and growth deceleration, characterized by persistent underemployment.

The 20th century also had its share of financial crises: 1929, the 1970s, etc.

Furthermore, economic research on financial crisis mainly focuses a western-centric event. If developed countries have enjoyed a high degree of stability, despite regular financial crises, it is not the case for economies of less-developed countries, which experience numerous repeated financial crises.

Useful resources

Baker D. (2008), The housing bubble and the financial crisis, Center for Economic and Policy Research (issue #46)

Bernanke B. (2015) The Federal Reserve and the Financial Crisis.

Galbraith J. (2015) La Grande Crise : Comment en Sortir Autrement.

Taleb N. (2007) The Black Swan: The Power of the Unpredictable.

About the author

Article written in June 2021 by Raphaël ROERO DE CORTANZE (ESSEC Business School, Master in Management, 2019-2022).

Stock split

Stock split

img_SimTrade_Photo1_Raphael_Roero_de_Cortanze

In this article, Raphaël ROERO DE CORTANZE (ESSEC Business School, Grande Ecole Program – Master in Management, 2018-2022) introduces the specificities of stock splits.

Stock split

What a stock split?

A stock split is a decision by a company’s board of directors to increase the total number of shares by issuing more shares to current shareholders. The effect is to divide the existing shares into multiple new shares.
Picture5

For instance, a company with 1 million shares launches a 2-for-1 stock split. Post-stock split, the Number of Outstanding Shares (NOSH) will be 2 million, thus, the company has to issue 1 million new shares. Each existing shareholder will receive an additional issued share for each share he/she already has.

During a stock split, the market capitalization of the company remains the same. In effect, the company has simply issued new shares to existing shareholders, it has not sold those shares (it would have been the case during a capital increase for instance). As the market cap remained the same and the Number of Outstanding Shares doubled during this stock split, the adjusting variable is the stock price. In this case it is divided by 2.

Before the operation, the per share price amounted to:

Screenshot 2021-06-21 at 19.32.33

After the stock split, the per share price amounts to:

Screenshot 2021-06-21 at 19.32.45

In other words, a stock split does not add any real value, because the issued shares are not bought.

Why do companies split their stock?

Stock splits are far from being uncommon. Apple has undergone two stock splits in the last 10 years: the first in 2014 (7-for-1 stock split) and the second in 2020 (4-for-1 stock split, where the share price decreases from $460 to $115). In 2020, Tesla has also decided to go with a 5-for-1 stock split, which reduced the share price from $1,875 to $375. But why do companies resort to stock-splits?

Two main reasons can explain why companies go through splitting their stock:

  • Decrease the stock price: when to stock price is too high, it can be quite expensive to acquire “lots” of shares (lot in the sense of bundle). Splitting the stock reduces the prices, thus allowing more investors to buy the company’s stock.
  • Increase the stock liquidity on the market: a higher number of shares outstanding can result into a higher liquidity for the stock, which makes the stock more attractive for buyers and sellers. Indeed, it allows more flexibility, and provide buying and selling movements from having too much of an impact on the company’s stock price.

Many companies exceed later the price level at which they had previously split their stock, causing them to go through another stock split. For instance, Walmart has split its stock 9 times between 1975 and 1999.

Stock exchanges publish regularly a Stock Splits Calendar, which notifies the market when to expect a split and at what ratio.

Stock split signaling

As we have seen in our example above, a stock-split is supposed to not influence the stock price (besides dividing its price by the stock-split ratio). In reality, a stock-split usually sends a positive signal to the market, as stock-splitting announces higher liquidity and decreased prices. Stock splits also allow companies such as Apple or Tesla to prevent their stock from breaking through the ceiling and make the stock unaffordable.

Reverse stock-split

What is a reverse stock-split

As for a traditional stock split, a reverse stock split is a decision made by a company’s board of directors. Nonetheless, like its name indicates, a reverse stock-split is the opposite of a traditional stock split. The goal is to decrease the total number of shares.

Before the reverse stock split After the reverse stock split

Picture6

In this example, the reverse stock split ratio is 1-for-2 (i.e., 1 new share for 2 existing shares). From the 1 million shares of the company, 0.5 million are destroyed. The Number of Outstanding Shares post-reverse stock-split is thus 0.5 million. As for a traditional stock split, no real value is created or destroyed, the market capitalization remains the same. The adjusting variable is the stock price. In this case, the stock price is multiplied by 2.

Why do companies go through reverse stock-split?

The reverse stock-split procedure is usually used by companies which have a low share price and would like to increase it. Indeed, companies can be delisted from stock exchanges if their stock falls below a certain price per share.

In addition, a reverse stock split can be used to eliminate shareholders that hold fewer than a certain number of shares. For instance, in 2011, Citigroup launched a reverse 1-for-10 split in order to reduce its share volatility and discourage speculator trading.

Useful resources

CNN Why it’s time for Amazon and other quadruple-digit stocks to split

Nasdaq Stock Splits Calendar

The Economic Times What is ‘Stock Split’

About the author

Article written in June 2021 by Raphaël ROERO DE CORTANZE (ESSEC Business School, Grande Ecole Program – Master in Management, 2019-2022).

How does the stock price of a firm change according to the shift of its capital structure?

How does the stock price of a firm change according to the shift of its capital structure?

img_SimTrade_Photo1_Raphael_Roero_de_Cortanze

In this article, Raphaël ROERO DE CORTANZE (ESSEC Business School, Master in Management, 2018-2022) analyses the effects of the shifts of capital structure on the stock price.

Capital structure and asymmetric information

The capital structure of a firm can be defined as the mix of the company’s debt and equity. Debt can be long-term or short-term. Equity can be common or preferred equity. The capital structure discloses the different sources of funding a firm uses in order to finance its operations and growth. It is usually measured through the gearing ratio: Debt / (Debt + Equity).

Picture2

The overall capital structure of a firm varies across the firm’s life and development through equity or debt issuances. Equity and debt issuance are seen on the balance sheet as an increase on the liabilities side.

Nonetheless, the balance sheet does not reveal the future decisions regarding the capital structure of the firm. Indeed, firms’ managers are suspected to hold information that outside investors and/or the market lack. These information discrepancies between the firm (managers) and the market (investors) are known as “asymmetric information”. Almost all economic transactions involve information asymmetries. These information failures influence the managers’ financial decision, and influence the market perception of the firm, through changes in stock price.

Announcement effects

The debt-equity choice conveys information for two reasons:

  • Managers will avoid increasing the firm’s leverage if the firm could have financial difficulties in the future.
  • Managers are reluctant to issue equity when the stock is thought to be undervalued.

Stock price reactions to capital structure changes are usually the following:

  • Common stock issuance: negative
  • Convertible debt issuance: negative
  • Straight debt: negative but insignificant
  • Bank debt (renewal): positive

Debt issuance

In 1958, Modigliani and Miller stated that in a world without taxes, bankruptcy costs, agency costs and asymmetric information, and in an efficient market, the value of a firm is unaffected by how it is financed. In other word, the choice of capital structure is irrelevant as it does not impact the value of the firm. As a result, debt issuance does not have any impact on the value of the firm according to their theory.

In 1963, Modigliani and Miller adapted their theory by integrating the notion of corporate taxation. In this framework, they show that the value of the levered firm is equal to the value of the unlevered firm plus the present value of the tax savings associated with the tax deductibility of the interests on the debt. In effect, debt conveys a taxable benefit called the “tax shield”.

In our non-Modigliani Miller perfect world, an increase in a firm’s debt ratio is often seen as a positive signal by the market as it shows that the firm managers believe in the firm capacity to generate taxable earnings in the future.

In order to come to this conclusion, Grinblatt and Titman (2002) have explained that firms choose their capital structure by comparing the tax benefit of debt financing and the cost of financial distress.
Picture3
Let us consider two firms, A (unlevered) and B (levered). Firm A has no debt, thus no interest expense, and Firm B has a debt of 100 with a 10% interest rate. A and B have the same EBIT. Through its debt, B has a yearly tax shield of 3 (the tax rate is 30%), meaning that B pays less tax than A which has no debt and then no tax shield.

Nonetheless, the effects of issuing straight debt (a debt which cannot be converted into something else) is negative but insignificant. But renewing bank debt translates into an increase in stock prices. Overall, the announcement of a debt issuance has on average little impact on the stock price, as it shows to the market that the firms:

  • Needs funding
  • Expects taxable income in the future
  • Will pay less tax as it will benefit from a higher tax shield
  • Is financially stable enough to convince banks or investors to lend it money.

Security sales

The table below (from Grinblatt and Titman (2002) summarizes a number of event studies that examine stock price reaction to the announcements of new security issues. It shows that raising capital is considered as a negative signal. For instance, when industrial firms issue common stock, their stock prices decline, on average about 13.1%.

Picture4
This is explained by the “adverse selection theory”, which states that firms are reluctant to issue common equity when the stock is undervalued. Thus, the market often assumes than common equity issuance and overvaluation go hand in hand. The issuing of common equity will thus have a negative effect on stock prices, as the market will think the stock is overvalued. As convertible bonds have a strong equity-like component, Grinblatt and Titman (2002) argue that the “adverse selection theory” can also explain why the market usually reacts negatively to the issuance of convertible bonds.

Pecking order theory

The market reacts favorably to leverage increase and unfavorably to leverage decrease. As a result, firms will use either internal financing (inside equity) or debt to finance their project over outside equity (equity issuance). This is called the “pecking order theory” of capital structure.

The theory of the financial pecking order states that, of the three possible forms of financing for a firm (internal cash flow, debt, equity), a firm will prefer to finance itself from internal cash flow, then debt, and finally, in the last case, by selling equity. This has a practical consequence on the way the company operates: once it has emptied its internal cash flow, it will issue debt. If it can no longer generate debt, it will issue equity.

Myers and Majluf (1984) highlight the consequences of information asymmetry between managers and investors. If the company finances itself with shares, it is because it believes that shares are overvalued and can therefore provide easy and abundant financing. If the company finances itself with debt, it is because it believes that shares are undervalued.

Nonetheless, firms can prefer to resort to equity rather than debt when they are experiencing financial difficulties. Indeed, in case of financial distress, the risk of having to suffer financial distress costs can be greater than the cost of issuing equity. Furthermore, firms can also decide to issue preferred equity in difficult times rather than common equity. In effect, preferred shareholders cannot force a firm into bankruptcy when it fails to meet its dividend obligations (while common shareholders can).

Useful resources

Grinblatt M. and S. Titman (2002) Financial Markets & Corporate Strategy, Second Edition – Chapter 19: The information conveyed by financial decisions.

Myers S.C. and N.S. Majluf (1984) Corporate financing and investment decisions when firms have information that investors do not have, Journal of Financial Economics, 13(2) 187-221.

Related posts on the SimTrade blog

   ▶ Shruti CHAND Balance sheet

   ▶ Louis DETALLE A quick review of the DCM (Debt Capital Market) analyst’s job…

   ▶ Louis DETALLE A quick review of the ECM (Equity Capital Market) analyst’s job…

About the author

Article written in June 2021 by Raphaël ROERO DE CORTANZE (ESSEC Business School, Master in Management, 2019-2022).

Dividend policy

Dividend policy

Raphael Roero de Cortanze

In this article, Raphaël ROERO DE CORTANZE (ESSEC Business School, Master in Management, 2018-2022) analyses the effects of dividend policy on the stock price.

What is a dividend?

Firms that generate earnings through their activities must choose between retaining these earnings (increase in reserves on the liabilities side of the balance sheet) or distributing these earnings to shareholders through paid dividends.

A dividend is a payment from a company to its shareholders. Dividends can take several forms:

Cash: the shareholders receive cash

  • Regular: the most common form of dividend, usually a quarterly cash distribution charged against retained earnings. These regular dividends are an engagement: the board of directors declares a dividend, of a certain amount and for a certain duration. Regular dividends are thus not very flexible: regular dividends are “sticky” as they represent a higher commitment (compared to special dividends or buybacks for instance).
  • Special: a special dividend is a payment made by a company to its shareholders, which the company declares to be separate from the typical recurring dividend cycle
  • Liquidating: a liquidating dividend is a distribution of cash or other assets to shareholders, with a view to shutting down the business. It is paid out after all creditor obligations have been settled

Stock dividend: the shareholders receive stock

A stock dividend is a dividend payment with shares rather than cash. It has the advantage to distribute to shareholders without decreasing the company’s cash balance. Nonetheless, it can dilute earnings per share

Dividend policy

Modigliani Miller: irrelevance of the dividend policy

The first theorem formulated by Modigliani and Miller in 1958 states that in a world without taxes, bankruptcy costs, agency costs and asymmetric information, and in an efficient market, the value of a firm is unaffected by how it is financed. In other word, the choice of capital structure is irrelevant as it does not impact the value of the firm. In the same way, the dividend policy (to pay or not to pay dividends to shareholders) does not affect the value of the firm. Dividend policy is thus irrelevant.

In 1963, Modigliani and Miller adapted this theorem by integrating corporate taxation. In this framework, they show that the value of the levered firm is equal to the value the unlevered firm plus the present value of the tax savings associated with the tax deductibility of the interests on the debt in the income statement (tax shield). With corporate taxation, the capital structure matters as debt is more interesting than equity. But they show that the dividend policy still does not affect the value of the firm. Dividend policy is thus irrelevant.

Signaling

First of all, the stock price is expected to fall after the issuance of a dividend by the amount of the dividend itself. Dividend policy conveys information. Michaely, Thaler and Womack (1995) have demonstrated that the market reacts positively to dividend initiations (when the board of directors declares a dividend) and negatively to omissions (when the board of directors announces it won’t distribute a dividend).

As dividend policy conveys information, managers try to smooth out dividends. Dividends are thus less volatile than earnings: payout ratios (Dividend / Earnings per Share) increase in bad times and decrease in good times.

Example

As an example, General Motor’s dividend per share remained fairly stable between 1985 and 2008, even though its earnings were very volatile.

Picture1
Not all firms pay dividend. Dividend-paying firms are bigger and more profitable. DeAngelo, DeAngelo and Skinner (2004) have shown that dividends have become more concentrated. Indeed, in 1978 in the US, 67% of the total dividends were distributed by the Top 100 dividend-paying firms. In 2000, this proportion increased to 81% (of which 46% in the top 25 players).

Dividends during the COVID-19 crisis

During a financial crisis, it is logical to observe dividend cuts and omissions. Nonetheless, the crisis entailed by the COVID-19 pandemic is notable for the fact these dividend cuts and omissions were found among all firms from all sectors, whereas for instance the financial crisis of 2008 was primarily associated with a sharp drop of dividends across the financial sector (banks, insurance companies, brokers, market infrastructure firms such as stock exchanges, etc.).

In 2020, the pandemic caused a 12% global decline in dividends distribution compared to 2019. Between the second and fourth quarters of 2020, the dividend cuts reached 220 billion US dollars globally. Indeed, firm profitability and debt are determinants of dividend cuts and omissions, especially during crisis.

Nonetheless, part of the global decrease in dividends can be explained by the extraordinary measures taken by governments. In France, the government announced in April 2020 that large companies would be able to benefit from support measures if and only if they undertook not to pay dividends or buy back their shares. Similarly, the Federal Reserve in the US has imposed limits on dividend distribution for US banks and the European Central bank has forbidden to credit institutions (such as banks) to distribute dividends. As financial institutions present a systemic risk, these measures were a way to make sure banks focused on withstanding the economic depression, rather than compensating their shareholders. The Federal Reserve recently declared it would free most banks from the pandemic dividend limits as soon as the large US banks would have cleared the last round of stress tests. As a result, as dividend distribution limitations are lifted and economies return to their long-term trajectory, global dividend distribution is expected to gradually return to normalcy.

Key concepts

Earnings

A company’s earnings refer to its after-tax net income. Located at the bottom of the Income Statement, earnings are also referred as the “bottom line”.

Retained earnings

A company’s retained earnings is the amount of net income (or earnings) left after the company has paid out dividends to its shareholders. Retained earnings remains available for financing the firm business (day-to-day activity, investments, acquisitions of other companies).

Useful resources

Michaely R., R. Thaler and K. Womack (1995) Price Reactions to Dividend Initiations and Omissions: Overreaction or Drift? Journal of Finance, 50(2): 573-608.

DeAngelo H., L. DeAngelo and D. Skinner (2004) Are dividends disappearing? Dividend concentration and the consolidation of earnings, Journal of Financial Economics, 72(3): 425-456.

Krieger K., N. Mauck, S. Pruitt (2020) The impact of the COVID-19 pandemic on dividends, Finance Research Letters.

Holly Ellyatt (February 21, 2021) Pandemic caused $220 billion of global dividend cuts in 2020, research says CNBC.

Barrons

Bloomberg

Lex Europa

About the author

Article written in June 2021 by Raphaël ROERO DE CORTANZE (ESSEC Business School, Master in Management, 2019-2022).

Credit Rating Agencies

Credit Rating Agencies

img_SimTrade_Photo1_Raphael_Roero_de_Cortanze

In this article, Raphaël ROERO DE CORTANZE (ESSEC Business School, Grande Ecole Program – Master in Management, 2019-2022) explains how credit rating agencies work.

What are Credit Rating Agencies?

Credit Rating Agencies are private companies whose main activity is to evaluate the capacity of debt issuers to meet their financial commitments. The historical agencies (Moody’s, Standard & Poor’s and Fitch Ratings) hold about 85% of the market. But national competitors have emerged over the years, such as Dagong Global Credit Rating in China. Nonetheless, there is little competition in this market as the barriers to entry are very high. The rating agencies’ business model is based on remuneration paid by the rated entities, consulting activities, and the dissemination of rating-related data.

The rating gives an opinion (in the form of a grade) on the ability of an issuer to meet its obligations to its creditors, or of a security to generate the capital and interest payments in accordance with the planned schedule. The rated entities are therefore potentially all financial or non-financial agents issuing debt: governments, public or semi-public bodies, financial institutions, non-financial companies. The rating may also relate not to an issuer in general, but to a security.

S&P, Moody’s, and Fitch rating scales S&P, Moody's, and Fitch rating scales
Source: internet.

Rating agencies are key players in the markets. Indeed, ratings are widely used in the regulatory framework on the one hand, and also in the strategies of many investors. For instance, to be eligible for central bank refinancing operations, securities must have a minimum rating. Similarly, the management objectives of many investors are based on ratings: for example, a mutual fund may have as one of its objectives to hold 80% of assets issued by issuers rated at least “BBB”. Credit risk monitoring indicators in corporate and investment banks are also based on ratings.

Credit Rating Agencies: judges & parties during the subprime crisis?

Rating agencies played a crucial role in securitization (“titrisation” in French), a financial technique that transforms rather illiquid assets, such as real-estate loans, into easily tradable securities. The agencies rate both the securitized credit packages and the bonds issued as counterparts according to the different risk levels.

The securitization technique appeared in the 70’ in the US, and allowed banks to grant more loans. During the 1990’ and 2000’, banks used securitization as a way to remove from their balance sheet the loans they granted. Indeed, banks would package loans in vehicles labelled as “Asset Backed Securities” (securities which the collateral is an asset). Banks would then sell these securities, or sell the risk associated with these securities. In the case of subprimes, the loans were packaged inside vehicles called “Mortgage Backed Securities”, as these securities had as counterpart the mortgage loans. There was a shift from the previous “originate-to-hold” bank model (where banks originated the loans and kept them in their balance sheet) to the new “originate-to-distribute” model (where banks originated the loans and then took them out of their balance sheet).

Michel Aglietta explains that in the case of securitized loans (such as MBS), the rating agencies rate and are at the same time stakeholders in the securitization. Indeed, the constitution of the product and the rating are completely intertwined. “Without the rating, the security has no existence”. The investment banks that structure and market the product and the agencies work together to determine the specificities of each loan packages or “pools” and obtain the desired rating.

It is now recognized that rating agencies often overrated the securitized packages compared to the intrinsic risk they were carrying. By granting high grades to many securitized packages (the highest being AAA), they have contributed to the formation of a speculative bubble. In addition, when the housing market collapsed, the rating agencies reacted too late and downgraded MBS abruptly, which inevitably worsened the crisis. For example, 93% of the MBS rated AAA marketed in 2006 had their grade scaled down to “junk bond” ratings (BB+/Ba1 and below) later on.

Rating agencies have been accused of conflict of interest, as they are paid by those they rate. The emails revealed by the US Senate Investigations Subcommittee in April 2010 during its work on the Goldman Sachs affair reveal a system in which the marketing teams of structured products of investment banks tended to choose the agency most inclined to give the most favorable rating. Furthermore, the Senate subcommittee found that rating decisions were often subject to concerns about losing market share to competitors.

Key concepts

Mortgage loan

A mortgage loan has the specificity of putting the purchase property (a house for instance) as the counterpart of a loan. In the case of a payment default, the property is seized.

Related posts on the SimTrade blog

▶ Jayati WALIA Quantitative Risk Management

▶ Jayati WALIA Credit risk

▶ Rodolphe CHOLLAT-NAMY Credit analyst

▶ Jayati WALIA My experience as a credit analyst at Amundi Asset Management

Useful resources

La Finance pour Tous

Aglietta M. (2009) La crise : Pourquoi en est arrivé là ? Michalon Editions.

Ministère de l’Economie et des Finances Quel rôle ont joué les agences de notation dans la crise des subprimes ?

Marian Wang (2010) Banks Pressured Credit Agencies, Then Blamed Them Later on Blog.

About the author

Article written in May 2021 by Raphaël ROERO DE CORTANZE (ESSEC Business School, Master in Management, 2019-2022).

The Internal Rate of Return

The Internal Rate of Return

img_SimTrade_Photo1_Raphael_Roero_de_Cortanze

In this article, Raphaël ROERO DE CORTANZE (ESSEC Business School, Grande Ecole Program – Master in Management, 2019-2022) explains the financial concept of internal rate of return (IRR).

What is the Internal Rate of Return?

The Internal Rate of Return (IRR or “TRI” – “taux de rendement interne” in French) of a sequence of cash flows is the discount rate that makes the Net Present Value (NPV or “VNP” or “VAN” for “valeur nette présente” or “valeur actuelle nette” in French) of this sequence of cash flows equal to zero.

Screenshot 2021-05-31 at 21.59.49

In order to calculate the IRR, two methods can be used. First of all, use the Excel “IRR” formula on the sequence of cash flows, which will automatically display an approximate value for the IRR. Nonetheless, if Excel is not available for performing the IRR calculation, you can use the dichotomy method (which is indeed used by Excel). The dichotomy method uses several iterations to determine an approximation of the IRR. The more iterations are performed, the more accurate the final IRR output is. For each iteration, the table below assesses whether the NPV using the “Average” discount rate is positive or negative. If it is negative (resp. positive), it means the IRR is somewhere in between the “Lower bound” (resp. “Upper bound” and the “Average”) and the next iteration will thus keep the same “Lower bound” (resp. use the “Average” as the new lower bound) and use the “Average” as the new “Upper bound” (resp. keep the same “Upper bound”). After 10 iterations, the table displays an IRR of 18,457%, which is an approximation to the nearest hundredth of the 18,450% IRR calculated with the Excel formula.

Screenshot 2021-05-31 at 22.08.50

The IRR criterion

In the same way as the NPV, the IRR can be used to evaluate the financial performance of:
A tangible investment: the IRR criterion can be used to evaluate which investment project will be the most profitable. For instance, if a firm hesitating between Project A (buying a new machine), Project B (upgrading the existing machine) and Project C (outsourcing a fraction of the production), the firm can calculate the IRR of each project and compare them.
A financial investment: whether it is a bank investment or a private equity investment (purchase of a company) the IRR criterion can be used to sort different projects according to their financial performance.

Disaggregating the IRR

Investors and especially Private Equity firms often rely on the IRR as one measure of a project’s yield. Projects with the highest IRRs are considered the most attractive. The performance of Private Equity funds is also measured through the IRR criterion. In other words, PE firms use the IRR to select the most profitable projects and investors look at the IRR of PE funds when choosing to which PE firms’ fundraising campaign, they will participate in.

Nonetheless, IRR is the most important performance benchmark for PE investments, the IRR does not go into detail. Indeed, disaggregating the IRR can help better understand which are the different components of the IRR:

  • Unlevered IRR components:
    • Baseline return: the cash flows that the acquired business was expected to generate without any improvements after acquisition.
    • Business performance: value creation through growth by improving the business performance, margin increase and capital efficiency improvements.
    • Strategic repositioning: value creation through by increasing the opportunity for future growth and returns (innovation, market entries etc.).
  • Leveraged IRR: PE investments heavily rely on high amounts or debt funding (hence the wide use of Leverage Buy-Out or LBO). Debt funding allows to resort to less equity funding, thus mechanically increasing the IRR of the investment.

Each of these components can have different proportions in the IRR. As an example, we can consider two PE funds A and B displaying the same IRR of 30%. After disaggregating each fund’s IRR, we come up with the following table, showing the weight of each IRR component in the total IRR (or “Levered IRR”). From this table, we understand that Fund A and Fund B have very different strategies. Fund A focuses in its PE operations on improving the business performance and carrying out strategic repositioning’s. Only 23% of the total IRR comes from financial engineering. In contrast, Fund B draws most of its performance from financial engineering, while only 23% of the total IRR comes from the unlevered IRR.

Screenshot 2021-05-31 at 22.09.00

Through this example we understand that PE funds and firms can have very different strategies, while disclosing the same IRR. Thus, disaggregating the IRR can reveal the positioning of PE funds. Finally, disaggregating the IRR also allows to assess whether PE funds are true to the strategy they display: for instance, a fund can be specialized in strategic repositioning and business performance improvements on the paper, but drawing most of its value creation through financial engineering.

Related posts on the SimTrade blog

   ▶ Jérémy PAULEN The IRR function in Excel

   ▶ Léopoldine FOUQUES The IRR, XIRR and MIRR functions in Excel

   ▶ William LONGIN How to compute the present value of an asset?

   ▶ Maite CARNICERO MARTINEZ How to compute the net present value of an investment in Excel

   ▶ Sébastien PIAT Simple interest rate and compound interest rate

Useful resources

Prof. Longin’s website Calcul de la VNP et du TRI d’une séquence de flux (in French)

Prof. Longin’s website Méthode de dichotomie pour le calcul du TRI (in French)

McKinsey A better way to understand internal rate of return

About the author

Article written in June 2021 by Raphaël ROERO DE CORTANZE (ESSEC Business School, Grande Ecole Program – Master in Management, 2019-2022).

Why was 2020 a record year in terms of financial market returns?

Why was 2020 a record year in terms of financial market returns?

img_SimTrade_Photo1_Raphael_Roero_de_Cortanze

2020: a year of all records

The year 2020 has been the scene of the greatest economic downturn since the Great Depression and the fastest market collapse on record. From mid-February onwards, stock markets have plummeted. In one month, the Paris stock market fell by nearly 40% and the New York stock market by more than 30%. On March 16, the Dow Jones lost 13%, topping the October 1929 Black Monday slide of 12,82% (the biggest Dow Jones fall still being the “Black Monday” October 1987, where it lost 22,6% in a day). It took only 16 trading days for the Dow Jones to push into bear market territory, while the S&P 500 lost 34% in only 33 trading days. The speed of the crash was unprecedented.

Stock_market_crash_(2020).svg

The rebounds were also spectacular. As of June 30, Wall Street recorded its best quarter since 1998. In November, the European stock markets experienced the strongest monthly increase in their history, with an 18% jump in the Euro Stoxx 50 and a 20% jump in the CAC 40.

Over the whole year 2020, 88% of the major asset classes have returned positively. The American markets have been the big winners. The Dow Jones gained more than 6%, while the Nasdaq Index jumped more than 43%. Amazon’s share price has risen by more than 70%, followed by Apple with more than a 50% increase and Facebook and Google with a 30% increase. Some increases are spectacular, such as those of the biotech company Aytu BioScience, jumping more than 500%, or Tesla, which recorded a rise of more than 600%.

The Paris Stock Exchange has ended 2020 in the red, but with a moderate decline of around 6% in the CAC 40 index, after the record year of 2019 (when the index of the 40 main French stocks had risen by 26%, its best performance in twenty years). European markets have not experienced such a powerful rebound 2020, as evidenced by the Euro Stoxx 50 index, which lost over 4%.

Why did the markets have bounce back much faster than the real economy?

Stock markets crashed in 2020 because of the uncertainty and the fear shared by investors about the impact of the Covid-19 crisis. When the World Health Organization (WHO) declared the disease a pandemic, countries began locking down, fear and uncertainty spread through the market, leading towards unprecedented asset sales.

If the rebound of markets has been so fast, it is because of the immediate response of Central Banks and governments. The massive asset buyback programs led by Central banks as well as state aids, loans and repayment facility programs have help to reassure investors. Indeed, investors view the markets as forward-looking, anticipating how economies and corporate earnings would perform in the upcoming months and years. In this context, the decorrelation between markets and real economy is not strange, as markets have immediately bet on a return to normalcy in a relatively short time frame.

What could come next?

2020 was the year of all records. The total amount of equity raised during IPOs in the US ($156 billion) topped the 1999 internet bubble record. Thanks to the wide response of Central banks and governments, confidence has returned and investors started taking risks again. 420 IPOs were performed in the US in 2020, which represents an 88% increase compared to 2019.

The stock market performance of certain technology companies and the craze for IPOs appears quite reminiscent of the atmosphere of beginning of the millennium, just before the burst of the internet bubble. Experts are puzzled. Hervé Goulletquer, Deputy Director of Research at La Banque Postale Asset Management has declared that “If we look at current valuations, this means that the health shock has had no medium-term impact on corporate earnings. That’s a bit of a stretch.” Indeed, The GAFAMs have seen their stock market valuation double between January 2019 and July 2020. They now weigh about a quarter of all stocks in the U.S. S&P 500 stock index. Together, the GAFAMs are worth more than the GDP of Japan, Germany or France!

gafam_valur_bourse_800

If tech companies have outperformed this year, it is not the case for sectors such as industry and manufacturing, which are still struggling to emerge from the covid crisis as they took a bigger hit due to social-distancing measures and lockdowns.

On the one hand, if the old economy has not collapsed, it has resorted to debt like never before. Tech giants, on the other hand, are more and more dominant. Microsoft, Amazon and Google are now the only three members of the very exclusive club of companies with a market capitalization above 1,000 billion dollars.

During the year 2020, the appetite for tech has turned into a fever. Will this frenzy burst into a second internet bubble? Time will tell…

Key concepts

Bear market

A bear market is a period of persistent price declines. Declines in stock prices are 20% or more from recent highs and are fueled by pessimism or negative market sentiment. Bear markets are most often associated with declines in an overall market or in a particular index such as CAC 40, Dow Jones etc.

S&P 500

The S&P 500 index is a stock market index based on the 500 largest companies listed on stock exchanges in the United States. The index is owned and managed by Standard & Poor’s, one of the three major credit rating companies. It covers approximately 80% of the U.S. stock market by capitalization.

NASDAQ

NASDAQ (short for National Association of Securities Dealers Automated Quotations) is currently the second largest U.S. equity market, by volume traded, behind the New York Stock Exchange. The NASDAQ index, also known as “the NASDAQ”, is the stock market index that measures the performance of the companies listed on it.

Dow Jones

The Dow Jones Industrial Average (DJIA) or Dow Jones, is a stock market index that measures the stock performance of 30 large companies listed on stock exchanges in the United States.

Euro Stoxx 50

The Euro Stoxx 50 a stock market index for the euro zone. Like the CAC 40 for France, the Euro Stoxx 50 groups 50 companies according to their market capitalization within the euro zone.

Useful resources

https://www.thebalance.com/dow-jones-closing-history-top-highs-and-lows-since-1929-3306174

https://www.thebalance.com/fundamentals-of-the-2020-market-crash-4799950

https://edition.cnn.com/2020/12/31/investing/dow-stock-market-2020/index.html

https://www.bloomberg.com/news/articles/2020-12-21/stock-market-in-2020-bear-market-for-humans-while-dow-and-nasdaq-hit-records

https://www.theguardian.com/business/2020/dec/30/ive-never-seen-anything-like-it-2020-smashes-records-in-global-markets

https://www.bfmtv.com/economie/entreprises/2020-annee-record-sur-les-marches-americains_VN-202012090039.html

https://www.lemonde.fr/economie/article/2020/12/30/une-folle-annee-2020-sur-les-marches-financiers_6064796_3234.html

https://eu.usatoday.com/story/money/2020/08/19/stock-market-record-economy-recession-coronavirus-pandemic-recovery/3345090001/

About the author

Article written in June 2021 by Raphaël ROERO DE CORTANZE (ESSEC Business School, Master in Management, 2019-2022).

Inflation & deflation

Inflation & deflation

img_SimTrade_Photo1_Raphael_Roero_de_Cortanze

In this article, Raphaël ROERO DE CORTANZE (ESSEC Business School, Master in Management, 2018-2022) describes the main mechanisms at the origin of inflation and deflation episodes, providing historical examples.

Inflation

Definition

Inflation is a movement of increase in the general price level (all products and not a few products) in an economy. It is a self-sustaining movement over several years. Measuring inflation is complex. Historically, inflation has been calculated by monitoring the evolution of a fixed basket of day-to-day products (such as milk, bread, etc.).

If your local supermarket suddenly increases its prices, it is not inflation: it is a microeconomic and located event that is the consequence of a human decision. In the same way, a sudden price increase following a tax increase is not considered as inflation.

Maintaining a level of inflation is one of the objectives of the Central Banks, which manipulate interest rates to reach their inflation target (2% for the European Central Bank). Indeed, low inflation is often beneficial for the economy, as it guarantees monetary and economic stability, and in particular helps to avoid deflationary spirals.

The origin of inflation

Firstly, inflation can be the result of imbalances between supply and demand:

  • Demand increases faster than supply (Keynesian approach): inflation occurs when the use of the means of production is at a maximum (it is not possible to produce more) and imports are unable to compensate the lack of domestic supply. The excess aggregate demand pushes up the prices as supply cannot follow.
  • A sudden fall in supply: in Germany in 1922, bad crops and a 30% drop in the industrial production in 1923 created a wave of hyperinflation as the supply couldn’t cope with the demand.

Secondly, inflation can be the result of evolution of productive constraints and price movements:

  • Wages increase more rapidly than the productivity of labor: companies increase their prices to maintain their margins, which creates inflation. William Baumol (American economist – the Baumol law) explained in 1966 that wage increases in less productive sectors rise in parallel with wage increases in more productive sectors. These increases, which are not justified by productivity arguments, result in inflation.
  • An increase in the production price per unit (for instance in the case of a sharp increase in the price of commodities) can result in inflation if companies can increase their prices to maintain their margins.

Finally, the expectations of economic agents can amplify the effect of inflation. If they expect a high inflation, the number and amount of transactions will increase, as they try to get rid of cash rapidly (in case of hyperinflation, the currency can lose its value very quickly), which will amplify inflation. It is the mechanism of “flight from money”.

The post WW1 German hyperinflation

Screenshot 2021-05-22 at 15.53.04
The stage of hyperinflation is reached when the rise in prices exceeds 50% per month. After WW1, the Treaty of Versailles imposed reparations on Germany. Quickly after, the fear that Germany would not be able to pay its reparations and debts spread. As a consequence, the value of the mark decreased in comparison to other European currencies. At the same time, the German government artificially injected money while Germany experienced a sharp decrease. These three phenomena translated into inflation, which was accelerated by the mechanism of “flight from money”. The average monthly rise in prices went beyond 300%. Germany managed to get out of this inflationary episode thanks to drastic measures: the introduction of a new currency, the capping of governmental money injection in the economy, austerity measures and debt rescheduling.

Deflation

Definition

Deflation is not to be confused with disinflation: disinflation is characterized by a decrease in the rate of inflation, whereas deflation happens when the prices decrease. Deflation is downward trend in the general price level over several years and similar to inflation, it is cumulative and self-sustaining. Deflationary episodes are much less common than inflationist periods.

The origins of deflation

Deflation mainly comes from imbalances between demand and supply:

  • Demand collapses compared to supply: Keynes explains that a collapse in private investment and savings can lead to a decrease in prices and salaries, as firms will try to sell their unsold products and maintain their margin. Due to wage decreases, consumption is depressed, which reduce the demand and pushes companies to further lower prices.
  • Supply increases suddenly: a sudden decrease in the price of commodities, labor cost or an acceleration of productivity gains can lead to disinflation, and eventually to deflation as firms will be able to decrease their prices. In this case, it is possible for deflation and growth to coexist, especially if productivity gains are high enough.

The Japanese deflation

In this two-decades deflationary episode, structural factors combined with macroeconomic events. In terms of structural factors, the increase in relocations to China, the sharing of added value to the detriment of employees and the aging of the population created a situation of weak and sluggish demand. In 1984, the Oba-Sprinkle agreements (which imposed a deregulation) lead to a continuous appreciation of the yen, which translated into an increased profitability of financial investments and therefore an influx of foreign capital. Fearing a speculative bubble, the Bank of Japan raised its key interest rate abruptly in 1992. The bubble burst, causing an economic slump. Households and banks became very cautious, leading the country into a dynamic of price decreases for over 20 years. Japan gradually emerged from this deflationary episode thanks to the reflationary policy conducted by Shinzo Abe since 2012.

Key concepts

Reflation policy

Reflation policy is the act of stimulating the economy by increasing the money supply or reducing taxes, seeking to return the economy to its long-term trend. This is the opposite of disinflation, which aims to bring inflation back to its long-term trend.

Useful resources

Solow and Samuelson (1960), Analytical aspects of anti-inflation policy, The American Economic Review.

Kaldor (1985) The scourge of monetarism.

Baumol (1966) Performing Art: The Economic Dilemma.

JM Keynes (1936), The General Theory of Employment, Interest and Money.

About the author

Article written in June 2021 by Raphaël ROERO DE CORTANZE (ESSEC Business School, Master in Management, 2019-2022).

Gamestop: how a group of nostalgic nerds overturned a short-selling strategy

Gamestop: how a group of nostalgic nerds overturned a short-selling strategy

img_SimTrade_Photo1_Raphael_Roero_de_Cortanze

In this article, Raphaël ROERO DE CORTANZE (ESSEC Business School, Grande Ecole Program – Master in Management, 2019-2022) talks about the Gamestop case which has shaken up Wall Street last january.

Gamestop: an unprofitable company with slender turnaround prospects

Gamestop is a US company specializing in the distribution of video games and electronic equipment (similar to Micromania in France). After golden years in the 1990’ and 00’, Gamestop has sunk since 2010 into a spiral of debt and successive sales of its stores around the world. The company’s response has been to cut costs and shut down underperforming stores, rather than trying to adapt to new trends of consumer behavior. Indeed, physical stores have lost momentum over the years, this decrease being powered by the rise of e-commerce and recently COVID-19 and lockdown restrictions. Hence, at the end if 2020, Gamestop’s future appear to be bleaker than ever.

Last January, Gamestop became the target of a short-selling strategy (see below) by several hedge funds. In a short-selling strategy, hedge funds bet on the decrease of a stock to pocket profits. But, retail investors came into action to “save” Gamestop from the claws of these hedge funds.

Indeed, in the United States, the stock market has opened up in recent months to small investors. Since the beginning of the Covid-19 crisis, many stocks have fallen, allowing an entry into the world of the stock market with little investment. Thus, students, employees or even retirees have been tempted. After having learned that some hedge funds were betting on a decrease of Gamestop’s stock, a retail investor began buying Gamestop stock on the Robinhood application, then calling on Reddit for other retail investors nostalgic of Gamestop to come to the rescue and buy more Gamestop’s stock to increase the stock price. Their strategy paid off: the stock price surged up to 1400% and the hedge funds had to incur losses.

What is short-selling strategy?

A short-selling strategy revolves around selling something you do not own. If you do not own something you want to sell, you can borrow it, sell it and then give it back at the end of the borrowing time. A short-selling strategy can be simplified into 3 steps:

  • Investor A (that can be a hedge fund) borrows a number N of shares of the targeted companies from Investor B (usually an ETF or a mutual fund through a broker)
  • Investor A sells the borrowed shares to Investor C at a price p
  • When it’s time to give the shares back to Investor B (the lender), Investor A buys back N shares of the targeted company at the price p’ and gives them back to Investor B with fees f. Investor A pockets the following profit: (N * p) – (N * p’) – f = N * (p – p’) – f

In other words, a short-selling strategy bids on the fact the stock price of the targeted company will drop between the moment Investor A sells the shares it has borrowed, and the moment it buys them back to give them back to Investor B with fees.

Hedge funds pocket money only and only if the selling operation yields more than the absolute value of buying the shares back and paying the fee. This is why hedge funds target companies of which the stock price is expected to fall, due to poor financial management or bleak turnaround prospects. In this case, Gamestop was the perfect candidate for a short-selling strategy.

The lessons of the Gamestop case

Due to the mayhem around Gamestop’s stock price, Robinhood had to block its retail customers from purchasing GameStop shares because of a “too volatile” price (while hedge funds were still able to trade elsewhere). GameStop achieved its first quarterly sales increase in two years during Q1 2021, thanks to the notoriety brought by the case. Nonetheless, the hype around GameStop has quickly come to an end, as it is still an unprofitable company with slender turnaround prospects. The fall is GameStop stock price following the end-of-January records and the recent events demonstrate it. At the beginning of April, GameStop announced it may sell up to $1bn of additional shares as it looks to take advantage of the Reddit-driven trading frenzy. This announcement was quickly sanctioned by the market, and the stock price fell.

This demonstrates that a hype created by nostalgic retail investors is not sufficient to entail a turnaround of the financial situation of GameStop. It still has some major management problems, such as wages below average. A Stanford University Management Professor, Jerry Davis, argue on this case that “Rescuing an extremely low-wage employer from short-sellers by pumping up its stock is not exactly storming the Bastille.”

A few retail investors pocketed a lot of money by selling their GameStop shares at the right moment. But the majority were caught up by the harsh reality of the market and the decline in the stock price. Will GameStop be able to take advantage of the frenzy around its stock price to bring measures and decision which could make its future better without being sanctioned by the market? Time will tell.

Related posts on the SimTrade blog

▶ Akshit GUPTA Short Selling

▶ Shruti CHAND Robinhood

Useful resources

The Financial Times (February 25, 2021) GameStop shares extend surge in early trading

The Financial Times (April 5, 2021) GameStop shares fall after it announces plan to sell up to $1bn in stock

The Financial Times (February 7, 2021) The biggest lesson of GameStop

Vincent Matalon (February 7, 2021) Raid sur le cours boursier de GameStop : des investisseurs amateurs racontent pourquoi ils se sont pris au jeu France Info

About the author

Article written in June 2021 by Raphaël ROERO DE CORTANZE (ESSEC Business School, Grande Ecole Program – Master in Management, 2019-2022).

How do "animal spirits" shape the evolution of financial markets?

How do “animal spirits” shape the evolution of financial markets?

img_SimTrade_Photo1_Raphael_Roero_de_Cortanze

In this article, Raphaël ROERO DE CORTANZE (ESSEC Business School, Grande Ecole Program – Master in Management, 2018-2022) explores the concepts of rationality of economic agents and animal spirits to explain the behavior of individuals in financial markets.

A rational economic agent at the heart of classical and neo-classical approaches

Since the dawn of economic theory, the classical school of thinking has defended the vision of a rational economic agent. Adam Smith’s concept of “invisible hand” and his vision of the division of labor and free trade are all based on the hypothesis of a rational economic agent.

Later, the neoclassic movement introduced the concept of “homo economicus”, a theorical representation of the human’s rational behavior.

  • A homo economicus can maximize his satisfaction by making the best use of his resources: he will maximize his utility.
  • A homo economicus knows how to analyze and anticipate the situation and events in the world around him in order to make decisions that will maximize his satisfaction.

If we attribute these rational characteristics to all economic agents, and if the market is completely free (the conditions of pure and perfect competition are met), then it is possible to build economic models that maximize everyone’s utility. Pareto’s optimum theory is based on the hypothesis all economic agents are rational. It is the same for Léon Walras, which explains that through the process of the Walrasian auction (“tâtonement walrasien” in French), it is possible to find the market equilibrium.

These theories paved the way to Eugene Fama’s market efficiency theory. A market is informationally “efficient” if the market price for a financial asset incorporates all relevant information available to market participants. As a consequence, statistically speaking, the best forecast of the future price is the present price, and the asset price follows a random walk with unpredictable future price changes. Economically speaking, the price of securities corresponds to their fundamental or intrinsic value, thus allowing an optimal allocation of resources. He thus rejected the post-1929 theories of behavioral research which had concluded that cognitive, emotional and collective imitation errors distort price formation. He re-examined the impact of market anomalies on market efficiency and concluded that the market efficiency hypothesis is finally resistant to the long-term rate anomalies put forward by the Keynesian and behavioral literature.

“Animal spirits”: a Keynesian counter-theory to the behavior of economic agent

The rational economic agent theory has been heavily criticized by behavioral research, sociology, and the Keynesian school. The French sociologist Pierre Bourdieu argued that the “myth” of the homo economicus is challenged by behavioral realities. Neoclassical economic theories are based on assumptions of behaviors (e.g. consumption) that are always sophisticated and rational, ignoring the fact that people also have their “little habits” linked to their past and their close environment. Not everyone manages and rationalizes its budget as a homo economicus would.

For Keynes, it is not certain that individual agents are rational, and it is not certain that the combination of individual decisions leads to an optimal collective situation. According to him, market imbalances are due to the instable behavior of economic agents. They respond to spontaneous expectations (“animal spirits”) through overconfidence and optimism, which lead to cyclical disturbances. Furthermore, Keynes argues that economic agents adopt a mimetic behavior: they elaborate their strategy according to that of the others. Contrary to the neoclassicals, he considers that there is no solid (i.e. non-probabilistic) basis for defining long-run expectations: the economic cycle lies in the endogenous instable behavior of economic agents. It is for this reason that he considers that it is possible that the regulatory action of the public power is preferable to the free play of the individual initiative.

A cohabitation of rationality and “animal spirit”

In view of recent market developments, it is fair to suggest that there is some cohabitation between rationality and “animal spirits” in the financial market. Indeed, it is indisputable that prices in the markets are governed in most cases by trends that are found so often that they become rules of operation. For instance, in most cases, after the issuance of a dividend, the offer and supply will adjust the stock price (in this case decrease it) in order to match the dividend issuance: the stock price falls by the amount of the issued dividend. Similarly, in the case of an M&A transaction announcement, the stock price of the target usually increases towards the offer price proposed by the acquirer. Markets are therefore imbued with a certain rationality, notably because economic agents seek to maximize their profit.

Nonetheless, if trends and mechanisms can be found in the markets, exceptional and sudden variations in stock prices are due to non-rational and mimetic behaviors. Herd behaviors can drive sudden spikes or drops. The GameStop frenzy is a good example of this herd dynamic, where the call of one user of Reddit to buy GameStop’s stock resulted in a frantic rush that caused the stock price to soar for a few days. Similarly, the crises of 1929, 1987 and 2008 are characterized by the same irrational herd behaviors. The fear of some investors due to a new information arriving on the market spread like wildfire and fueled a global panic, leading to a stock market crash.

To conclude, economic agents are globally rational because they generally seek to maximize their situation. Nevertheless, this rationalization should not be exaggerated, as it can also be biased by the intervention of external and internal factors (such as “animal spirits”). Financial speculation and the creation of bubbles demonstrate that the economic agent, even when aware of the absurdity of the situation, can still contribute to making it worse (herd instinct).

Key concepts

Walsarian auction

The equilibrium price can be found through a “trial and error” process, which will allow to adjust little by little the demand to the supply. This “trial and error” process is often designed as a spiral on a graph representing simultaneously demand and supply, spiral which will end at the point of intersection of the two functions – the market equilibrium.

Related posts on the SimTrade blog

   ▶ Shruti CHAND WallStreetBets

   ▶ Raphaël ROERO DE CORTANZE Gamestop: how a group of nostalgic nerds overturned a short-selling strategy

   ▶ Alexandre VERLET The GameStop saga

Useful resources

Academic articles and books

Ackerman, F. (2000) Still Dead After All These Years: Interpreting the Failure of General Equilibrium Theory Working paper.

Bourdieu P. (2000) Les structures sociales de l’économie.

Fama E. (1970) Efficient capital markets a review of theory and empirical work Journal of Finance 25(2) 383-417.

Fama E. (1998) Market efficiency, long-term returns and behavioral finance Journal of finance Economics.

Keynes J.M. (1936) The General Theory of Employment, Interest and Money.

Press

Financial Times (02/10/2021) How herd behaviour drives action on r/WallStreetBets

Videos

Emergent Order YouTube channel (2010) Fear the Boom and Bust: Keynes vs. Hayek – The Original Economics Rap Battle!

About the author

Article written in May 2021 by Raphaël ROERO DE CORTANZE (ESSEC Business School, Grande Ecole Program – Master in Management, 2019-2022).

Could the COVID-19 debt be wiped out?

Could the COVID-19 debt be wiped out?

img_SimTrade_Photo1_Raphael_Roero_de_Cortanze

In this article, Raphaël ROERO DE CORTANZE (ESSEC Business School, Master in Management, 2018-2022) discusses the current debate surrounding the cancellation of the covid debt.

In March 2020, the French President Emmanuel Macron announced during a televised speech that the French government would “mobilize all necessary means […] to save lives, whatever the cost”. In one year, the “whatever the cost” has resulted in a sharp increase of the French national debt from 100% of GDP in March 2020 to 120% in March 2021. In 2020, debt increases and money creation have taken on unprecedented proportions. The Federal Reserve in the US and the Eurosystem in Europe have injected nearly $3 trillion and $2 trillion respectively in the economy.

For many months now, economists in Europe have been calling for a cancellation of the “Covid-debt”. What are their arguments? Why do some refuse to consider this option? What could be the consequences of such a cancellation?

How does public debt work in Europe?

The Article 123 of the Treaty on the Functioning of the European Union forbids the European Central Bank (ECB) to finance and refinance directly the members of the Eurozone. The ECB can only acquire national debt securities such as treasury bills through the secondary market: it has to repurchase the securitizes from other investors which purchased them on the primary market in the first place (where the national debt securities were first emitted).

The European national debts are mainly held (75%) by other States and institutional investors such as banks and insurance companies. The remaining 25% are held by the ECB. The debate around the covid-debt cancellation is solely focused on the 25% held by the ECB. In effect, the very idea of cancelling some of the remaining 75% of debt hold by other States and investors is inconceivable (it would immediately undermine the European union credibility, which would increase the risk linked to national European state securities, thus increasing the cost of debt financing for European countries).

Why should the Covid debt be wiped out — and why it shouldn’t

In February, 150 economists from 13 European countries (such as Thomas Piketty or Gaël Giraud) explained in an opinion page published in Le Monde, that accumulated public debt had reached a level too high to be entirely paid out without a drastic austerity that would damage European economies. They highlighted the fact that raising taxes and/or reduce public spending would have devastating social consequences.

Furthermore, according to Thomas Piketty, as 25% of the European debt is hold by the Eurosystem, which group the ECB and national central banks (such as “Banque de France”), this is equivalent to consider that European countries hold 25% of their own debt. Hence the fact that these 25% of debt are a zero-sum game. He also argues that as “it is unlikely that the ECB […] will ever decide to put these securities back on the markets or to demand their repayment, the decision to no longer count them in the total public debt could be taken now”.

From this perspective, several right and left wing public figures (such as former minister Arnaud Montebourg or economist Alain Minc) advocate for a cancellation of these 25% of debt or a conversion into a perpetual debt with a zero-percent interest rate.

On the other side of the arena, according to those who are against the cancellation, it is forbidden to cancel the debt. Christine Lagarde herself (President of the ECB) has declared such a cancellation is “unthinkable” as it would be a “violation of [the article 123 of] the European treaty” which forbids the ECB to finance and refinance directly Eurozone states.

Furthermore, in the strictest sense, the debt of Eurozone countries is held by the Eurosystem. This implies that European national debt securities generate interests, which are paid back members of the EU. This cash-flow would be cut-off if the debt were to be cancelled or converted into a zero-interest long-term debt.

Finally, some economists like Jean Pisany-Ferry (who backed of the French President Emmanuel Macron during the last 2017 presidential campaign) and Henri Sterdyniak compare this cancellation solution to a “mystification” and a “fake theory”. Cancelling the debt would make the Eurozone States “neither richer nor poorer”. According to them, the 25% of debt held by the Eurosystem is a real debt. Thus, the Covid-debt issue should be addressed with “real economic arguments” like reducing public spending to avoid future macroeconomic imbalances, rather than using a “magic trick to hide public debts”.

What could be the consequences of such a cancellation?

The opponents to this option explain that a debt cancellation goes against the long-term goal of the Eurosystem of a having a controlled inflation rate. Indeed, when a country increases its debt, it receives the amount of money lent through money creation. Money creation is supposed to increase the inflation rate in the long run. Nonetheless, the reimbursement of a debt translates into money destruction. In a perfect world without inflation, the reimbursement of a debt destroys the exact amount of money created to issue the debt, resulting in no inflation effect. Cancelling the debt would thus remove the destruction phase of money creation, which could result in the long run in an increased inflation way above the targeted inflation.

Furthermore, cancelling the debt would undermine the ECB reputation. In another opinion page published in Le Monde newspaper, 80 economists explain that “the supposed alleviation from a cancellation would be quickly cancelled out by the risk premium that the markets would inevitably charge on the signatures of the euro zone member states”. In other words, the loss in credibility of the ECB implied by the cancellation of the debt would increase the interest rate of national Eurozone national securities, thus making the financing of public debt more expensive for Eurozone states and riskier for investors.

The advocates of debt cancellation reply that the risk of creating an uncontrollable inflation is minimal, as the amount of money released by the debt cancellation would be invested in the real economy and support investments, job creation etc. To the argument of loss of credibility, Thomas Piketty replies that an unprecedented situation (the Covid crisis) requires unprecedented means of action.

Amidst this debate, what appears to be certain is that the sharp increase in public debt doesn’t threat public finances in the short run. Nevertheless, this debate introduces relevant questions for the long term, especially in the Eurozone where it could question its model. Finally, if efforts have already been made in favor of developing countries notably by the International Monetary Fund (IMF), associations such as OXFAM call for the pure and simple cancellation of the debts of these countries in order to allow them to survive the Covid crisis.

Key concepts

Eurozone

The Eurozone is a monetary union of 19 member states of the European Union that have adopted the euro as their primary currency. The monetary authority of the eurozone is the Eurosystem. The eurozone is comprised of Austria, Belgium, Cyprus, Estonia, Finland, France, Germany, Greece, Ireland, Italy, Latvia, Lithuania, Luxembourg, Malta, the Netherlands, Portugal, Slovakia, Slovenia, and Spain.

Eurosystem

The Eurosystem is comprised of the ECB and the national central banks of the 19 member states that are part of the Eurozone. The national central banks apply the monetary policy of the ECB. The primary objective of the Eurosystem is price stability, followed by systemic stability and financial integration.

Useful resources

Sources: Le Monde, Les Echos, Oxfam, European Union Law

https://www.lemonde.fr/idees/article/2021/02/05/la-bce-peut-offrir-aux-etats-europeens-les-moyens-de-leur-reconstruction-ecologique-sociale-economique-et-culturelle_6068861_3232.html

https://www.lemonde.fr/idees/article/2020/06/12/la-bce-devrait-des-maintenant-annuler-une-partie-des-dettes-publiques-qu-elle-detient_6042636_3232.html

What to do with Covid debt?

https://eur-lex.europa.eu/legal-content/FR/TXT/HTML/?uri=CELEX:12008E123&from=FR

https://www.lemonde.fr/idees/article/2020/05/16/jean-pisani-ferry-annuler-la-dette-c-est-toujours-en-transferer-le-fardeau-a-d-autres_6039837_3232.html

Annuler la dette des pays pauvres : une mesure d’urgence face au coronavirus

https://en.wikipedia.org/wiki/Eurozone

https://www.ecb.europa.eu/ecb/orga/escb/eurosystem-mission/html/index.en.html

About the author

Article written in April 2021 by Raphaël ROERO DE CORTANZE (ESSEC Business School, Master in Management, 2019-2022).

How has the 21st century revolutionized financing methods?

How has the 21st century revolutionized financing methods?

img_SimTrade_Photo1_Raphael_Roero_de_Cortanze

In this article, Raphaël ROERO DE CORTANZE (ESSEC Business School, Master in Management, 2018-2022) explains how the 21st century revolutionized financing methods.

In The Crisis in Keynesian Economics (1974), the British economist John HICKS described how the world economy shifted during the 20th century from the autoeconomy model to the overdrafteconomy model. An autoeconomy is an “equity” economy, dominated by self-financing and capital market financing. An overdrafteconomy is a “debt” economy, where financing is provided through debt by an intermediary (a bank or credit institution).

What were the reasons which led to this shift from autoeconomy to overdrafteconomy? Why do the evolution of markets and investment regulations during the second half of the 20th century question the typology described by John Hicks in 1974?

From the Industrial Revolution to the 1920s: the development of the autoeconomy model

In the beginning of the 19th century as the first wave of industrialization gained momentum across Europe and North America, the relative peace following the end of Napoleonic wars helped cut public spending. This period brought unparalleled increases in revenue, profit and cash flows, allowing both firms and governments to benefit from tremendous surplus and self-investing capacities. For instance, during the 19th century, the UK was able to reduce dramatically its public debt thanks to unprecedented budget surplus.

Meanwhile, financial markets were gradually asserting themselves as key players in financing the economy. Stock exchanges, which were until then mainly open government bonds, started to allow companies to seek additional financing. Companies started to combine more and more self-financing and capital market financing. The passion for the financial markets also affected the general public. In France in 1911, 45% of the inheritance in the bourgeoisie involved securities. In 1914 there were 2.4 million individual security holders (for a population of 42 million).

Until the end of the Roaring Twenties, the stock market was still very attractive. European governments financed the increase of public debt induced by the First World War through capital market financing. Even though the banking system was also developing in parallel, the financing of the economy remained dominated by financial markets and self-financing.

From the Wall Street Crash of 1929 to the 1970s: the shift towards the overdrafteconomy model

On Monday 28 October 1929 (Black Monday), the greatest sell-off of shares in US history was recorded. The Great Crash quickly spread to Europe, and with it a feeling of mistrust towards financial markets settled in. Following the 1929 crash, the first steps of banking regulation contributed to transitioning from the autoeconomy model to the overdrafteconomy model. Indeed, a separation was introduced between retail and investment banks, in order to reduce the impact of a future financial crisis on real economy (the Glass Steagall Act in 1933 in the US). In France, a deposit insurance scheme was introduced in 1934.

On the one hand, the loss of credibility of financial markets, and on the other hand the revival of banking regulation translated into a shift in financing methods. Numerous countries, such as France and Japan, used bank financing to finance the post World War II reconstruction. In most Western countries (except for the US and UK), companies and governments began preferring bank financing to capital markets financing and went into bank debt (hence the “overdraft” economy – where the economy spends more than it produces) to finance their activities.

Since the 1970s: the development of new financing methods

From the 1970s, two phenomena made financial markets appealing again, by making them more liquid and more accessible:

  • Financial deregulation: end of the stockbrokers’ monopoly, introduction of derivatives, abolition of regulations that hindered the free international movement of capital, etc.
  • Departitioning between national and international markets and between debt and stock markets.

Furthermore, the separation between retail and investment banks was abolished (in 1979 in the UK), allowing the emergence of banking behemoths (Citi Group in 1998, BNP Paribas in 2000). Banks did not lose out on these developments: they gradually established themselves as the central players in this new globalized finance.

Technical and regulatory innovations in the markets and the banking sector created financial globalization. This evolution was accompanied by a boom in the collective management of savings with the emergence of huge institutional investors. For instance, between 1980 and 2009 the amount of assets managed by pension funds was multiplied by 33.

Finally, the second part of the 20th century saw the development of new forms of financing. In 1958, in the US, new laws allowing the creation of investment firms, paved the way to private equity and venture capital, which financed the development of start-ups in Silicon Valley. The 1980s witnessed the emergence of the first Leverage Buy Out.

At beginning of the 21st century, crowdfunding through crowd equity (funding in exchange of a stake in the company) of crowd lending (funding in exchange of interests) added another new form of financing.

Thus, the 20th century witnessed the development of the forms of financing that we know today. The typology devised by John Hicks in 1974 appears now to be obsolete, as the means of financing abound, without one imposing itself as in the overdraft and autoeconomy models. Nevertheless, it allows us to understand how the events of the last century have built the globalized finance we know today.

Key concepts

Overdraft

An overdraft occurs when money is withdrawn from a bank account and the available balance goes below zero. In this situation, the account is said to be “overdrawn”. If there is a prior agreement with the account provider for an overdraft, and the amount overdrawn is within the authorized overdraft limit, then interest is normally charged at the agreed rate. If the negative balance exceeds the agreed terms, then additional fees may be charged and higher interest rates may apply.

Deposit insurance scheme

Deposit insurance or deposit protection is a measure implemented in many countries to protect bank depositors, in full or in part, from losses caused by a bank’s inability to pay its debts when due. Because banking institution failures have the potential to trigger a broad spectrum of harmful events, including economic recessions, policy makers maintain deposit insurance schemes to protect depositors and to give them comfort that their funds are not at risk. In the European Union, the current coverage limit is €100,000.

Useful resources

John Hicks (1974) The Crisis in Keynesian Economics.

Adeline Daumard (1973) Les fortunes françaises au XIXème siècle.

Pierre-Cyrille Hautcoeur, Paul Lagneau-Ymonet, Angelo Riva (2011) Les marchés financiers français : une perspective historique.

André Strauss (1988) Evolution comparée des systèmes de financement : RFA, Royaume-Uni et Japon.

Henri Bourguinat (1992) Finance internationale.

About the author

Article written in April 2021 by Raphaël ROERO DE CORTANZE (ESSEC Business School, Master in Management, 2019-2022).

What is an Institutional Investor?

What is an Institutional Investor?

img_SimTrade_Photo1_Raphael_Roero_de_Cortanze

In this article, Raphaël ROERO DE CORTANZE (ESSEC Business School, Grande Ecole Program – Master in Management, 2018-2022) explains what is an institutional investor.

What do an investment management firm like BlackRock, a Pension Fund like the Caisse de Dépôt et Placement du Québec and an insurance company like AXA Investment Managers have in common? They are all institutional investors, a wide group of investors that is behind the largest supply and demand movements in securities markets.

What is an Institutional Investor?

An institutional investor is an organization that pools money to purchase securities such as bonds or stocks, real-estate, and other assets on behalf of its clients. The characteristics of an Institutional Investor can be summarized in three points. An institutional investor:
Is a legal entity that manages a number of funds (not the fund itself)
Manages professionally numerous assets according to the interest and the goals of its clients
Manages a significant number of funds

Institutional investors include:

  • Banks (Goldman Sachs, BNP Paribas, etc.)
  • Credit unions (Navy Federal Credit Union etc.)
  • Insurance companies (Insurers like AXA or Reinsurers like SCOR)
  • Pension funds (Caisse de dépôt et placement du Québec etc.)
  • Hedge funds (Archegos, etc.)
  • Others: REITs (Real-Estate), investment advisors, endowments, and mutual funds.
  • Compared to other investors, Institutional Investors as professional investment managers face fewer regulations as they are believed to be more capable of protecting themselves from risk.

Institutional investor VS Retail Investor

A Retail Investor, or individual investor is a non-professional investor who purchases securities for its own personal accounts and often trade in dramatically smaller amounts as compared to Institutional Investors. Like Institutional Investors, Retail Investors are active in a variety of markets (bonds, options, commodities, forex, futures contracts, and stocks). Nonetheless, some markets are primarily for Institutional Investors, such as swaps and forward markets.

As an estimation, retail investors typically buy and sell stocks in round lots of 100 shares or more while institutional investors are known to buy and sell in block trades of 10,000 shares or more. Thus, institutional investors’ buying and selling decisions can have tremendous impact on shares prices. This is why Institutional Investors avoid buying or selling large blocks of small companies, as it could create sudden supply and demand imbalances which could be detrimental to the market equilibrium. Nonetheless, Institutional investors also typically avoid owning large stake in big companies because doing so can violate securities law: some Institutional Investors are limited as to the magnitude of their voting stake in a company.

As Institutional Investors’ investment strategy are expected to be formulated by market professionals, Retail Investors sometimes try to mimic buying and selling decisions of Institutional Investors. This behavior known as “smart money” also comes from the fact that Institutional Investors’ investment decisions are formulated according to extensive and well documented researches. As Institutional Investors have a lot more resources at their disposal (both cash and information) in order to invest, they bring in their wake numerous Retail Investors, eager to benefit from the Institutional Investors’ expertise.

The impact of Institutional Investors

As explained above, Institutional Investors can significantly impact financial markets through their buying and selling decisions. In 2015, the three biggest US asset managers (BlackRock, The Vanguard Group and Fidelity Investments) together owned an average of 18% in the S&P 500 Index and constituted the largest shareholder in 88% of the firms included in the S&P 500 index. Thus, it is no coincidence that Institutional Investors are often called “market makers” as they exert a large influence on the price dynamics of different financial instruments.

The majority of Institutional Investors focus on long-term profitability rather than short-term profit. Nonetheless, this statement strongly varies according to the investor which is considered. An Insurance Company for instance focuses on investment capable of creating long-term returns, as the money insurance companies invest comes directly from their client. As Insurance companies need to be capable of facing claim settlements, they cannot allow themselves to gamble with their clients’ money. That is why the Institutional Investors’ activism as shareholders is thought to improve corporate governance — exception being made for investors such as Hedge Funds which, through very aggressive investment management, can have long-term negative located impacts.
As a conclusion, the presence of Institutional Investors in a market creates a positive effect on overall economic conditions.

Key concepts

Bond

A bond is a fixed income instrument that represents a loan made by an investor to a borrower (typically corporate or governmental)

Credit Union

A type of financial institution similar to a commercial bank, is a member-owned financial cooperative, controlled by its members and operated on a not-for-profit basis.

Mutual Funds

Mutual funds give small or individual investors access to professionally managed portfolios of equities, bonds, and other securities. Each shareholder, therefore, participates proportionally in the gains or losses of the fund.

Options

Options are financial instruments that are derivatives based on the value of underlying securities such as stocks. An options contract offers the buyer the opportunity to buy or sell—depending on the type of contract they hold—the underlying asset.

Commodities

A commodity is a basic good used in commerce that is interchangeable with other goods of the same type. Commodities are most often used as inputs in the production of other goods or services.

Forex

The foreign exchange market is where currencies are traded. Forex markets exist as spot (cash) markets as well as derivatives markets offering forwards, futures, options, and currency swaps.

Futures contracts

Futures are derivative financial contracts that obligate the parties to transact an asset at a predetermined future date and price. The buyer must purchase or the seller must sell the underlying asset at the set price, regardless of the current market price at the expiration date.

Sources: OECD, Corporate Finance Institute, MarketWatch, Wallstreet Prep

About the author

Article written in June 2021 by Raphaël ROERO DE CORTANZE (ESSEC Business School, Grande Ecole Program – Master in Management, 2019-2022).

What is an Activist Investor?

What is an Activist Investor?

img_SimTrade_Photo1_Raphael_Roero_de_Cortanze

In this article, Raphaël ROERO DE CORTANZE (ESSEC Business School, Master in Management, 2018-2022) explains what is an activist investor.

What is an Activist Investor?

Activist Investors regularly make the headlines. In March 2021, Emmanuel Faber stepped down as CEO of Danone as a result of an aggressive campaign led by Bluebell Capital Partners and Artisan Partners, two investment funds.
Who are these activist investors? What is their modus operandi? And, above all, what are the consequences of their actions on the companies they target?

Activist investors are mostly Private Equity firms, hedge funds and wealthy individuals that acquire a significant stake in a public company in order to influence how the company is managed, with a view to extracting short-term profits. As shareholders activists, they attempt to use their rights as a shareholder of a publicly-traded corporation to bring about change within the corporation.

Activist investors seek companies they think are mismanaged, have excessive costs or could be run in a more profitable way. Their goal is to boost the short-term profitability of a company, in order to make a quick capital gain by reselling the shares at a higher price than the activist investor acquired them before the company’s upheaval.

Owning a small proportion of the shares of a publicly-traded company is sufficient for an activist investor to wield enough shareholder power to implement short-term profit maximizing changes. Indeed, 5% or even 3% can already carry a lot of control power: above a certain percentage of ownership, it is possible to request the inclusion of a draft resolution on the agenda of a general assembly.

Modus operandi

The typical modus operandi of activist investors is the following:

  • acquire some shares of a company
  • heavily criticize the company’s current management
  • demand changes: cost reductions, board seats, departure of the current CEO, etc.
  • convince other shareholders of the validity of their criticism and demands in order to gather around them sufficient shareholder voting rights and ownership to propose and implement their decision during a general assembly
  • see these changes being implemented and bring short-term profitability
    resell the shares

The Danone case

Mid-January, the activist fund Bluebell Capital Partners (with an ownership believed to range between 2% to 3%) began attacking Emmanuel Faber’s governance. It was joined a few days later by Artisan Partners (0,6% of ownership). Together they deplored what they considered to be the poor performance of the company compared to its competitors Unilever or Nestlé.

Initially, a separation of functions between chairman and CEO was made in response to the investment funds’ attacks: Emmanuel Faber would have remained chairman while his former CEO position would have been filled by Gilles Schnepp, former CEO of the Legrand group. However, the two funds quickly objected to this move and Emmanuel Faber was eventually forced to leave the group while Gilles Schnepp succeeding him as chairman (with two co-CEOs running the Executive Committee). In less than two months, therefore, the CEO was removed, replaced by a profile a little less focused on corporate social responsibility and a little more on financial results.

Activist investors: good or bad for shareholders?

On the one hand, one might think that the intervention of an activist fund is a good thing for the shareholders. Shareholder activism might bring about change in the corporation, or even in the company’s objectives and vision, and will lead to a growth in profits, which will inevitably result in a rise in the share price rather quickly.

However, it is important to keep in mind that activist funds have a short-term investment horizon and want to increase the share price quickly in order to pocket a capital gain as soon as possible. It’s far from being synonymous with long-term value creation. Furthermore, the public image of a company can be severely damaged by industrial actions and cost-cutting plans.

It is therefore difficult to say whether activist funds are beneficial or not. The arrival of an activist fund in a very badly managed company can be very good news. But it all boils down to what is considered to be a “bad” management. Could Emmanuel Faber’s focus on corporate social responsibility be really considered as bad management?

The role of activist investor cab be seen in two famous financial movies: Other people’s money and Wall Street.

Watch Garfield (in the Other people’s money movie) making his point about wealth maximization at the shareholders’ Annual Meeting of their company.

This could be compared to Gordon Gekko explaining “Greed, for the lack of a better word, is good” to the shareholders during the General Meeting of their company (in the Wall Street movie).

Useful resources

Sources: Les Echos, Boursorama, Investopedia, LegalAction, Wikipedia

Related posts

Film analysis – Other People’s Money

Film analysis – Wall Street: Money Never Sleeps

About the author

Article written in June 2021 by Raphaël ROERO DE CORTANZE (ESSEC Business School, Master in Management, 2019-2022).

In the shoes of a Corporate M&A Analyst

In the shoes of a Corporate M&A Analyst

img_SimTrade_Photo1_Raphael_Roero_de_Cortanze

In this article, Raphaël ROERO DE CORTANZE (ESSEC Business School, Master in Management, 2018-2022) shares his experience as a Corporate M&A Intern.

My internship at Scor

In 2020 as an intern, I had the opportunity to join the M&A Team of the French Reinsurer “SCOR” for 6 months.

As this internship allowed me to develop both hard and soft skills as well as helping me devising my future career path, I think it would be interesting to share this experience with you, hoping it could help you or give you some ideas.

SCOR Paris

SCOR is the world’s fourth-largest reinsurer with 16.4€bn of revenue in 2020. As a reinsurer, SCOR provides insurance companies with a range of solutions and services to control and manage the risks they face through its three divisions: Property & Casualty Reinsurance, Life & Health Reinsurance, and Investment Partners (the institutional investor division of SCOR).

What is a Corporate M&A Analyst?

A Corporate M&A Analyst is a Financial Analyst who works within and for a company, in comparison of a M&A Investment Banking Analyst who works in an Investment Bank or a Boutique.

The Corporate M&A Team is responsible for overseeing and carrying out all the transactions (acquisition, divesture, etc.) of a company. The team is in direct contact with investment banks, which it mandates in the case of an M&A operations. The team is also in direct contact with the Executive Committee and/or the Board of Directors of firms. Corporate M&A Analyst also work with other divisions within the company.

On average, a Corporate M&A Analyst and the rest of the M&A teamwork fewer hours than in an investment bank. Nonetheless, workhours strongly depend on the number of transactions the team makes in a year, and a M&A process can still be very intense and demanding even in a company.

What does a Corporate M&A Analyst do?

The tasks of a Corporate M&A Analyst are usually divided into two parts, the first being M&A-linked tasks and the other linked to the other activities the Corporate M&A team is related. For instance, at SCOR, the M&A team was also responsible for overseeing Corporate Finance at group level. Thus, I also worked on internal projects such as a cross-border restructuring project. In other corporates, M&A teams can be merged with Investor Relations, Strategy or for instance being only responsible for M&A related issues.

M&A tasks consist of:

  • Performing financial modelling and valuation: with conventional valuation tools (discounted cash flows, trading comparables and precedent transactions, etc.) and industry-specific tools (dividend discount model, appraisal value – for the Insurance/Reinsurance industry for instance)
  • Carrying out competitive and market intelligence of the industry: at SCOR I monitored 20+ competitors and targets, while devising regular updates and case studies on insurance/reinsurance transactions (merger, divesture, IPO, etc.)
  • Assisting in the execution on deals: in an acquisition or divesture process, the main task will be to perform valuation from bank documents (Info Memos), data rooms and internal data (in the case of a divesture). Compared to an M&A Analyst in an Investment Bank, a Corporate M&A Analyst also works on and follow the integration challenges raised by an acquisition.

The main tools used by a Corporate M&A Analyst are similar to the ones used by an M&A Analyst in a bank: Excel and Powerpoint of course, but also financial data providers such as Bloomberg, Factset, S&P Global, etc.

How can you become a Corporate M&A Analyst?

The majority of Corporate M&A Analysts and their colleagues usually spend some time in an Investment Bank before joining a Corporate M&A Team. This is why the work habits of a Corporate M&A team are similar to those in a bank: high attention to details, same requirements in terms of mastery of Excel and Powerpoint, high expectations in terms of speed and quality.

Between a job at an investment bank a corporate job, a Corporate M&A position can be a good opportunity to get the best of both worlds: high level of technicity and knowledge of a sector, combined with a more manageable workflow. Furthermore, members of a Corporate M&A team have the opportunity to work on transforming deals for the sake of the company they work for. In comparison, Investment Banking Teams continuously switch from a client to another, from a deal to another, without having the corporate strategy dimension of a Corpor
ate M&A Team.

Key concepts

Trading comparable

A comparable company analysis (CCA) is a process used to evaluate the value of a company using the metrics of other businesses of similar size in the same industry. Comparable company analysis operates under the assumption that similar companies will have similar valuation multiples, such as EV/EBITDA. Analysts compile a list of available statistics for the companies being reviewed and calculate the valuation multiples in order to compare them.

Precedent transaction

The cost of a precedent transaction is used to estimate the value of a company that is being considered. The reasoning is the same as that of a prospective home buyer who checks out recent sales in a neighborhood.

Discounted cash flow

The discounted cash flow (DCF) method is a valuation method used to estimate the value of an investment based on its expected future cash flows. DCF analysis attempts to figure out the value of an investment today, based on projections of how much money it will generate in the future. A DCF valuation of a company gives the Enterprise Value.

Dividend discount model

The dividend discount model (DDM) is a quantitative method used for predicting the price of a company’s stock based on the theory that its present-day price is worth the sum of all of its future dividend payments when discounted back to their present value. A DDM valuation gives the Equity Value (or stock value).

Divesture

A divestiture is the partial or full disposal of a business unit which most commonly results from a management decision.

Property & Casualty insurance

Property and casualty (P&C) insurance provides coverage on assets (e.g., house, car, etc.) and also liability insurance for accidents, injuries, and damage to other people or their belongings.

Life & Health insurance

Life and health (L&H) insurance provides coverage on the risk of life and medical expenses incurred from illness or injuries.

Reinsurer

A reinsurer is a company that provides financial protection to insurance companies (basically an insurer of an insurer). Reinsurers handle risks that are too large for insurance companies to handle on their own and make it possible for insurers to obtain more business than they would otherwise be able to.

Related posts on the SimTrade blog

   ▶ All posts about Professional experiences

   ▶ Basma ISSADIK My experience as an M&A Analyst Intern at Oaklins Atlas Capital

   ▶ Louis DETALLE A quick presentation of the M&A field…

   ▶ Suyue MA Analysis of synergy-based theories for M&A

Useful resources

Sources: Investopedia, Wikipedia, Corporate Finance Institute, Scor

About the author

Article written in April 2021 by Raphaël ROERO DE CORTANZE (ESSEC Business School, Master in Management, 2018-2022)

Veolia and Suez: the epitome of a hostile takeover bid

Veolia and Suez: the epitome of a hostile takeover bid

 Raphaël ROERO DE CORTANZE

In this article, Raphaël ROERO DE CORTANZE (ESSEC Business School, Master in Management, 2019-2022) details the Veolia-Suez saga.

Since August 30, 2020, when Engie put its 29,9% stake in Suez for sale, the Veolia-Suez saga continues to make headlines.

Veolia is a French company with activities in three main service and utility areas traditionally managed by public authorities: water management, waste management and energy services. Suez (formerly Suez Environnement) is a French-based utility company which operates largely in the water and waste management sectors. Suez is the largest private water provider worldwide, by number of people served.

Let’s go through the key stages of this saga with a view to understanding what is a hostile takeover, and why Veolia’s takeover bid on Suez can be considered as such.

August 2020: the beginning of hostilities

On August 30, 2020, Engie voiced its will to sell its 29,9% stake in Suez. This divesture aims at refocusing the group’s activities on renewable energies. Following this announcement, Veolia made a €2.9bn offer directly to Engie, for its stake in Suez. In the wake of this first offer, both boards of Engie and Suez rejected the bid: Suez feared that the acquisition would have serious consequences on the group’s employment, while Engie considered the offer price too low and put the increase of the offer price as a sine qua non condition to the completion of the deal.

This first offer is considered as a hostile bid as Veolia was willing to accomplish the acquisition with cash and by going directly to Engie, one of Suez’s shareholders, rather than by going to Suez’s board or executives. In other words, the transaction would have taken place without the approval of the purchased company.

September 2020: Engie accepts Veolia’s offer

Despite Suez’s counterattacks, Veolia continued and came back with a second offer at €3.4bn, higher than the first one, in order to convince Engie to give up its shares.

Engie’s board showed support for this second bid and later accepted the offer, highlighting the effort on the price, the strategic rationale and the social plan. Veolia, whose intention is to acquire the remaining 70% of Suez in the future, has also committed not to launch a full takeover bid without the agreement of Suez’s Board — thus proceeding with a friendly instead of hostile takeover.

Indeed, it is not uncommon for an acquirer willing to acquire 100% of the shares of a company to acquire a smaller block of shares in the first place and proceed later with the acquisition of the remaining block. Furthermore, in France, any shareholder who reaches or exceeds 30% of a listed French company will have to launch a takeover bid for the entire capital. In other words, Veolia, after having acquired 29,9% of Suez, would have had to propose a purchase offer to all shareholders, as a 30% stake triggers an automatic takeover bid.

February: Veolia launches a hostile takeover bid on 100% of Suez

Since Veolia’s second bid, Suez and Veolia haven’t been able to bridge divisions, and Suez continued to strongly reject the unfriendly acquisition. The counterproposition made by Suez to have an Ardian-GIP consortium taking over Suez’s French and international “Water and Technology” activities has been rejected by Veolia. On February 7, 2021, Veolia broke its commitment and filed a third public takeover bid but this time on 100% of Suez shares, at the same price as the second offer made exclusively to Engie. This acquisition would make Veolia the world leader in water and waste treatment. Once again, the offer was made without Suez’s approval, reinforcing the hostile dimension of the deal.

Have the negotiations reached a dead-end?

Bruno Le Maire, French Minister of Economy, denounced Veolia’s “unfriendly” bid and announced that he would refer the matter to the Autorité des Marchés Financiers (AMF) in order to verify the conformity of the group’s announcements with its previous commitments.

The situation seems to have reached a dead-end. On one side, Veolia has been ordered by the Tribunal de Commerce of Nanterre to suspend its takeover bid and to wait for validation of its offer by the Suez board of directors. On the other hand, Suez takeover defense strategy (which consists in the domiciliation of its Eau de France activity (targeted by Veolia) in a Dutch company for 4 years in order to make it inaccessible to a hostile bid) has just been rejected by the AMF on April 2, 2021.
Will Veolia and Suez be able to overcome their disagreements? Time will tell…

Key concepts

I present below key concepts to understand the Veolia-Suez saga.

Defense strategy

In response to hostile takeovers, targets can devise defense strategies in order to prevent the takeover from going across the finish line. Well-known defense strategies are:

  • Stock repurchase: purchase by the target of its own-issued shares from its shareholders
  • Poison pill: distribution to the target’s shareholders of the rights to purchase shares of the target or the merging acquirer at a substantially reduced price
  • White knight: the target seeks a friendlier acquirer
  • Crown jewels: the target divests one or several of its flagship activities or divisions (“jewel”) in order to reduce the interest of the hostile bidder
  • Fat man: the target issue new debt and or purchase assets or companies which are too large or known to be disliked by the hostile acquire, in order to “fatten up” and transform the target into a less attractive purchase

Public takeover bid

A public takeover bid can take two forms: the acquisition of the stake of the target company is made with cash (“Offre publique d’achat” or “OPA” in French) and the acquisition of the stake of a listed company is made by exchanging shares of the acquiring company with shares of the acquired company (“Offre publique d’échange” or “OPE” in French).

OPA and OPE refers to acquisition methods, not to acquisition behavior: an OPA or OPE can be friendly or hostile depending on whether the acquirer decides to obtain the acquired company’s approval or goes directly to the shareholders of the acquired company.

Useful resources

Sources: La Tribune, Le Monde, Easy Bourse, La Finance Pour Tous, Wikipedia

Related posts on the SimTrade blog

   ▶ Akshit GUPTA L’Autorité des Marchés Financiers (AMF)

   ▶ Akshit GUPTA Regulations in financial markets

About the author

Article written in April 2021 by Raphaël ROERO DE CORTANZE (ESSEC Business School, Master in Management, 2019-2022).