

2020: a year of all records
The year 2020 has been the scene of the greatest economic downturn since the Great Depression and the fastest market collapse on record. From mid-February onwards, stock markets have plummeted. In one month, the Paris stock market fell by nearly 40% and the New York stock market by more than 30%. On March 16, the Dow Jones lost 13%, topping the October 1929 Black Monday slide of 12,82% (the biggest Dow Jones fall still being the “Black Monday” October 1987, where it lost 22,6% in a day). It took only 16 trading days for the Dow Jones to push into bear market territory, while the S&P 500 lost 34% in only 33 trading days. The speed of the crash was unprecedented.

The rebounds were also spectacular. As of June 30, Wall Street recorded its best quarter since 1998. In November, the European stock markets experienced the strongest monthly increase in their history, with an 18% jump in the Euro Stoxx 50 and a 20% jump in the CAC 40.
Over the whole year 2020, 88% of the major asset classes have returned positively. The American markets have been the big winners. The Dow Jones gained more than 6%, while the Nasdaq Index jumped more than 43%. Amazon’s share price has risen by more than 70%, followed by Apple with more than a 50% increase and Facebook and Google with a 30% increase. Some increases are spectacular, such as those of the biotech company Aytu BioScience, jumping more than 500%, or Tesla, which recorded a rise of more than 600%.
The Paris Stock Exchange has ended 2020 in the red, but with a moderate decline of around 6% in the CAC 40 index, after the record year of 2019 (when the index of the 40 main French stocks had risen by 26%, its best performance in twenty years). European markets have not experienced such a powerful rebound 2020, as evidenced by the Euro Stoxx 50 index, which lost over 4%.
Why did the markets have bounce back much faster than the real economy?
Stock markets crashed in 2020 because of the uncertainty and the fear shared by investors about the impact of the Covid-19 crisis. When the World Health Organization (WHO) declared the disease a pandemic, countries began locking down, fear and uncertainty spread through the market, leading towards unprecedented asset sales.
If the rebound of markets has been so fast, it is because of the immediate response of Central Banks and governments. The massive asset buyback programs led by Central banks as well as state aids, loans and repayment facility programs have help to reassure investors. Indeed, investors view the markets as forward-looking, anticipating how economies and corporate earnings would perform in the upcoming months and years. In this context, the decorrelation between markets and real economy is not strange, as markets have immediately bet on a return to normalcy in a relatively short time frame.
What could come next?
2020 was the year of all records. The total amount of equity raised during IPOs in the US ($156 billion) topped the 1999 internet bubble record. Thanks to the wide response of Central banks and governments, confidence has returned and investors started taking risks again. 420 IPOs were performed in the US in 2020, which represents an 88% increase compared to 2019.
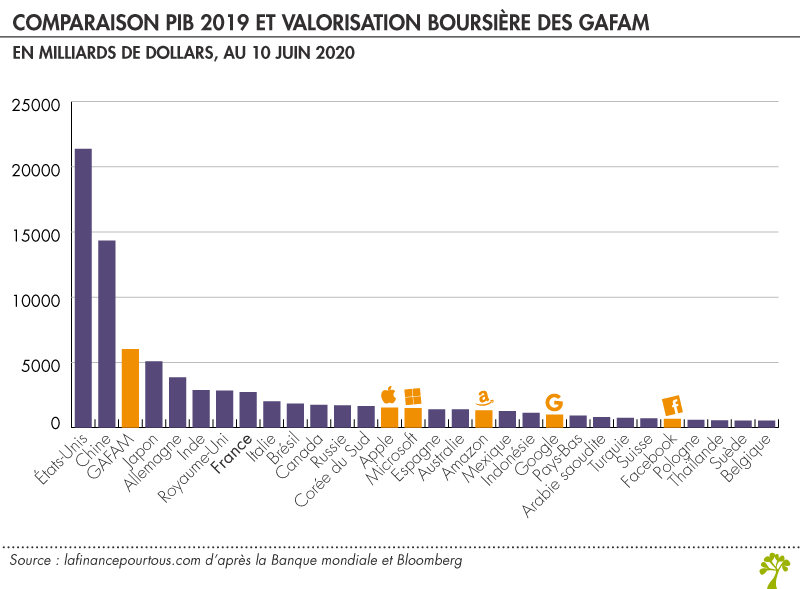
The stock market performance of certain technology companies and the craze for IPOs appears quite reminiscent of the atmosphere of beginning of the millennium, just before the burst of the internet bubble. Experts are puzzled. Hervé Goulletquer, Deputy Director of Research at La Banque Postale Asset Management has declared that “If we look at current valuations, this means that the health shock has had no medium-term impact on corporate earnings. That’s a bit of a stretch.” Indeed, The GAFAMs have seen their stock market valuation double between January 2019 and July 2020. They now weigh about a quarter of all stocks in the U.S. S&P 500 stock index. Together, the GAFAMs are worth more than the GDP of Japan, Germany or France!
If tech companies have outperformed this year, it is not the case for sectors such as industry and manufacturing, which are still struggling to emerge from the covid crisis as they took a bigger hit due to social-distancing measures and lockdowns.
On the one hand, if the old economy has not collapsed, it has resorted to debt like never before. Tech giants, on the other hand, are more and more dominant. Microsoft, Amazon and Google are now the only three members of the very exclusive club of companies with a market capitalization above 1,000 billion dollars.
During the year 2020, the appetite for tech has turned into a fever. Will this frenzy burst into a second internet bubble? Time will tell…
Key concepts
Bear market
A bear market is a period of persistent price declines. Declines in stock prices are 20% or more from recent highs and are fueled by pessimism or negative market sentiment. Bear markets are most often associated with declines in an overall market or in a particular index such as CAC 40, Dow Jones etc.
S&P 500
The S&P 500 index is a stock market index based on the 500 largest companies listed on stock exchanges in the United States. The index is owned and managed by Standard & Poor’s, one of the three major credit rating companies. It covers approximately 80% of the U.S. stock market by capitalization.
NASDAQ
NASDAQ (short for National Association of Securities Dealers Automated Quotations) is currently the second largest U.S. equity market, by volume traded, behind the New York Stock Exchange. The NASDAQ index, also known as “the NASDAQ”, is the stock market index that measures the performance of the companies listed on it.
Dow Jones
The Dow Jones Industrial Average (DJIA) or Dow Jones, is a stock market index that measures the stock performance of 30 large companies listed on stock exchanges in the United States.
Euro Stoxx 50
The Euro Stoxx 50 a stock market index for the euro zone. Like the CAC 40 for France, the Euro Stoxx 50 groups 50 companies according to their market capitalization within the euro zone.
Useful resources
https://www.thebalance.com/dow-jones-closing-history-top-highs-and-lows-since-1929-3306174
https://www.thebalance.com/fundamentals-of-the-2020-market-crash-4799950
https://edition.cnn.com/2020/12/31/investing/dow-stock-market-2020/index.html
About the author
Article written in June 2021 by Raphaël ROERO DE CORTANZE (ESSEC Business School, Master in Management, 2019-2022).