

In this article, Youssef LOURAOUI (ESSEC Business School, Global Bachelor of Business Administration, 2017-2021) presents the concept of the smart beta 1.0, the first generation of alternative indexing investment strategies that created a new approach in the asset management industry.
This post is structured as follows: we start by defining smart beta 1.0 as a topic. Finally, we discuss an empirical study by Motson, Clare and Thomas (2017) emphasizing the origin of smart beta.
Definition
The “Smart Beta” expression is commonly used in the asset management industry to describe innovative indexing investment strategies that are alternatives to the market-capitalization-weighted investment strategy (buy-and-hold). In terms of performance, the smart beta “1.0” approach outperforms market-capitalization-based strategies. According to Amenc et al. (2016), the latter have a tendency for concentration and unrewarded risk, which makes them less appealing to investors. In finance, “unrewarded risk” refers to taking on more risk without receiving a return that is commensurate to the increased risk.
When smart beta techniques were first introduced, they attempted to increase portfolio diversification over highly concentrated and capitalization-weighted, as well as to capture the factor premium available in equity markets, such as value indices or fundamentally weighted indices which aim to capture the value premium. While improving capitalization-weighted indices is important, concentrating just on increasing diversity or capturing factor exposure may result in a less than optimal outcome. The reason for this is that diversification-based weighting systems will always result in implicit exposure to certain factors, which may have unintended consequences for investors who are unaware of their implicit factor exposures. Unlike the second generation of Smart Beta, the first generation of Smart Beta are integrated systems that do not distinguish between stock selection and weighting procedures. The investor is therefore required to be exposed to certain systemic risks, which are the source of the investor’s poor performance.
Thus, the first-generation Smart Beta indices are frequently prone to value, small- or midcap, and occasionally contrarian biases, since they deconcentrate cap weighted indices, which are often susceptible to momentum and large growth risk. Furthermore, distinctive biases on risk indicators that are unrelated to deconcentration but important to the factor’s objectives may amplify these biases even further. Indexes that are fundamentally weighted, for example, have a value bias because they apply accounting measures that are linked to the ratios that are used to construct value indexes.
Empirical study: monkeys vs passive mangers
Andrew Clare, Nick Motson, and Steve Thomas assert that even monkey-created portfolios outperform cap-weighted benchmarks in their study (Motson et al., 2017). A lack of variety in cap-weighting is at the foundation of the problem. The endless monkey theory states that a monkey pressing random keys on a typewriter keyboard for an unlimited amount of time will almost definitely type a specific text, such as Shakespeare’s whole works. For 500 businesses, there is an infinite number of portfolio weighting options totaling 100%; some will outperform the market-capitalization-weighted index, while others will underperform. The authors of the study take the company’s ticker symbol and use the following guidelines to create a Scrabble score for each stock:
- A, E, I, O, U, L, N, S, T, R – 1 point. D and G both get two points.
- B, C, M, P – 3 points ; F, H, V, W, Y – 4 points ; K – 5 points.
- J, X – 8 points ; Q, Z – 10 points
The scores of each company’s tickers are then added together and divided by this amount to determine each stock’s weight in the index. As illustrated in Figure 1, the results obtained are astonishing, resulting in a clear outperformance of the randomly generated portfolios compared to the traditional market capitalization index by 1.5% premium overall.
Figure 1. Result of the randomly generated portfolio with the Cass Scrabble as underlying rule compared to market-capitalization portfolio performance.
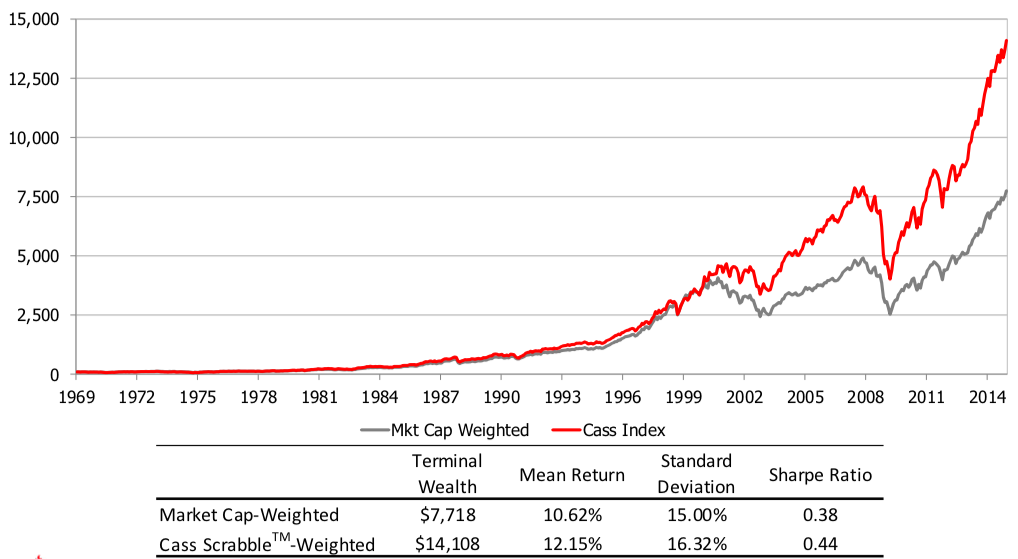
Source: Motson et al. (2017).
In the same line, the authors produced 500 weights that add up to one using this technique, with a minimum increase of 0.2 percent. The weights are then applied to a universe of 500 equities obtained from Bloomberg in December 2015 (Motson et al., 2017). The performance of the resultant index is then calculated over the next twelve months. This technique was performed ten million times. As illustrated in Figure 2, the results are striking, with smart beta funds outperforming nearly universally in the 10 million simulations run overall, and with significant risk-adjusted return differences (Motson et al., 2017).
Figure 2. 10 million randomly generated portfolios based on a portfolio construction of 500 stocks
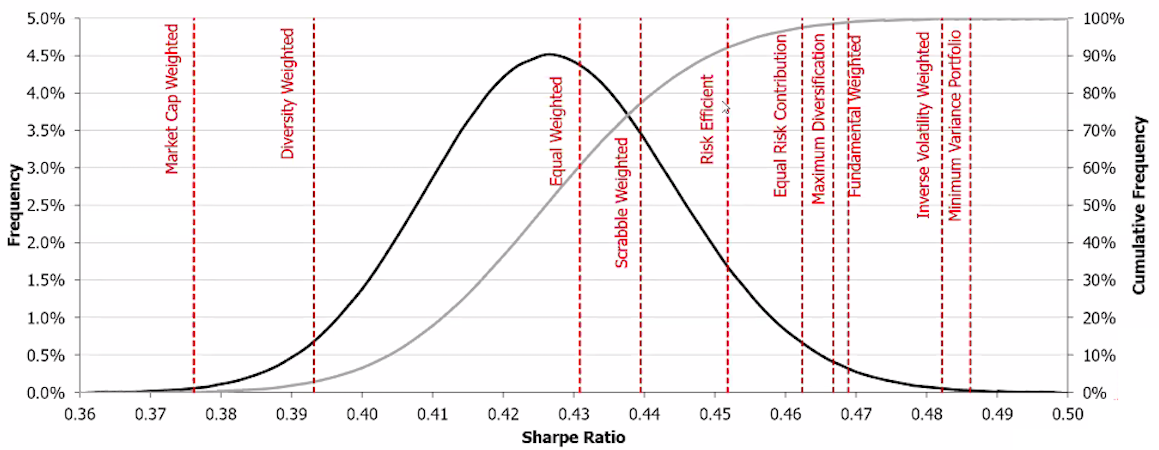
Source: Motson et al. (2017).
For performance analysis, the same method was employed, but this time for a billion simulation. This means they constructed one billion 500-stock indexes with weights set at random or as if by a monkey. Figure 9 suggests that the outcome was not accidental. The black line shows the distribution of 1 billion monkeys’ returns in 2016, while the grey line shows the cumulative frequency. 88 percent of the monkeys outperformed the market capitalization benchmark, according to the graph. The luckiest monkey returned 27.2 percent, while the unluckiest monkey returned just 3.83 percent (Motson et al., 2017) (Figure 3).
FFigure 3. Result of one billion randomly simulated portfolios based on a portfolio construction of 500 stocks.
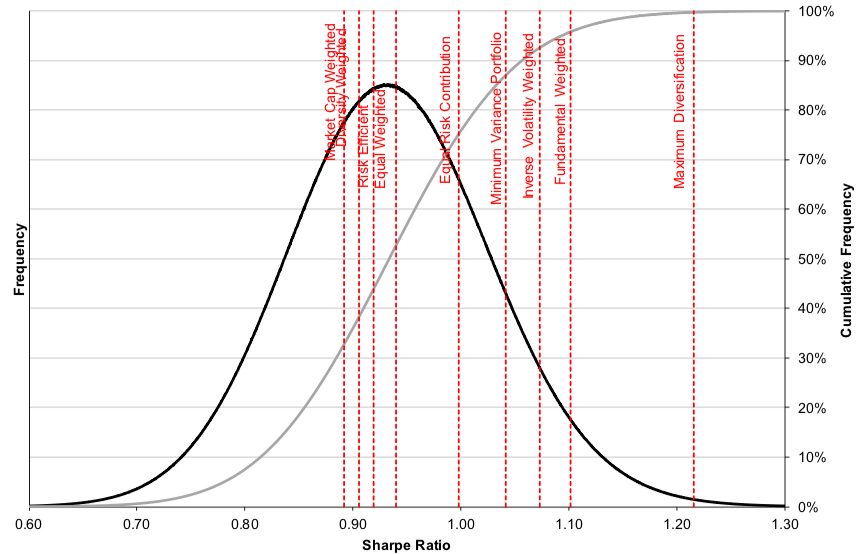
Source: Motson et al. (2017).
Why should I be interested in this post?
If you are a business school or university undergraduate or graduate student, this content will help you in understanding the various evolutions of asset management throughout the last decades and in broadening your knowledge of finance.
If you’re an investor, you’re probably aware that smart beta funds have become a popular topic. Smart beta is a game-changing development that fills a gap in the market for investors: a better return for a reduced risk, net of transaction and administrative costs. These strategies, in a sense, establish a new market. As a result, smart beta is gaining traction and having an impact on asset management.
Related posts on the SimSrade blog
Factor investing
▶ Youssef LOURAOUI Factor Investing
▶ Youssef LOURAOUI Origin of factor investing
▶ Youssef LOURAOUI Smart beta 2.0
▶ Youssef LOURAOUI Alternatives to market-capitalisation weighted indexes
Factor
▶ Youssef LOURAOUI Size Factor
▶ Youssef LOURAOUI Value Factor
▶ Youssef LOURAOUI Yield Factor
▶ Youssef LOURAOUI Momentum Factor
▶ Youssef LOURAOUI Quality Factor
▶ Youssef LOURAOUI Growth Factor
▶ Youssef LOURAOUI Minimum Volatility Factor
Useful resources
Academic research
Amenc, N., F., Goltz, F. and Le Sourd, V., 2016. Investor perception about Smart beta ETF. EDHEC Risk Institute working paper.
Amenc, N., F., Goltz, F. and Martinelli, L., 2013. Smart beta 2.0. EDHEC Risk Institute working paper.
Motson, N., Clare, A. & Thomas, S., 2017. Was 2016 the year of the monkey?. Cass Business School research paper.
About the author
The article was written in September 2021 by Youssef LOURAOUI (ESSEC Business School, Global Bachelor of Business Administration, 2017-2021).