In this article, Snehasish CHINARA (ESSEC Business School, Grande Ecole Program – Master in Management, 2022-2024) presents the Top 10 Cryptocurrencies by Market Capitalization (August 2024).
Market Capitalization of Cryptocurrencies
Market capitalization, often referred to as market cap, signifies the complete monetary worth of a company’s stock or, in the realm of cryptocurrencies like Bitcoin, the collective value of all mined coins. In the cryptocurrency domain, market cap is computed by multiplying the prevailing price of a single coin by the total quantity of coins mined up to that point. Market cap is important because in the crypto ecosystem (and beyond) it measures the success of the cryptocurrency.
In June 2023, the total market capitalization of all cryptocurrencies worldwide stands at $1.22 Trillion, displaying a 9.11% change compared to a year ago. At this moment, Bitcoin (BTC) holds the highest market cap of $569 Billion, corresponding to a Bitcoin dominance of 46.71%.
Market capitalization facilitates comparing the overall value of different cryptocurrencies, aiding in well-informed investment choices. Cryptocurrencies are usually categorized by market cap into three groups: 1) Large cap, such as Bitcoin and Ethereum, with market caps over $10 billion, perceived as lower risk due to their established growth and liquidity resilience; 2) Mid-cap, between $1 billion and $10 billion, offer potential upside but elevated risk; 3) Small-cap, under $1 billion, are highly vulnerable to market sentiment-driven fluctuations.
Volume Traded of Cryptos
The trading volume holds significant importance in the realm of cryptocurrencies and other financial instruments. It signifies the complete count of tokens or coins traded over a particular timeframe, typically denoted in the base currency (like USD or BTC) or the token (for instance, ETH or XRP) within periods like 24 hours, 7 days, or 30 days.
Cryptocurrency liquidity is often gauged by its trading volume, a measure of market activity. Elevated trading volumes denote heightened buyer and seller presence, facilitating smoother trades without abrupt price shifts. Enhanced liquidity is advantageous, streamlining trade entries or exits. A surge in trade frequency yields more data, refining price determination and aligning cryptocurrency value more accurately. Noteworthy shifts in trading volume might signify sentiment changes – increased volume suggests heightened demand or interest, while reduced volume implies waning enthusiasm or market uncertainty. When coupled with price dynamics, volume aids trend validation; a rising cryptocurrency price coupled with elevated trading volume suggests robust momentum and broader market involvement.
#1 Bitcoin (BTC)
Logo of Bitcoin
Statistics
Market capitalization: $568.57 Billion
Market price : $ 29,230.11
Number of coins in circulation: 18.30 Million
Volume traded (over the past year): $3.36 Trillion
Year founded: 2009
Overview of Bitcoin
Introduced in 2009 by an undisclosed group using the pseudonym Satoshi Nakamoto, Bitcoin marked the debut of accessible cryptocurrencies. Emerging in the aftermath of the global financial crisis, it aimed to provide an alternative to conventional financial systems, granting individuals direct control over their assets and bypassing intermediaries.
Functioning on a blockchain foundation, Bitcoin employs the Proof of Work (PoW) consensus mechanism, where miners compete to validate transactions through solving complex puzzles, ensuring system security and integrity. Initially viewed as a digital currency, Bitcoin’s role has evolved to be similar to “digital gold,” attributed to its capped supply of 21 million coins. This scarcity sets it apart from traditional currencies and positions it as a hedge against inflation and economic uncertainty, making it valuable for remittances and global trade, particularly in regions with limited banking access. Utilizing digital wallets, Bitcoin enables autonomous transactions, offering an alternative to the unbanked population and allowing them to engage in financial activities and preserve value.
Market capitalization
The figure below gives the market capitalization of bitcoin from July 2010 to September 2024. At a given point of time, market capitalization is obtained by multiplying the number of bitcoin in circulation (coin supply) by the price of bitcoin.
Market Capitalization Chart of Bitcoin
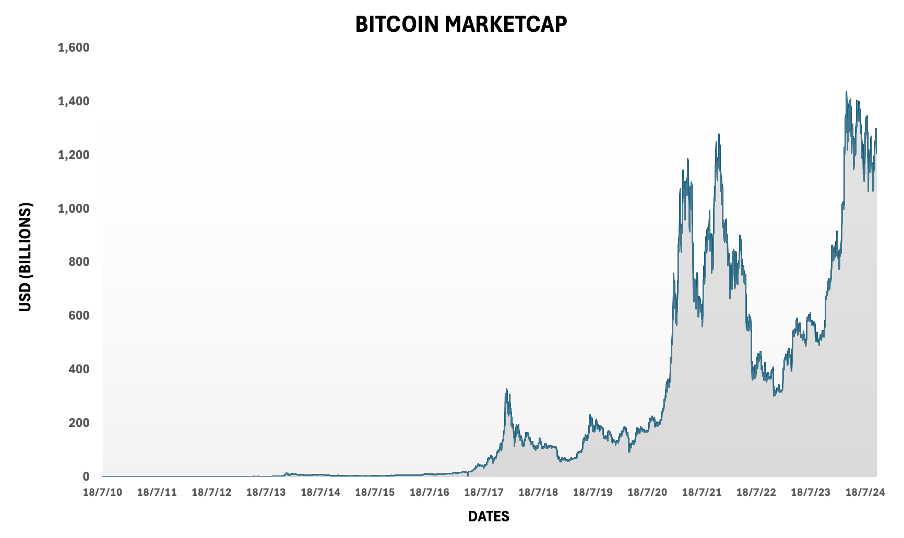
Source: Yahoo! Finance. (Computation by Author)
You can download blow the excel file used to build the figure. Historical data for Bitcoin can be downloaded from CoinMarketCap or Yahoo! Finance website.

#2 Ethereum (ETH)
Logo of Ethereum
Statistics
Market capitalization: $223.15 billion
Market price : $1856.8
Number of coins : 120.16M
Year founded: 2013
Overview of Ethereum
In 2013, Ethereum was conceptualized, and it became publicly known in 2015 through the efforts of Vitalik Buterin. Unlike its forerunner, Bitcoin, Ethereum stands as a revolutionary stride in blockchain technology. It goes beyond simple digital currency transfer, incorporating programmable smart contracts into its framework. This innovation has instigated a fresh era of decentralized applications (DApps) spanning various domains. These smart contracts, penned using the Solidity programming language, facilitate self-executing agreements based on predefined conditions, effectively reshaping industries such as finance, supply chain management, and gaming. Ether (ETH), Ethereum’s native cryptocurrency, plays a dual part, serving as a transactional medium within the network while also fueling the execution of these contracts.
At the foundation of Ethereum lies a transition from the energy-intensive Proof of Work (PoW) to a more ecologically conscious Proof of Stake (PoS) consensus protocol. This transformation, embodied in Ethereum 2.0, not only amplifies scalability and efficiency but also guarantees the platform’s endurance and its capacity to meet the growing demand for blockchain-centered solutions. The lasting legacy of Ethereum originates from its conversion of blockchain from a mere digital currency system to a versatile bedrock that stimulates innovation through decentralized applications and smart contracts.
Market capitalization
The figure below gives the market capitalization of ethereum from August 2015 to September 2024. At a given point of time, market capitalization is obtained by multiplying the number of Ethereum in circulation (coin supply) by the price of Ethereum.
Market Capitalisation Chart of Etheream
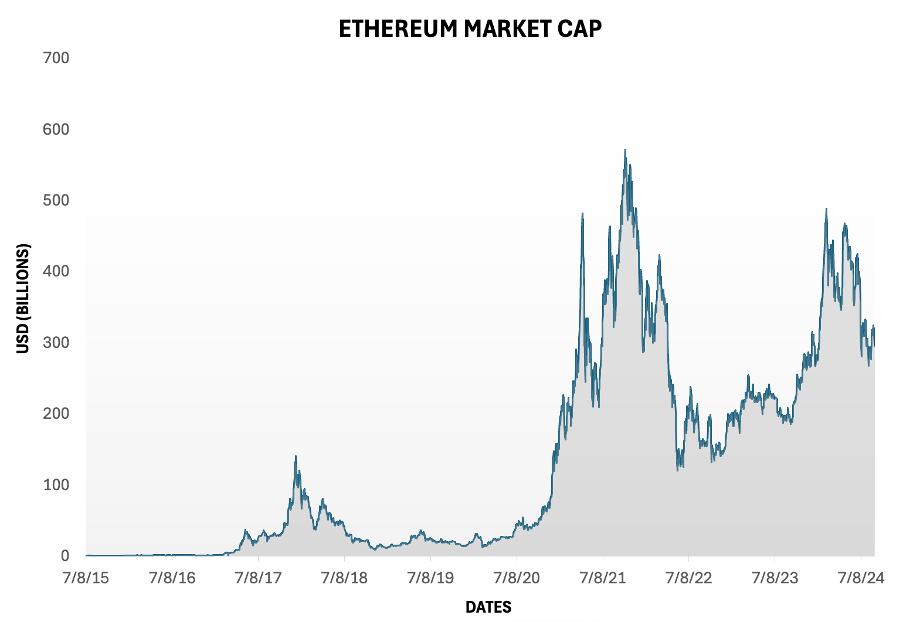
Source: Yahoo! Finance. (Computation by Author)
The historical data for Ethereum market prices can be downloaded from Yahoo! Finance website: Download the data for EthereumYou can download blow the excel file used to build the figure. Historical data for Ethereum can be downloaded from CoinMarketCap or Yahoo! Finance website.
#3 Tether (USDT)
Logo of Tether
Statistics
Market capitalization: $83.81 Billion
Market price : $ 0.999
Circulating Supply : $83.53 Billion
Year founded: 2014
Overview of Tether
Released in 2014, Tether entered the cryptocurrency arena amidst the quest for stability within this dynamic market. Conceived as a stablecoin, Tether aimed to counteract the pronounced price volatility synonymous with cryptocurrencies like Bitcoin and Ethereum. Designed as a form of cryptocurrency, stablecoins, like Tether, are meticulously crafted to mirror the value of specific fiat currencies. Each individual Tether coin is intrinsically valued at precisely one unit of the chosen fiat currency, ensuring steadfast equivalence. This is exemplified by the fact that a solitary Tether USDT is perpetually equivalent to one U.S. dollar.
The distinctive hallmark of USDT lies in its pioneering fusion of fiat currency stability with blockchain technology. This characteristic renders it exceedingly practical for preserving or transferring value, as its unchanging price obviates concerns about depreciation. While renowned cryptocurrencies such as Bitcoin and Ethereum undergo price fluctuations based on market dynamics, USDT remains steadfastly pegged to the dollar. Upon entry into the cryptocurrency market, it behaves akin to any other currency, facilitated through blockchain technology. Thus, Tether can be procured or traded via various cryptocurrency exchanges supporting USDT.
Market capitalization
The figure below gives the market capitalization of Tether from February 2015 to September 2024. At a given point of time, market capitalization is obtained by multiplying the number of Tether in circulation (coin supply) by the price of Tether.
Market Capitalisation Chart of Tether
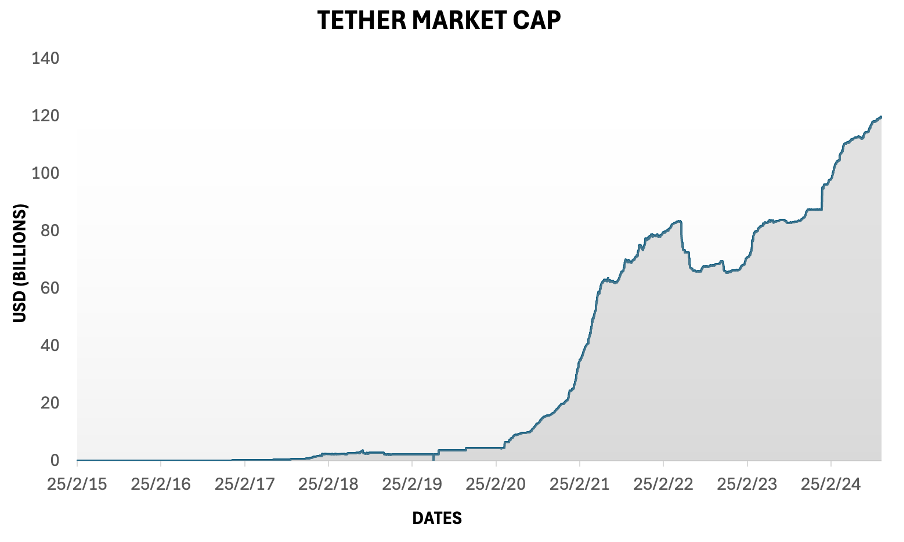
Source: Yahoo! Finance. (Computation by Author)
The historical data for Tether market prices can be downloaded from Yahoo! Finance website: Download the data for Tether
You can download blow the excel file used to build the figure. Historical data for Tether can be downloaded from CoinMarketCap or Yahoo! Finance website.
#4 Binance Coin (BNB)
Logo of BNB

Statistics
Market capitalization: $37.14 Billion
Market price : $241.4
Number of coins : 153.85 Million
Year founded: 2008
Overview of BNB
Binance Coin (BNB) emerged in July 2017 as a significant cryptocurrency, originating from Binance exchange’s forward-looking perspective. Initially designed to provide trading fee incentives to Binance users, the introduction of BNB coincided with the worldwide surge in cryptocurrency interest. It was conceived by tech entrepreneur Changpen Zhao, also known as CZ, and serves as the native utility token for Binance exchange, recognized as the world’s largest cryptocurrency trading platform. BNB operates on the innovative BNB Chain, which incorporates a distinctive amalgamation of Proof of Stake (PoS) and Proof of Authority (PoA) consensus mechanisms. By leveraging both these models, the network achieves comparably reduced fees and swifter transaction processing. The forthcoming BNB Chain roadmap for 2022/23 aims to enhance transaction speed, lower fees, and provide open-source capabilities, catering to developers aiming to construct within the expansive Binance ecosystem.
Market capitalization
The figure below gives the market capitalization of Binance from July 2017 to September 2024. At a given point of time, market capitalization is obtained by multiplying the number of Binance in circulation (coin supply) by the price of Binance.
Market Capitalisation Chart of BNB
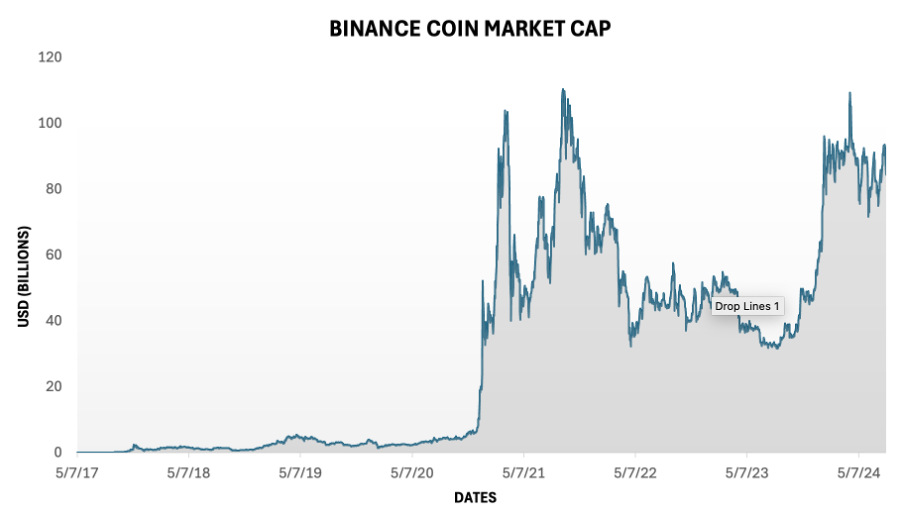
Source: Yahoo! Finance. (Computation by Author)
The historical data for BNB market prices can be downloaded from Yahoo! Finance website: Download the data for BNB
You can download blow the excel file used to build the figure. Historical data for Binance can be downloaded from CoinMarketCap or Yahoo! Finance website.
#5 XRP / Ripple (XRP)
Logo of XRP
Statistics
Market capitalization: $36.82 Billion
Market price : $0.698
Number of coins : $ 54.74 Billion
Year founded: 2012
Overview of XRP
XRP is a digital currency that emerged onto the scene in 2012 as a key element of Ripple Labs’ visionary pursuit to transform cross-border financial settlements and payments. The founders of XRP, Chris Larsen and Jed McCaleb, sought to confront the inherent inefficiencies and delays that plagued conventional banking systems. Introducing XRP as a conduit between diverse fiat currencies, the aim was to enable swift and seamless international transactions. Setting it apart from its cryptocurrency peers, XRP wasn’t minted through the typical mining process ; instead, it was pre-mined, featuring a fixed quantity of 100 billion tokens. This strategic move was orchestrated to establish a stable foundation for the currency’s growth.
At the core of Ripple’s groundbreaking xRapid product, XRP plays the role of an intermediary currency, facilitating the exchange of value across various fiat currencies within financial institutions. The intrinsic currency of the XRP Ledger, a cryptographic ledger bolstered by a network of interconnected nodes, XRP empowers these institutions in their pursuit of seamless cross-currency transactions. Notably, Ripple is the architect behind this blockchain-based digital payment settlement system and the extensive crypto exchange network that encompasses it. An embodiment of innovation, Ripple harnesses its native token to facilitate the transition of traditional financial dealings from centralized databases under the jurisdiction of financial authorities to an openly accessible infrastructure.
Market capitalization
The figure below gives the market capitalization of XRP from April 2020 to September 2024. At a given point of time, market capitalization is obtained by multiplying the number of XRP in circulation (coin supply) by the price of XRP.
Market Capitalisation Chart of XRP

Source: Yahoo! Finance. (Computation by Author)
The historical data for XRP market prices can be downloaded from Yahoo! Finance website: Download the data for XRPYou can download blow the excel file used to build the figure. Historical data for XRP can be downloaded from CoinMarketCap or Yahoo! Finance website.
#6 USD Coin (USDC)
Logo of USD Coin
Statistics
Market capitalization: $26.49 billion
Market price : $1.00
Circulating Supply : 26.28 Billion
Year founded: 2018
Overview of USD Coin
The USD Coin (USDC) serves as a stable digital currency, maintaining a steadfast 1:1 value with the US dollar, regardless of the ever-changing tides of the cryptocurrency market. This stability is rooted in its robust foundation – US dollar reserves securely held within regulated US financial institutions. To ensure transparency and reliability, the acclaimed accounting firm Grant Thornton diligently monitors these reserves, releasing detailed monthly attestation reports.
USDC boasts remarkable versatility, seamlessly functioning on various blockchain platforms such as Ethereum, Algorand, Solana, Stellar, and TRON. Key features and use cases of USD Coin are rooted in its stability and ease of use. USDC facilitates seamless, near-instantaneous cross-border transactions and serves as a bridge between traditional finance and the blockchain world, enabling individuals and businesses to transfer value globally without exposure to the volatility inherent in many cryptocurrencies. With its one-to-one peg to the US Dollar, USDC serves as a valuable tool for traders and investors, allowing them to hedge against market fluctuations while remaining within the crypto ecosystem. Moreover, the stablecoin has found application in the decentralized finance (DeFi) sector, where it serves as collateral for loans, liquidity provision, and yield farming, contributing to the vibrant evolution of blockchain-based financial services.
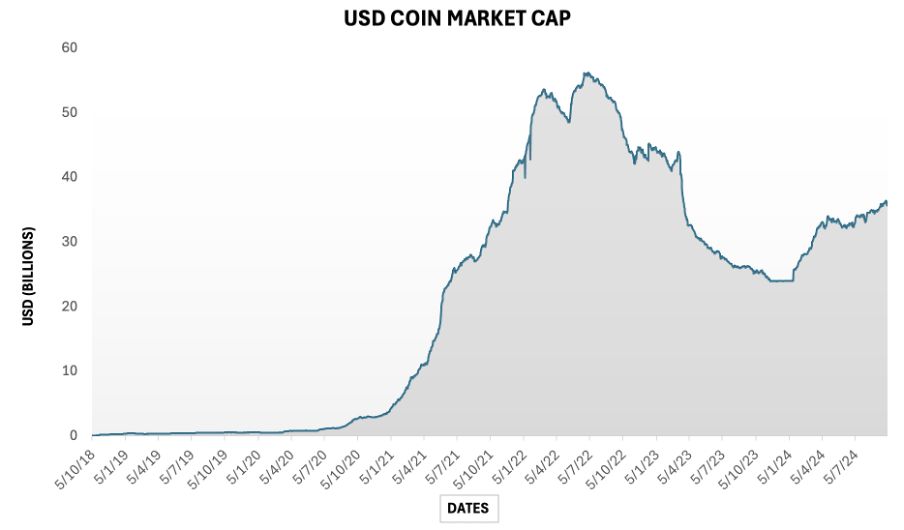
Market capitalization
The figure below gives the market capitalization of USD Coin from October 2018 to September 2024. At a given point of time, market capitalization is obtained by multiplying the number of USD Coin in circulation (coin supply) by the price of USD Coin.
Market Capitalisation Chart of USDC
Source: Yahoo! Finance. (Computation by Author)
The historical data for USD Coin market prices can be downloaded from Yahoo! Finance website: Download the data for USD CoinYou can download blow the excel file used to build the figure. Historical data for USD Coin can be downloaded from CoinMarketCap or Yahoo! Finance website.
#7 Dogecoin (DOGE)
Logo of Doge Coin
Statistics
Market capitalization: $10.88 billion
Market price : $0.077
Circulating Supply: 140.52 Billion
Year founded: 2013
Overview of Doge Coin
Originally conceived as a playful jest aimed at the crypto community, Dogecoin emerged as a whimsical creation inspired by a popular meme. Crafted by the collaborative efforts of software engineers Billy Marcus and Jackson Palmer, the genesis of Dogecoin occurred in the latter part of 2013. Operating on an autonomous blockchain unique to itself, Dogecoin’s digital ledger undergoes ceaseless updates to encompass novel transactions, employing cryptographic techniques to ensure the security of these transactions.
The foundational framework of Dogecoin’s blockchain is rooted in the proof of work consensus mechanism, which necessitates miners to deploy computational prowess in solving intricate mathematical puzzles. This endeavor facilitates the processing and inscription of transactions onto the blockchain. In return for their contributions to upholding the integrity of the blockchain, miners are rewarded with additional Dogecoin holdings, affording them the choice to retain or trade these assets within the open market.
While Dogecoin can feasibly be employed for monetary transactions and acquisitions, its role as a dependable store of value remains compromised. This deficiency primarily arises from the absence of a predetermined upper limit on the quantity of Dogecoins that can be mined, thus inherently imbuing the cryptocurrency with a pronounced inflationary trait.
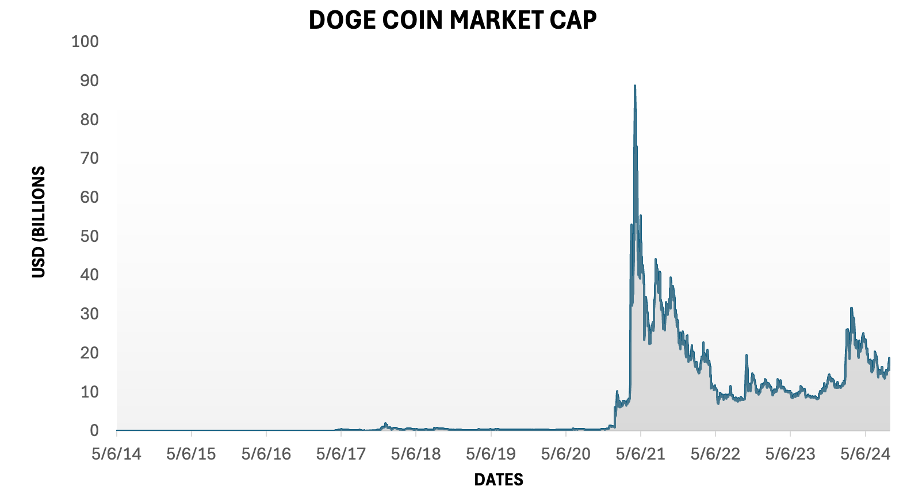
Market capitalization
The figure below gives the market capitalization of Doge Coinfrom July 2014 to September 2024. At a given point of time, market capitalization is obtained by multiplying the number of Doge Coin in circulation (coin supply) by the price of Doge Coin.
Market Capitalisation Chart of Doge Coin
Source: Yahoo! Finance. (Computation by Author)
The historical data for Doge Coin market prices can be downloaded from Yahoo! Finance website: Download the data for DogeCoinYou can download blow the excel file used to build the figure. Historical data for Doge Coin can be downloaded from CoinMarketCap or Yahoo! Finance website.
#8 Cardano (ADA)
Logo of Cardano
Statistics
Market capitalization: $10.77 Billion
Market price : $0.3076
Circulating Supply : 35.03 Billion
Year founded: 2015
Overview of Cardano
Launched in September 2017 by Charles Hoskinson, one of Ethereum’s co-founders, Cardano strives to manifest as a third-generation blockchain initiative, extending the groundwork laid by Bitcoin (first generation) and Ethereum (second generation). Positioned as an eco-friendly and scalable smart contract platform, Cardano (ADA) operates on a proof-of-stake consensus mechanism known as Ouroboros, effectively validating transactions while minimizing energy consumption. The development landscape of Cardano relies on the utilization of the Haskell programming language, an attribute attributed to facilitating an evidence-centric development approach, subsequently ensuring unmatched security and reliability.
The central ambition of Cardano orbits around the facilitation of smart contracts, empowering developers to craft a diverse array of decentralized financial applications, novel cryptocurrency tokens, interactive games, and more. The architecture of the Cardano blockchain is bifurcated into two distinct tiers: the Cardano Settlement Layer (CSL) and the Cardano Computing Layer (CCL). The former houses the record of accounts and their corresponding balances, additionally serving as the domain where Ouroboros-based consensus mechanisms validate transactions. On the other hand, the latter, namely the CCL, serves as the execution ground for all computations related to blockchain applications, primarily driven by the functionality of smart contracts. This partitioning of the blockchain into dual strata endeavors to empower the Cardano network to effortlessly process a substantial volume of up to a million transactions per second.
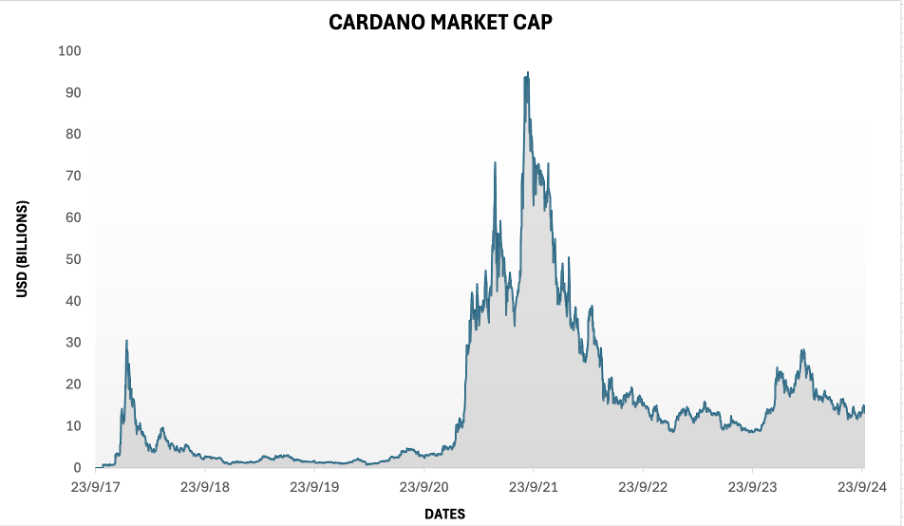
Market capitalization
The figure below gives the market capitalization of Cardano from September 2017 to September 2024. At a given point of time, market capitalization is obtained by multiplying the number of Cardano in circulation (coin supply) by the price of Cardano.
Market Capitalisation Chart of Cardano
Source: Yahoo! Finance. (Computation by Author)
The historical data for Cardano market prices can be downloaded from Yahoo! Finance website: Download the data for CardanoYou can download blow the excel file used to build the figure. Historical data for Cardano can be downloaded from CoinMarketCap or Yahoo! Finance website.
#9 Solana (SOL)
Logo of Solana
Statistics
Market capitalization: $9.62 Billion
Market price : $24.45
Circulating Supply : 405.76 Million
Year founded: 2020
Overview of Solana
Solana, an up-and-coming cryptocurrency, has drawn substantial attention in the world of blockchain. Launched in 2020 by Anatoly Yakovenko, a former Qualcomm engineer, Solana’s coin was meticulously crafted to tackle the scalability and performance limitations that earlier blockchain platforms such as Ethereum had encountered. Solana’s developmental journey gained rapid traction as it aspired to bring about a transformation in the realm of decentralized finance (DeFi). This transformation was to be realized through swifter transaction speeds and reduced fees in comparison to its counterparts. This innovative approach captivated both investors and developers, propelling Solana into the spotlight as a highly promising contender in the expansive landscape of blockchain technology.
At its core, Solana operates as a crypto-computing platform with a distinct objective: to achieve remarkable transaction speeds without compromising decentralization. This exceptional speed translates into a notable reduction in congestion and fees. By maintaining these high speeds and low fees, Solana’s ultimate aim is to scale its capabilities to a level where it can rival centralized payment processors like Visa. The primary cryptocurrency associated with Solana is known as SOL. This digital asset serves multiple purposes, including covering transaction fees and facilitating the staking process. Additionally, SOL holders possess the privilege of participating in voting for upcoming upgrades. Notably, SOL is accessible for trading on exchanges such as Coinbase, providing users with an avenue to engage with this evolving crypto phenomenon.
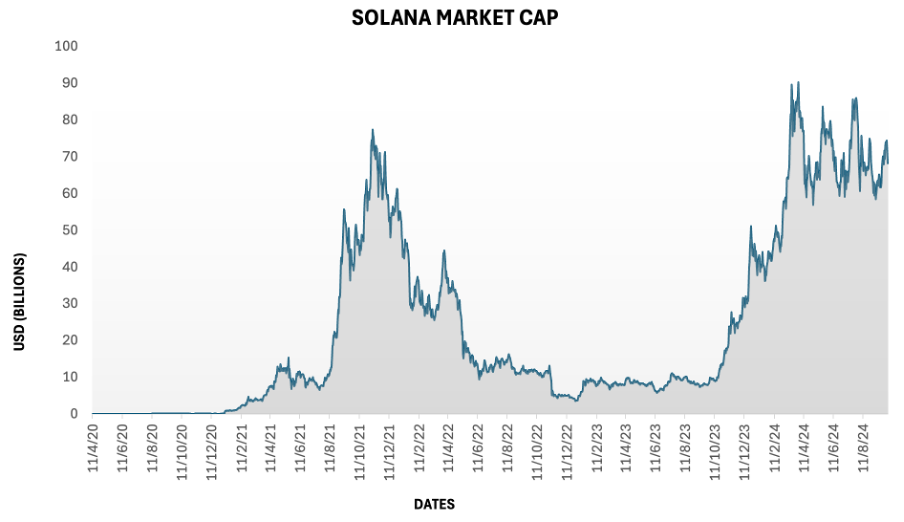
Market capitalization
The figure below gives the market capitalization of Solana from September 2017 to September 2024. At a given point of time, market capitalization is obtained by multiplying the number of Solana in circulation (coin supply) by the price of Solana.
Market Capitalisation Chart of Solana
Source: Yahoo! Finance. (Computation by Author)
The historical data for Solana market prices can be downloaded from Yahoo! Finance website: Download the data for SolanaYou can download blow the excel file used to build the figure. Historical data for Solana can be downloaded from CoinMarketCap or Yahoo! Finance website.
#10 Tron (TRX)
Logo of Iron
Statistics
Market capitalization: $7 billion
Market price : $0.078
Circulating Supply : 89.52 Billion
Year founded: 2017
Overview of Tron
In 2017, Tron launched as a blockchain project with a unique approach, foregoing cryptographic advancements in favor of integrating existing elements like dApps, smart contracts, and tokens pioneered by other projects. Its standout strategy was its Asia-focused market penetration, leveraging its founder Justin Sun’s prominence. Fueled by an engaged community, Tron’s futuristic vision yielded success.
Initially an Ethereum-based ERC-20 token, Tron has transitioned into an independent cryptocurrency. At its core, the Tronix network champions decentralization, freeing blockchain data from central control. Content creators earn TRX tokens for their contributions and can even devise custom tokens for the Tron network, enhancing dApp experiences. With plans to introduce decentralized games and a proof-of-stake consensus mechanism manned by super representatives, Tron’s rapid block additions and support for thousands of transactions per second further underscore its distinctive position in the cryptocurrency realm, complemented by its empowering content creator rewards and ownership model.
Market capitalization
The figure below gives the market capitalization of Tron from August 2017 to September 2024. At a given point of time, market capitalization is obtained by multiplying the number of Tron in circulation (coin supply) by the price of Tron.
Market Capitalisation Chart of Tron
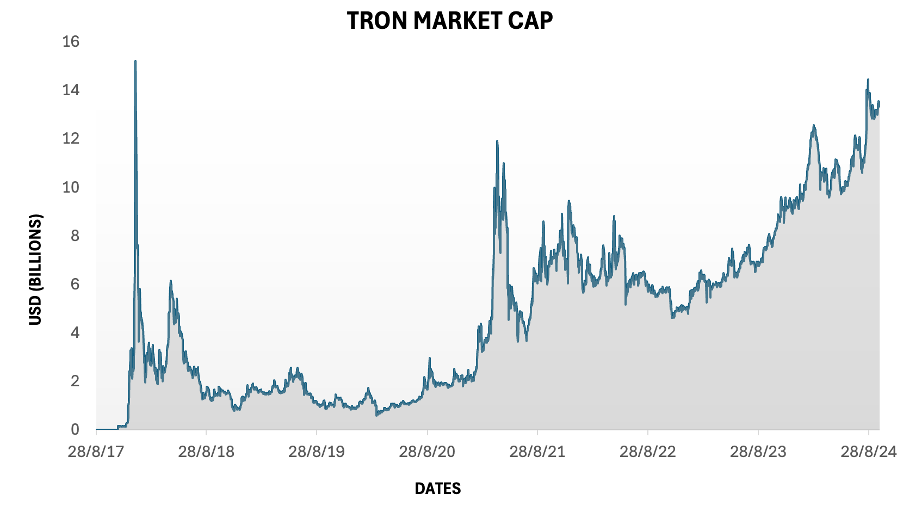
Source: Yahoo! Finance. (Computation by Author)
The historical data for Tron market prices can be downloaded from Yahoo! Finance website: Download the data for TronYou can download blow the excel file used to build the figure. Historical data for Tron can be downloaded from CoinMarketCap or Yahoo! Finance website.
Why should I be interested in this post?
This blog post provides valuable insights into the current landscape of cryptocurrencies. As the digital financial world continues to evolve, learning about the top 10 cryptocurrencies by market capitalization helps us understanding the leading cryptocurrencies and their market standings can provide crucial information for both seasoned investors and newcomers. Whether you’re seeking potential investment opportunities or simply staying informed about the trends shaping the financial future, this article can offer a concise overview of the top-performing cryptocurrencies, making it a must-read for anyone looking to navigate the complex world of digital assets.Related posts on the SimTrade blog
About cryptocurrencies
▶ Snehasish CHINARA Bitcoin: the mother of all cryptocurrencies
▶ Snehasish CHINARA Ethereum – Unleashing Blockchain Innovation
▶ Snehasish CHINARA XRP: Pioneering Financial Revolution
▶ Snehasish CHINARA Tether: Unraveling the Impact of the Stablecoin on Modern Finance
▶ Snehasish CHINARA USD Coin: Deep Dive into the Role of Stablecoins in Modern Finance
▶ Snehasish CHINARA Doge Coin: Unraveling the Phenomenon of the Internet’s Favourite Cryptocurrency
▶ Snehasish CHINARA Solana: Ascendancy of the High-Speed Blockchain
▶ Snehasish CHINARA BNB’s Journey through the Digital Economy’s Cryptocurrency Landscape
▶ Snehasish CHINARA Tron: Unveiling the Future of Decentralized Applications
▶ Snehasish CHINARA Litecoin: Analysis of the Pioneering Cryptocurrency’s Impact on Digital Finance
▶ Snehasish CHINARA How to get crypto data
▶ Alexandre VERLET Cryptocurrencies
About statistics
▶ Shengyu ZHENG Moments de la distribution
▶ Shengyu ZHENG Mesures de risques
▶ Jayati WALIA Returns
Useful resources
Academic research about risk
Longin F. (2000) From VaR to stress testing: the extreme value approach Journal of Banking and Finance, N°24, pp 1097-1130.
Longin F. (2016) Extreme events in finance: a handbook of extreme value theory and its applications Wiley Editions.
Data
Yahoo! Finance Historical data for Litecoin
CoinMarketCap Historical data for Litecoin
About the author
The article was written in October 2024 by Snehasish CHINARA (ESSEC Business School, Grande Ecole Program – Master in Management, 2022-2025).