The NFTs, a new gold rush?

The NFTs, a new gold rush?

Alexandre VERLET

In this article, Alexandre VERLET (ESSEC Business School, Master in Management, 2017-2021) explores the latest tech trend, which could revolutionize the art market and so much more.

These three letters are on everyone’s lips right now: NFT (for non-fungible token). But have you figured out what it’s really about? Let’s get into that special world of art, blockchain and people rich enough to buy a single tweet or jpg image. Jack Dorsey, CEO of Twitter, has put his very first tweet up for sale; the current auction is at $2.5 million (about €2 million). Sound like a lot? Canadian artist Grimes (and companion of the whimsical Elon Musk) has put up for sale an entire collection of digital works for nearly 6 million, while the most expensive single work sold to date is an animation showing Donald Trump, naked, being mocked by a blue bird. Its price? $6.6 million. But let’s get back to the basics and technique by detailing what an NFT, or non-fungible token, actually is.

Fungible vs non-fungible

First of all, let’s explain what a fungible element is and how it differs from a non-fungible element. The dictionary gives the following definition of the word “fungible”: things that are consumed by use and can be replaced by things of the same kind, quality, and quantity (e.g., commodities, cash).This means that it is something that has a value, but can be replaced by an equivalent of the same nature. For example, a coin that has no traceability, no serial number and will have the same value as a similar coin. Conversely, a non-fungible item cannot be replaced or substituted. For example, imagine a plane ticket: it is an object that can be consumed (in the sense that it can be bought), but its number, the fact that it is linked to a name and a particular seat on a given flight prevents it from being substituted for any other plane ticket.

What is a NFT (non-fungible token)?

An NFT applies this principle by adding a cryptographic layer based on an ERC (Ethereum Request for Comment) blockchain. This means that an NFT can be registered and exchanged just like an Ethereum (the second largest cryptocurrency after Bitcoin). This unique virtual token can then be used as a certificate for anything and everything, whether it is a real or digital good. Only its holder will be able to justify its possession, while it is possible to check the path of this token throughout its life. An NFT allows you to justify a purchase and prove its authenticity, whatever you have bought. Even a simple tweet, which may one day go down in history and be worth billions of dollars. The very principle of the blockchain ensures the encryption of information and its security, making each NFT unfalsifiable with today’s technical possibilities.

What can you buy with an NFT?

Technically, an NFT can be used as a certificate for anything. A famous painting, an official pair of sneakers… but where NFTs really come into their own is for digital assets. It’s easy to prove you own a painting or a pair of shoes, it’s harder to prove you bought a tweet from Jack Dorsey. But above all, it is a real revolution in the art world since any digital creation can now be identified and recognized as a unique work, thus immediately taking on value, like anything else that is unique. Some things, such as memes, can thus be considered as unique works.

Why buy a virtual image when you can copy it?

A question that often comes up is that of copying. What is the point of buying a 6.6 million dollar video or a single image when they are available everywhere on the net and can be downloaded and admired without any problem? Simply for the art and the joy of owning something unique. In a few seconds, you can find a reproduction of the Mona Lisa on Google Images and there is nothing to stop you from printing it and displaying it in your living room. However good your printer is, you will never own THE Mona Lisa by Leonardo da Vinci. Speculation and the principle of supply and demand do the rest and allow some works to be exchanged for several millions. And this is only the beginning.

The limits of NFTs

In front of this picture of the future that is being painted in real time before our eyes, there are a few fences linked to technical, ethical and legal limits. The biggest one being the cost of the blockchain. The Ethereum blockchain is currently particularly energy-intensive, which makes it expensive to use. From an ecological, ethical and economic point of view, relying on an ERC chain today is a miscalculation. “Today. Cryptocurrencies and blockchain in general are still in their infancy and the arrival of Ethereum 2.0 (a version that completely changes the principle of this blockchain in order to simplify and fluidify its operation expected in the next few years) could well solve these problems. Whatever you think about NFTs being a good investment or not, you will probably hear about them a lot in the coming years.

Related posts on the SimTrade blog

   ▶ Verlet A. Cryptocurrencies

About the author

Article written in July 2021 by Alexandre VERLET (ESSEC Business School, Master in Management, 2017-2021).

Cryptocurrencies

Cryptocurrencies

Alexandre VERLET

In this article, Alexandre VERLET (ESSEC Business School, Master in Management, 2017-2021) explores explores the latest and most fashionable investment trend.

They are everywhere on the news, in (young) people’s daily conversations, and probably in a corner of your head if you have already invested a bit of money in them. Cryptocurrencies are a daily drama, as it allows people to make or lose big money in record time. Everyone’s heard of it, but few people actually understand where cryptos come from and how they work. You may not necessarily need that to invest in them in the short term, as simply following Elon Musk on twitter might be a quicker and more efficient way  to predict its evolution. But in the long run, and to understand the impact it will have on society, you need to know what’s going on. For some, it might become an actual currency in the coming years and will compete with the national currencies. For others, regulation will eventually tame cryptos and people will therefore lose interest in them. What’s for sure is that a public debate will arise at some point, and you might as well have the keys to understand cryptos so you can forge your own opinion. So here we go.

What is  a cryptocurrency?

In a nutshell, it’s a virtual currency. What makes it a completely different and original currency is that it is not centrally managed; in other terms, it is the user who has full control over the cryptocurrency in their possession (peer-to-peer). This process is done through the implementation of Blockchain technology: the latter is a distributed and decentralized data storage and transmission technology at its core. The most frequently used analogy is that of a ledger that is accessible to all, indestructible and unpublishable once the data is embedded in the system. Like cryptocurrency, the Blockchain also relies on peer to peer to operate in a decentralized manner. Note that Blockchain can be used for much more than cryptocurrency; being a database, this technology represents a potentially huge evolution in the way we (businesses) deal with data. However, it was with the advent of Bitcoin, the first of many cryptocurrencies, that the distributed blockchain was seen as a potential successor to existing storage technology. The main cryptocurrencies are Bitcoin- the world’s most widely used and legitimate cryptocurrency-, Ethereum – founded in 2015 and known for its enhanced architecture using “smart contracts”-, Litecoin – released in 2011, similar to Bitcoin but with a higher programmed supply limit (84 million units vs 21 million).

Where do cryptos come from?

Before cryptos as we know them were invented, some early cryptocurrency proponents already shared the goal of applying cutting-edge mathematical and computer science principles to solve what they perceived as practical and political shortcomings of “traditional” currencies. It goes back to the 1980s when an American cryptographer named David Chaum invented a “blinding” algorithm that allowed for secure, unalterable information exchanges between parties, laying the groundwork for future electronic currency transfers. Then, the late 1990s and early 2000s saw the rise of more conventional digital finance intermediaries, such as Elon Musk’s Paypal. But no true cryptocurrency emerged until the late 2000s when Bitcoin came onto the scene. Bitcoin is widely regarded as the first modern cryptocurrency, because it combined decentralized control, user anonymity, record-keeping via a blockchain, and built-in scarcity. It all began in 2008, when Satoshi Nakamoto (an anonymous person or group of people) published a white paper about the Bitcoin. Nakamoto then released Bitcoin to the public. In 2010, the very first Bitcoin purchase was made: an Internet user exchanged 10,000 Bitcoins for two pizzas. At today’s prices, that would be the equivalent of about 500 million euros: that’s a lot of money for a pizza. By late 2010, dozens of other cryptocurrencies started popping out as more and more people started to mine and exchange cryptos. It grew in legitimacy when it became accepted as a means of payment by major companies, such as WordPress, Microsoft or Tesla. As of May 2021, the cryptos’ market cap is $2 trillion.

How do cryptos work?

There are several concepts that you should know about in order to get how cryptos work. Cryptocurrencies use cryptographic protocols, or extremely complex code systems that encrypt sensitive data transfers, which make cryptos them virtually impossible to break, and thus to duplicate or counterfeit the protected currencies. These protocols also mask the identities of cryptocurrency users.Then the crypto’s blockchain records and stores all prior transactions and activity, validating ownership of all units of the currency at all times. Identical copies of the blockchain are stored in every node of the cryptocurrency’s software network — the network of decentralized server farms, run by miners, that continually record and authenticate cryptocurrency transactions. The term “miners” relates to the fact that miners’ work literally creates wealth in the form of brand-new cryptocurrency units. Miners serve as record-keepers for cryptocurrency communities, using vast amounts of computing power, often manifested in private server farms owned by mining collectives that comprise dozens of individuals. The scope of the operation is quite similar to the search for new prime numbers, which requires tremendous amounts of computing power. Miners’ work periodically creates new copies of the blockchain, adding recent, previously unverified transactions that aren’t included in any previous blockchain copy — effectively completing those transactions. Each addition is known as a block, which consist of all transactions executed since the last new copy of the blockchain was created. Sincce the cryptocurrencies’ supply and value are controlled by the activities of their users and highly complex protocols built into their governing codes, not the conscious decisions of central banks or other regulatory authorities, which is why cryptos are said to be decentralized. Although mining periodically produces new cryptocurrency units, most cryptocurrencies are designed to have a finite supply — a key guarantor of value. Generally, this means miners receive fewer new units per new block as time goes on. For instance, if current trends continue, observers predict that the last Bitcoin unit will be mined sometime around 2150.

Why are cryptocurrencies so successful?

You may be wondering why crypto-currencies are gaining so much momentum today. With no intrinsic value, and no commodity to fall back on, economically speaking it makes no sense for this market to reach such an astronomical price. There are two rationales that often come up in the argument for cryptocurrencies. On the one hand, the anonymity via cryptography provided by blockchain technology: as there is very little regulation in this industry yet, one can end up with astronomical amounts of money without necessarily having to pay taxes on it, as there is no centralized body to follow what is going on. The second reason is more sociological: since there are people mining and trading cryptocurrencies, the logic is that they must have value. The consequence is that other people join the rush, and so on until it becomes a global phenomenon. You could call it a crowd movement, or a 21st century digital gold rush.

But these two reasons don’t necessarily answer the question of why Bitcoin and all these other cryptocurrencies are valuable. To get a clear answer, we need to go back to the basics of economics: any value applied to a commodity or currency is subjective. That is, if we, as individuals, see value in it, the commodity in question has value. The snowball effect resulting from a group of people’s growing interest in a commodity is at the origin of any bubble, and from that point of view cryptos are a massive bubble. Which does not mean that it is a bad investment: after all, a bubble is a bubble when it blows up, but it might never happen.

Summary

To sum up, if you want to invest in cryptocurrencies, there are a couple of things you should consider. First, if you’re aiming for the long-term (if you believe cryptocurrencies will keep increasing in value as “deflationary currencies”) or the short-term (pure speculation). Second, you should examine the specific characteristics of the cryptos and see which best fits you in terms of anonymity, growth potential and liquidity. Last but not least, follow the latest regulation announcements on cryptos, such as central banks or governments comments on cryptos, which are a pretty good indicator of the crypto’s evolution on both the long and short term.

Related posts on the SimTrade blog

   ▶ Verlet A. The NFTs, a new gold rush?

About the author

Article written in July 2021 by Alexandre VERLET (ESSEC Business School, Master in Management, 2017-2021).

Inflation and the economic crisis of the 1970s and 1980s

Inflation and the economic crisis of the 1970s and 1980s

Alexandre VERLET

In this article, Alexandre VERLET (ESSEC Business School, Grande Ecole Program – Master in Management, 2017-2021) goes back on the inflation issue of 1970’s/1980’s and the lessons it teaches us for the 2020’s.

In the developed capitalist countries, the fight against inflation became the top priority of economic policy in the 1970s. Georges Pompidou’s famous formula: “better inflation than unemployment” was buried for good. Inflation can be defined as the continuous and self-sustaining rise in the general price level. It is the result of a monetary struggle conducted by the various economic agents to maintain or increase their income or their capital: it has winners and losers. For economic decision-makers, inflation is a “sweet poison”: on the one hand, it is a factor of growth (by stimulating investment and consumption, and at the same time favoring production and employment); on the other hand, it is a danger for this same growth if the rise in prices gets out of hand (trade deficit, capital flight, ruin of savers). By what mechanisms does the inflationary growth of the 1960s give way to the rapid stagflation of 1973-1986?

Low inflationary growth was at the heart of the virtuous circle of the Trente Glorieuses

The Second World War and the post-war period were times of great inflationary pressure due to the large-scale expenditure by governments to finance the war effort, economic reconstruction and the establishment of the welfare state. France struggled with the problems of currency and price stability. Germany had the lowest inflation of the OECD countries since the monetary reform of 1948 and the priority given to a strong currency. Some countries, such as France, had chronic inflation. The debate raged in the years 1945-1952: a man like Mendès-France resigned from the government in 1945 to protest against monetary and budgetary laxity, stating that “distributing money to everyone without taking it from anyone is to maintain a mirage… “(extract from his letter of resignation, June 6, 1945). The growth of the 1950s and 1960s was generally not very inflationary in the developed countries: the Bretton Woods agreements ratified the stability of exchange rates around the dollar, the only reference currency convertible into gold. However, it was not until 1958 that European currencies regained their convertibility. Wartime periods remained inflationary: the Korean War (1950-53), for example, during which there was a rise in the price of raw materials, an increase in public spending in the United States and an increase in the circulation of dollars. From the beginning of the 1950s, once reconstruction had been completed, to the beginning of the 1960s, inflation fluctuated between 1 and 4% per year in the industrial countries. Moreover, Keynesian economic policies aimed to stimulate demand through deficit spending, which created inflation, and then to contain the pressure of demand when tensions were too great, so that inflation was limited. The alternation of stimulus (inflation) and austerity (deflation) took the form of the stop-and-go policy that characterized Great Britain and the United States in the 1950s. Consequently, in a period of full employment, a certain amount of “natural” unemployment is accepted in order to avoid too much pressure on wages and therefore on prices, as demonstrated by the British economist A.W. Philllips (Economica Journal, 1958).  Inflation is in this perspective a lesser evil: it is seen as a painless way of financing growth: in fact, it works in favor of companies that go into debt, it has a favorable effect on their financial profitability. In a country such as France, it makes it possible to arbitrate social conflicts by defusing profit/wage tensions (the government negotiates both wage increases and low-cost credit).

 The 1960s: the “inflationary spiral” begins to get out of control

From 1961-62 onwards, the developed industrial countries experienced an acceleration in price increases: a significant and lasting rise in inflation, from 3 to 5% until the early 1970s. During this period, there was no significant reduction in unemployment and even a slight increase in the number of job seekers: is this the end of the jobless era? In any case, the Phillips curve seemed to apply more and more poorly to the economic situation. There are several causes for this. Firstly, the growing importance of budget deficits: due to the use of deficit spending in the Keynesian logic; due to the implementation of the welfare state and social programs: for example, in the United States, the New Frontier programs of J.F. Kennedy and the Great Society of L. Johnson. Secondly, the deterioration of the international monetary system: devaluation of the pound sterling, crisis of the dollar at the end of the 1960s. Lastly, the wage increases outstripped productivity gains, which were slowing down: the “crisis of Fordism”: in other words, inflation through wage costs.

The 1973 and 1979 oil shocks

As seen previously, the 1970’s inflation is a consequence of economic phenomena already observed in the 1960’s.  However, the two oil shocks were game changers. This time we are talking about cost inflation: the cost of energy supply is at stake, with the price of a barrel of oil multiplying by more than 11 in 1973 and 1979. This explains why inflation continues even when demand is lacking, when there is stagflation and part of the production capacity is unused. During classical crises, overproduction results in a general fall in the price level and a collapse of production, as shown by the Great Depression of the 1930s. On the contrary, during the crisis of the 1970s, prices rose continuously after the two oil shocks of 1973 and 1979, while production was very unstable (after a collapse in 1973-1974, it picked up again in 1975-1976). Inflation was now high: from an average of around 5% per year in the early 1970s, it rose to double-digit figures between 1973 and 1975, and again between 1979 and 1982.

The economic consequences of inflation

The crisis is industrial and commercial: companies’ profits collapse because of rising costs; their international competitiveness is severely damaged because of the relative rise in prices. The crisis is social: the unemployment curve follows that of inflation, but without showing any real inflection between 1973 and 1982: it calls into question the Phillips curve analysis, as there is a simultaneous rise in unemployment and inflation. The number of unemployed in the OECD rose from 10.1 million in 1970 to almost 33 million in 1983, which roughly corresponds to a tripling. European countries seem to be particularly affected: unemployment has multiplied by almost 4 in the same period. The crisis is also financial. On a national scale, part of the population is ruined by rapid inflation (savers, rentiers, farmers, employees), while another part makes significant gains (speculators). On an international scale, the debt of Third World countries literally exploded: from 130 billion dollars in 1973 to more than 660 billion dollars in 1983. Currencies tend to depreciate, which causes a generalized rise in prices: galloping inflation becomes global (Mexico for example). What’s more, Keynesian policies further reinforced the symptoms that had been combated, and were strongly criticized by the monetarist movement. Double-digit inflation makes Keynesian anti-crisis policies ineffective. For example, with an inflation rate of 13.5% in 1980 in France, the inflationary policy of President F. Mitterrand had disastrous effects on the competitiveness of French firms: it wiped out their margins, caused them to lose market share and finally penalized foreign trade. The fight against inflation became the main objective of monetarist policies. For Mr. Friedman, it is necessary to return to Phillips’ interpretation: it applies in a transitory way in the history of capitalism, when economic agents cannot predict or anticipate the rate of inflation. It is no longer a question of explaining inflation by the state of the labor market, but the opposite: it is the inflation anticipated by consumers that explains the tensions on the labor market; he shows that Keynesian recipes increase inflation through money creation without any effect on employment (because consumers anticipate it, consume less, which translates into a reduction in employment among producers). More inflation leads to more unemployment and, in an open economy, a decrease in the competitiveness of companies. The 1970’s crisis sheds light on how inflation works and to what extent the Phillips curve model can be applied to real-world situations. This useful to remember in a time when inflation is coming back for the first time in thirty years.

Related posts on the SimTrade blog

   ▶ Alexandre VERLET The return of inflation

   ▶ Louis DETALLE Understand the mechanism of inflation in a few minutes?

   ▶ Bijal GANDHI Inflation Rate

   ▶ Raphaël ROERO DE CORTANZE Inflation & deflation

About the author

Article written in July 2021 by Alexandre VERLET (ESSEC Business School, Grande Ecole Program – Master in Management, 2017-2021).

Throwback to the Karlsruhe vs ECB fight, one year ago

Throwback to the Karlsruhe vs ECB fight, one year ago

Alexandre VERLET

In this article, Alexandre VERLET (ESSEC Business School, Grande Ecole Program – Master in Management, 2017-2021) explores the legal thriller of 2020, in which the opposition between German orthodoxy and the flexible monetary policy came to light.

On May 5th 2020, the Constitutional Court of Karlsruhe released a decision. It stated that the government debt purchase programme performed by the European Central Bank was not in line with the ECB’s mandate under the European treaties. This decision came at a critical time when the ECB implemented a second large-scale quantitative easing programme in response to the Covid-19 economic crisis. You might have just heard the story in the media, but such an event is a key element of 2020’s economic and financial news, as the future of the ECB and the quantitative easing programme are at stake here.

Which part of the ECB’s action is being criticised by the German constitutional court?

Basically, the quantitative easing programme and its public debt paybacks are being targeted in the legal decision. Let us recall what the ECB did exactly. On 22 January 2015, the European Central Bank announced the implementation of an Expanded Asset Purchase Programme (APP or EAPP). This programme provided for asset purchases amounting to €60 billion per month in the secondary market. It aims to provide monetary support to the economy at a time when the ECB’s key interest rates have reached their zero lower bound, by easing financing conditions for companies and households. Investment and consumption should ultimately contribute to a return of inflation to levels close to 2%, in line with the objective of the ECB’s mandate. It should be noted that this programme is distinct from the Outright Monetary Transactions (OMT) initiated in 2012, the primary objective of which is financial stability by reducing the cost of financing for euro area countries. On 4 March 2015, in the context of the EAPP, the ECB Governing Council established a substantial sub-programme of purchases of Member States’ securities, the Public Sector Purchase Programme (PSPP). The PSPP provides for each national central bank to purchase eligible securities from public issuers in its own country according to the capital key for the ECB’s capital subscription. This sub-programme is by far the largest component of the ECB’s unconventional quantitative easing (QE) policy, accounting for almost 84% of the ECB’s net purchases in July 2019, with the remainder split between the other three sub-programmes – the asset-backed securities purchase programme (ABSPP – 8%), the covered bond purchase programme (CBPP3 – 1%) and, since March 2016, the corporate sector purchase programme (CSPP – 7%). 90% of purchases under the CSPP are made in domestic sovereign bonds and 10% are allocated to supranational issuers (international organisations, development banks, etc.).

A highly political decision

The recent decision by the Constitutional Court in Karlsruhe echoes the case brought by German businessman Heinrich Weiss at the start of the PSPP in 2015, which accused the ECB of overstepping its mandate by financing eurozone states – particularly the less creditworthy ones. The Karlsruhe court referred the case to the Court of Justice of the European Union (CJEU) in 2017, which found that the PSPP did not infringe the ECB’s prerogatives. In its decision of 5 May 2020 , the Constitutional Court in Karlsruhe now considers itself competent to rule on the non-compliance of the ECB programme, to contradict the CJEU and to question the Bundesbank’s participation in the PSPP. There is a political significance to this decision, which reflects a real split between Germany and the ECB since the European sovereign debt crisis. The Karlsruhe decision should therefore be understood as the latest disagreement between the traditional German and ECB views, which have been increasingly diverging since 2011. Initially, the ECB’s structures were modelled on the Bundesbank, both in terms of its political independence and its hierarchical mandate. Price stability is the ECB’s primary objective, enshrined in Article 127 of the TEU. To achieve this, its strategy combines both quantitative monetary targeting – again a legacy of the Bundesbank – and inflation targeting. The TEU also provides that “without prejudice to the primary objective of price stability, the ESCB [European System of Central Banks] shall support the general policies in the Union”; the ECB’s mandate thus does not exclude the possibility of a policy whose secondary effects support the growth and employment objectives defined by the Member States. Indeed, the ECB’s bulletins and communiqués show that growth and employment are constant concerns, and the sovereign debt crisis and the arrival of Mario Draghi endorsed a broader interpretation of the ECB’s mandate.The growing divergence between the Bundesbank and the ECB was marked by the recurrent clashes between Mario Draghi, the new ECB head from 2011, and Jens Weidmann, who was appointed President of the Bundesbank in the same year. Jens Weidmann was appointed by Angela Merkel following the resignation of Axel Weber, who was known for his sharp criticism of the debt buyback programme for fragile eurozone states, which would have cost him the ECB presidency for which he was a candidate. Considered at the time of his nomination as less dogmatic than his predecessor, Jens Weidmann nevertheless continued the fight of his predecessor and systematically criticised the ECB’s debt buyback programmes. Shortly after Axel Weber’s resignation, Jürgen Stark, the ECB’s chief economist, had himself resigned in protest at the accommodating policy then being pursued by Jean-Claude Trichet, considering that “a fiscal stimulus would only increase the level of debt and therefore only increase these risks”.

What could explain the German exception?

Germany is the Euro Zone’s most powerful member, so it is one of the few countries that can actually rebel agains the ECB. But France never did, so there is a clearly a German exception linked to Germany’s economic culture and financial history. When the ECB announced the resumption of quantitative easing on 12 September 2019, the dissension became even stronger. Sabine Lautenschläger, one of the six members of the ECB’s Executive Board, resigned shortly after Christine Lagarde, recently appointed as successor to Mario Draghi, indicated that she wanted to continue her predecessor’s policy. In an interview with the German tabloid Bild in September 2019, the Bundesbank President openly criticised the resumption of quantitative easing; the article in question was also made famous by its illustration depicting Mario Draghi as Count Dracula ready to “suck the blood of German savers”. Interestingly, concern about the adverse effects of lower rates on savers is a constant in German concerns, as is the sovereign debt of fragile eurozone states. German households save on average more than 18% of their income in 2019, one of the highest rates in Europe. From 2015 to 2020, the real interest rate was -0.9% in the eurozone, which may explain German dissatisfaction with the negative rate effects partly caused by quantitative easing. German public opinion was therefore unfavourable to the resumption of the programme in September 2019. In addition to this, there were some high-profile decisions, such as the Munich Savings Bank, which at the same time decided to pass on these negative rates to some of its customers’ deposits. It is therefore these concerns combined with the trauma of the sovereign debt crisis that have pushed German opinion towards support for a more orthodox monetary policy, which the Karlsruhe ruling has materialised, and all the more so after the announcement of the large-scale €750bn Pandemic Emergency Purchase Programme on 18 March 2020 by the ECB.

Is Karlsruhe right about the ECB not respecting its mandates?

Through the PSPP, the ECB fulfills its second objective of supporting Member States’ economic policies by enabling convergence of inflation rates but also convergence of the long-term interest rates of the euro area Member States and a more sustainable public debt path than in the absence of the PSPP (see above): in short, the fulfillment of the convergence criteria. In particular, the PSPP has led to a significant reduction in Member States’ sovereign bond yield spreads (see sovereign bond yield spreads graph): the standard deviation of different sovereign bond interest rates has fallen from almost 5% in 2015 (and 3% in 2016) to 1% in 2018 and 2019. So the ECB’s action via the PSPP and the PEPP seems today to live up to expectations from an economic point of view. Nevertheless, Karlsruhe considers that there is a potential violation of European treaties because the ECB and the European court of justice – which approved the PSPP in December 2018 – did not provide evidence that proportionality had been duly considered.  Karlsruhe cites easier financing conditions for member states or the banking system, and ‘penalizing’ savers, but the court seems to ignore that the PSPP’s effects are not any different from those of other ECB instruments. Either the PSPP does not violate the proportionality principle, or all ECB instruments do. What’s more, if for instance, in considering an interest rate rise to counter inflationary pressures, the ECB found this would produce losses for bondholder or increase unemployment, then the ECB’s would be considering objectives that are explicitly out of its mandate. What the German court reproaches the ECB is rather paradoxical and the economic basis of the legal decision is weak , but it definitely show that there is a need for a redefinition of the ECB’s mandate. It could become a non-hierarchical dual mandate, more similar to the US Federal Reserve model. The ECB would thus have a clear function of pursuing a price stability objective combined with a full employment objective. The mandate could be materialized not by the definition of a monetary target, the evolution of the monetary aggregate M3 and inflation, as it currently is, but by the establishment of an implicit nominal anchor on the so-called “neutral” rate theoretically allowing the euro area to reach its potential growth. Nevertheless, such evolution of the ECB’s mandate will have to wait until the end of the Covid-19 crisis, and nothing has prevented the Bundesbank from implementing the ECB’s policy since Karlsruhe released its decision one year ago. Adding to that, the possible return of inflation might jeopardize the sustainability of further quantitative easing programmes. To be continued..

About the author

Article written in July 2021 by Alexandre VERLET (ESSEC Business School, Grande Ecole Program – Master in Management, 2017-2021).

The Top 5 Impact Investing Financial Firms

The Top 5 Impact Investing Financial Firms

Anant Jain

In this article, Anant JAIN (ESSEC Business School, Grande Ecole Program – Master in Management, 2019-2022) talks about the top 5 Impact Investing financial firms on the basis of assets under management.

Introduction

Impact investing is defined as an investment decision made with the aim to generate positive social and environmental impact that can be measured, along with positive financial performance. It is essentially an investment strategy that may take the form of numerous asset classes and may result in many specific outcomes. The main point of impact investing is to utilize money and investment capital for positive social results.

Impact investing considers both the physical investments of firms (on the assets side of the balance sheet of the firm) and their impact on the environment and society, and the financial investments of investors, debt, or equity (on the liabilities side of the balance sheet of the firm) to finance the physical investments.

Impact investing is concerned with investing in firms that will create measurable societal benefits along with positive financial returns. Impact investing focuses on addressing a social or environmental issue, such as education, gender equality, renewable energy, to name a few.

Asset Under Management (AUM) is the cumulative market value of investments, that a person or entity manages on behalf of their respective clients.

As published by BlueOrchard Finance (on 08/01/2020), the top five impact investing firms based on assets under management are:

  • #1 Triodos Investment Management
  • #2 Vital Capital Fund
  • #3 BlueOrchard Finance
  • #4 The Reinvestment Fund
  • #5 Community Reinvestment Fund

#1 Triodos Investment Management

Impact Area: Renewable Energy
Location: Zeist, Netherlands
Year Founded: 1980

Triodos Investment Management, headquartered in the Netherlands, is a subsidiary of Triodos Bank (one of the world’s leading sustainable banks). Triodos has approximately $5 billion in assets under management. It is a globally acknowledged leader in impact investing. It offers investable solutions to solve today’s numerous significant sustainability challenges. Since 1995, Triodos has been actively involved in impact investing. Triodos is also one of the founding members of the Global Impact Investing Network (GIIN). Having more than 25 years of experience in impact investing, Triodos established its global expertise in Energy & Climate, Inclusive Finance, Sustainable Food & Agriculture, and Impact Equities & Bonds. The main areas where its investments are spread are Europe, South America, Africa, India, and Southeast Asia.

#2 Vital Capital Fund

Impact Area: Development
Location: Zurich, Switzerland
Year Founded: 2010

Vital Capital is a prominent impact investment, private equity fund. It primarily focuses on sub-Saharan Africa. Having more than 30 years of experience in Africa, its impact investing has delivered essential development growth to millions of individuals in low and middle-income communities. Vital Capital invests in businesses and projects designed to enhance the quality of life and offers substantial investment returns. With more than $350 million in assets under management, Vital Capital Funds primarily focuses on health care, agro-industrial projects, renewable energy, sustainable infrastructure, and education.

#3 BlueOrchard Finance S.A.

Impact Area: Microfinance
Location: Zurich, Switzerland
Year Founded: 2001

BlueOrchard Finance has invested more than $8 billion across more than 90 countries, including Asia, Latin America, Africa, and Eastern Europe. It has achieved an impact on more than 215 million people affected by poverty in emerging markets by providing them with access to financial and related services. BlueOrchard Finance was founded as part of a United Nations initiative in 2001 to mobilize market forces to alleviate poverty and empower them to create a better life. BlueOrchard Finance was the first commercial institution to microfinance investment globally. It provides both debt and equity funding to small businesses. It focuses on alleviating hunger and poverty, establishing food production and education programs, fostering entrepreneurship, and working on climate change issues.

#4 Reinvestment Fund

Impact Area: Community Development
Location: Philadelphia, Pennsylvania, USA
Year Founded: 1985

Reinvestment Fund is a national financial institution in the USA that generates opportunities for under-resourced people and areas via partnerships. Headquartered in Philadelphia, Pennsylvania, Reinvestment Fund has an estimated $2.5 billion in assets under management. The Reinvestment Fund finances housing projects, access to health care, educational programs, and job initiatives. Reinvestment Fund officially works with offices in Atlanta, Philadelphia, and Baltimore. It provides them with public policy advice and data analysis services to assist in developing community programs.

#5 Community Reinvestment Fund, USA

Impact Area: Community Development
Location: Minneapolis, Minnesota, USA
Year Founded: 1988

Community Reinvestment Fund (CRF) is a not-for-profit organization with a mission to empower people, improve their lives, and empower the communities through innovative financial solutions. Community Reinvestment Fund was founded in 1988, in Minneapolis, Minnesota. It is accredited as a community development financial institution. CRF develops products and services to increase the flow of capital to historically underinvested communities across the USA. With more than $3 billion in assets under management, CRF has utilized these funds to help increase job creation and economic development, provide affordable accommodations, and aid with communal amenities.

Related posts on the SimTrade blog

▶ Anant JAIN Impact Investing

▶ Anant JAIN Environmental, Social & Governance (ESG) Criteria

▶ Anant JAIN Socially Responsible Investing

Useful resources

Triodos Investment Management

Vital Capital Fund

BlueOrchard Finance

The Reinvestment Fund

Community Reinvestment Fund

Global Impact Investing Network (GIIN)

About the author

The article was written in July 2021 by Anant JAIN (ESSEC Business School, Grande Ecole Program – Master in Management, 2019-2022).

MSCI ESG Ratings

MSCI ESG Ratings

Anant Jain

In this article, Anant JAIN (ESSEC Business School, Grande Ecole Program – Master in Management, 2019-2022) talks about MSCI ESG Ratings.

Introduction

MSCI ESG Rating is a measure of a company’s commitment to environmental, social, and governance (ESG) criteria and socially responsible investments (SRI). The MSCI ESG rating focuses on a company’s exposure to financially relevant ESG risks. It applies a rule-based methodology to distinguish companies into industry leaders and laggards based on their exposure to ESG risks and their relative aptitude to manage those risks compared to their peers. The ESG Ratings are ranked from leader (AAA, AA) to average (A, BBB, BB) to laggard (B, CCC).

Rating companies on the basis of ESG dimensions enables socially conscious investors to screen potential investments according to their personal investment goals and values.

Environmental, social, and governance (ESG) criteria

ESG criteria constitute a framework that helps socially conscious investors screen potential investments that incorporate their personal values/agendas. The ESG criteria screen companies based on sound environmental practices, healthy social responsibilities and moral governance initiatives into their corporate policies and daily operations.

Socially responsible investing (SRI)

SRI is a type of investment that is categorized to be socially responsible due to the nature of the operation the company conducts. SRI is an investment that considers two aspects:1) social/environmental changes; 2) financial performance. In other words, socially responsible investors promote practices that they believe will lead to environmental benefits, consumer protection, racial/gender diversity, etc. Some socially responsible investors also do the opposite of investing by avoiding companies that negatively impact society, such as alcohol, tobacco, deforestation, pollution, etc.

How Do MSCI ESG Ratings Work?

Over the past decade, ESG investing has become more popular. In 2020, the US SIF: The Forum for Sustainable and Responsible Investment published that more than $17 trillion of professionally managed assets were held in sustainable assets (about one-third of all assets under management).

Data providers have created various scoring criteria to rank and access potential ESG investments. Besides MSCI, other financial firms have curated their own proprietary ESG scoring models, including Standard & Poors (S&P), Blackrock, and Russell Investments. As a result, socially responsible investors can make more informed decisions when screening companies, ETFs, or mutual funds to include in their portfolios.

Division of ESG into pillars

MSCI’s ratings segregate ESG into its three pillars: environment, social, and governance. Figure 1 below shows the main components of each pillar and the key issues of each component.

MSCI evaluate thousands of data points across 35 ESG Key Issues that focus on the junction between a company’s core business and the industry-specific issues that may create significant risks and opportunities for the company. All companies are automatically evaluated for Corporate Governance and Corporate Behavior.

Figure 1. MSCI ESG classification.
MSCI ESG Classification
Source: MSCI.

For example, in Figure 1, we take the example of a soft drink sub-industry (say Coca-Cola). In this scenario, the key issues for the environment and social pillar are highlighted. All the key issues mentioned for the governance pillar will be automatically considered for this industry (or any other industry).

Calculation of MSCI scores

When calculating the ESG scores for a company, MSCI rates each key issue from zero to ten. Zero indicates virtually no exposure, and ten represents very exposure to a particular ESG risk or opportunity.

MSCI also evaluates a company for its possible exposure to dubious business activities (e.g., gambling, weapons, tobacco, etc.). The data informing these scores are received from corporate filings, financial reports, and press releases. In addition to this, almost half of all data comes from hundreds of third-party media, academic institutions, non-government organizations (NGO), regulatory, and government sources.

Scores based on a company’s individual metrics are aggregated, weighted, and scaled to the relevant industry sector. Finally, an intuitive letter-based grade gets assigned to the company.

Assessment of MSCI scores

MSCI distinguishes its grades into three categories, mentioned below in descending order:

  • 1. Leader (grade AAA & AA) – this grade indicates that a company is leading its relative industry. The company is managing the most significant ESG risks and opportunities.
  • 2. Average (grade A, BBB & BB) – this grade indicates a company has an unexceptional or mixed track record of alleviating ESG risks and opportunities.
  • 3. Laggard (grade B or CCC) – this grade indicates that a company is lagging in its industry because of the high exposure to ESG risks and failure to mitigate them.

Figure 2. MSCI ESG Score board.
MSCI ESG Score board
Source: MSCI.

Example of MSCI ESG rating

The following case below is a real-life example of the MSCI ESG rating of Tesla, an electric vehicle producer. The company attained an overall grade of “A”, achieving the higher end of the “average” category.

When we look at the breakdown of this rating:

  • Tesla exceeds corporate governance and environmental risks, maintains a comparatively small carbon footprint, and utilizes green technologies.
  • The company scores an average grade for product quality and safety due to its past experiences of exploding batteries, undesirable crash test ratings, and accidents involving the car’s “autopilot” feature.
  • Tesla’s score is below-average for labor management practices. Tesla has been found to violate labor laws by blocking unionization. It has also repeatedly violated the National Labor Relations Act.

It is fascinating to note that the French auto parts maker, Valeo SA is the only company in the auto industry that earns a “leader” category grade from the MSCI ESG Ratings.

Related posts on the SimTrade blog

▶ Anant JAIN Environmental, Social & Governance (ESG) Criteria

▶ Anant JAIN Dow Jones Sustainability Index

▶ Anant JAIN Socially Responsible Investing

Useful resources

MSCI

MSCI Ratings Methodology

Tesla’s MSCI Rating

US SIF

About the author

The article was written in July 2021 by Anant JAIN (ESSEC Business School, Grande Ecole Program – Master in Management, 2019-2022).

Environmental, Social & Governance (ESG) Criteria

Environmental, Social & Governance (ESG) Criteria

Anant Jain

In this article, Anant JAIN (ESSEC Business School, Grande Ecole Program – Master in Management, 2019-2022) talks about Environmental, Social & Governance (ESG) criteria and its individual components.

Introduction

Environmental, social, and governance (ESG) criteria constitute a framework that helps socially conscious investors to screen potential investments which incorporate their personal values/agendas. The ESG criteria screen companies based on sound environmental practices, healthy social responsibilities and moral governance initiatives into their corporate policies and daily operations.

Environmental criteria analyze how an organization performs as an agent of nature. Social criteria examine how it manages relations with employees, suppliers, customers, and the communities where it operates. Governance criteria deal with a companies’ audits, taxation, and firm management (composition of boards, shareholder rights, etc.).

There has been a rise in social investing, particularly by the younger section of the potential investors such as millennials and Gen-Z. As a result, financial products (exchange-traded funds for example) following the ESG criteria appeared. According to the report from US SIF Foundation, “there has been an increase in the assets chosen by ESG criteria from $8.1 trillion in 2016 to $11.6 trillion in 2018.”

Components of ESG

ESG criteria provide investors insight into a company’s adherence (or lack of adherence) to ethical practices. The three components of ESG criteria are defined as follows:

Environmental Criteria

These criteria measure a company’s impact on the environment and its ability to alleviate potential risks that could harm the environment in the future. It includes issues such as a company’s energy use, waste, pollution, natural resource conservation, and treatment of animals.

Social Criteria

These criteria assess a company’s relations with other businesses, its standing in the local community, its commitment to diversity and incorporation among its workforce and board of directors, its charitable contributions, and whether it practices employee policies that foster health and safety.

Governance Criteria

These criteria assess a company’s internal processes, such as transparent accounting systems, executive compensation and board composition, and its relations with employees and stakeholders.

Types of ESG Criteria

The table below provides the different types of issues mentioned by the CFA institute for each criterion of the ESG component. They are as follows:

Table 1. ESG components.
ESG components
Source: MSCI.

Why is ESG Growth Accelerating?

Global sustainability challenges such as natural disasters, privacy and data security, and changes in demographics are introducing new risk factors for investors that may not have been seen previously. As companies face rising complexity at a global level, investors may re-evaluate traditional investment approaches. The demand for ESG criteria is increasing for the following reasons:

1. The world is transforming

Global issues, such as climate risk, increased regulatory pressures, social and demographic changes, and privacy concerns, represent new or increasing risks for investors. Companies face increasing complexities and more significant analysis if they do not adequately manage their ESG aspects.

2. A new era of investors

Millennial investors actively want to contribute back to society leading to rapid growth in ESG investment. In a 2018 survey, Bank of America Merrill Lynch said that “they could conservatively estimate $20 trillion of assets growth in U.S. ESG funds alone in the next two decades.”

3. Advancing technology

Advanced technology, including artificial intelligence (AI) and alternative data extraction techniques, reduces the dependency on voluntary disclosure from organizations. Machine learning and natural language processing are helping increase the timeliness and precision of data collection, interpretation and validation to deliver dynamic content and financially relevant ESG insights.

Working of ESG Criteria

To evaluate a company based on ESG criteria, financial investors look at a broad range of factors. They mainly follow any or all of the three criteria: Environment, Social, and Governance.

It is unlikely for a company to pass all the tests in every category. Therefore, investors need to prioritize their personal agendas that align with the ESG criteria. At a pragmatic level, investment firms that follow ESG criteria must also set priorities. For example, as of March 2020, Trillium Asset Management, with $2.8 billion under management, uses various ESG factors to help identify companies positioned for strong long-term performance. Trillium’s ESG criteria include avoiding companies with known exhibition to coal mining, nuclear power or weapons. It also avoids investing in companies with disputes related to workplace discrimination, corporate governance, and animal welfare, among other issues.

Conclusion

Earlier, only rating agencies specializing in sustainability paid attention to ESG criteria and similar concepts, with some dependency on information from the sector of the analyzed company. These agencies would collect information from the sustainability or CSR teams and provide their customers with their assessments.

In recent years, a rise in the interest of climate and social issues has led some of the most significant asset management companies to create specialized teams, developing internal methodologies to assign sustainable ratings. It is especially true with passive management funds (like Vanguard, State Street, BlackRock) and some active management funds.

As a result, in the year 2020, there was a striking increment in analysis and demand for information on environmental and social issues from investors.

Related posts on the SimTrade blog

▶ Anant JAIN Impact Investing

▶ Anant JAIN Socially Responsible Investing

▶ Anant JAIN MSCI ESG Ratings

Useful resources

The US SIF Foundation

The Bank of America Merrill Lynch Global Research Issues

The Trillium Asset Management

About the author

The article was written in July 2021 by Anant JAIN (ESSEC Business School, Grande Ecole Program – Master in Management, 2019-2022).

Socially Responsible Investing

Socially Responsible Investing

Anant Jain

In this article, Anant JAIN (ESSEC Business School, Grande Ecole Program – Master in Management, 2019-2022) talks about Socially Responsible Investing.

Introduction

Socially responsible investing (SRI) is a type of investment that is categorized to be socially responsible due to the nature of the operation the company conducts. SRI is an investment that considers two aspects: 1) social/environmental changes; and 2) financial performance.

SRI refers both to the firms which invest by considering the environment and society (on the assets side of their balance sheet) and financial investors (banks, funds, etc.) who brings financial resources (debt or equity) to finance the physical investment (on the liabilities side of firms’ balance sheet).

In other words, socially responsible investors promote practices that they personally believe will lead to environmental benefits, consumer protection, racial/gender diversity, etc. Some socially responsible investors also do the opposite of investing by avoiding companies that have a negative impact in society such as alcohol, tobacco, deforestation, pollution, etc.

Understanding SRI

For socially responsible investing, financial investors do not use the typical metrics such as financial performance to select a company for investment. While investing in SRIs, investors ensure that the operation and business practices of a company aligns with his or her personal values. Since every investor has a different set of personal values, the definition of SRI varies from person to person.

For example, if you are concerned about the environment, your portfolio may have investments in green energy (such as wind, water or solar energy). If you are enthusiastic about racial equality, you might invest in companies employing or founded by people from different racial groups.

In recent years, “socially conscious” investing has been increasing into a mass followed practice as there are multiple funds and investment opportunities available to investors.
For example, mutual funds and exchange-traded funds (ETFs) provide investors with exposure to multiple companies spread across various sectors with a single investment vehicle.

As mentioned above, SRIs have two main aspects: environmental/social impact and financial performance. But it does not mean both these aspects have to go hand-in-hand. There is no surety that an investment resulting in positive environmental impact, will also result in financial gains for investors. Therefore, investors should still access the financial outlook of the investment while focusing on its environmental/social value.

Ways to Make Socially Responsible Investments

Investors looking to make investments in SRIs focus on the following criteria: Environmental, Social and Governance (ESG). They use these criteria to access the sustainability or social impact of an investment. Socially responsible investors use different approaches to ensure their ventures achieve social goals: negative screening, positive investing and community investing.

Negative Screening

This method involves screening a company’s operations and products/services before taking a decision to invest in it. It means that if investors discover that a particular company indulges in practices that is against their personal values, for example, say gender discrimination, then investors won’t invest in that company.

Positive Investing

Investors agree to invest in companies whose operations align with their personal values. For example, an investor who cares about environment would invest in green energy.

Community Investing

If an investor is keen to invest in SRIs, community investing is an excellent approach. The investor basically puts his or her money in projects that boosts local communities economically. For example, investing in projects that utilize resources that are readily available and create employment opportunities for the unemployed.

Types of Socially Responsible Investments

There are different types of SRIs available to investors. Three of the most common mediums are mentioned below:

Mutual funds and exchange-traded funds (ETFs)

Some mutual funds and ETFs follow the Environmental, Social and Governance (ESG) criteria. For example, investors looking to invest in either of the two funds can visit the SIF website, which displays over 100 socially responsible mutual funds and socially responsible ETFs.

Community Investments

Investors can socially invest by directly putting their money into projects that benefit communities. An easy way to make such investments is by contributing to Community Development Financial Institutions (CDFIs).

Microfinance

Investors can also make socially conscious investments by offering micro-loans or small loans to start-ups. They can search for businesses in developing countries that require financial assistance.

SRI financial performance

A socially responsible investment may result in financial gains. A 2020 research analysis from asset-management firm Arabesque Partners found that 80% of the reviewed studies demonstrated that sustainability practices have a positive influence on investment performance.

Several studies have indicated that SRI mutual funds are not only at par with traditional mutual funds in performance, but they can sometimes perform better. There is also evidence that SRI funds may be less volatile than traditional funds.

In the past, there have been controversies about SRI, with opponents arguing that restricting the field of investment options can also lead to a restriction of investment returns. Now, there is a growing pool of evidence that indicates the opposite: SRI is not only good for the society, but also for you!

Useful resources

The US SIF Foundation

Arabesque

Related posts on the SimTrade blog

▶ Anant JAIN Impact Investing

▶ Anant JAIN Environmental, Social & Governance (ESG) Criteria

About the author

The article was written in July 2021 by Anant JAIN (ESSEC Business School, Grande Ecole Program – Master in Management, 2019-2022).

Impact Investing

Impact Investing

Anant Jain

In this article, Anant JAIN (ESSEC Business School, Grande Ecole Program – Master in Management, 2019-2022) talks about Impact Investing.

Introduction

Impact investing is defined as the investment process made with the intention to generate positive social and environmental impact that can be measured, along with positive financial performance. The main point of impact investing is to utilize money and investment capital for positive social results.

Impact investing considers both the physical investments of firms (on the assets side of the balance sheet of firms) and their impact on the environment and society, and the financial investments of investors, debt or equity (on the liabilities/shareholders’ equity side of the balance sheet of firms) to finance the physical investments.

Impact investments can be made in both emerging and developed markets. Emerging markets are riskier compared to developed markets. An impact investor can target a desired market according to his or her strategic goals and desired returns from the investments.

Two key elements are present in impact investments:

  • Intentionality: an investor’s intention should include some element of both social impact and financial return.
  • Measurement: while there is more availability on metrics for financial performance, an impact investor should also aim to measure the social impacts of the investment.

All investments make an impact on society, either positive or negative. Impact investors intentionally make investments that lead to measurable positive social impacts.

Parts of Impact Investments

Impact investments come in different forms of project size and risk level. Just like any other type of investment, impact investments provide investors with a wide range of possibilities when it comes to investment expected returns. The only differentiating factor with impact investment is that it does not only provide investors with positive financial returns but also has a social or environmental impact via the physical investments of firms that it finances.

The market for impact investment may vary and investors may choose to invest their money into emerging or developed markets/economies. Impact investments cover a huge number of industries including healthcare, education, energy mainly renewable energy and agriculture.

There are mainly two parts of impact investment: the choice of criteria and the use of these criteria for investing (selection of firms in the portfolio of investors).

Environmental, Social, & Governance (ESG) Criteria

ESG criteria refers to healthy practices undertaken by an investment. It helps us to analyze potential investment that may have a prominent impact on the environment/society. ESG criteria are integrated to enhance the traditional financial analysis of an investment by identifying potential risks and opportunities beyond purely financial valuations. Even though there is a parallel social conscience, the main objective of ESG evaluation remains financial performance.

Socially Responsible Investing (SRI)

Socially responsible investing (SRI) is a step up to ESG since it actively eliminates or selects investments according to specific ethical agendas. SRI uses ESG criteria (which facilitate valuation) to apply negative or positive screens on the investments. SRI uses ESG criteria to select potential impact investments.

Benefits of Impact Investing

The following points mentioned below are some of the benefits of impact investing:

Return on investment (ROI)

An impact investor can invest a fixed amount of money in a series of socially beneficial projects or organization. The returns on the investment would vary from below-market to market rate. However, in impact investing, even a simple return of principal amount used for investing creates philanthropic leverage that is unattainable through tradition investing methods.

Alignment with goals of financial investors

Firms have traditionally been focused on achieving profit maximization. This is also known as shareholder theory where the main goal of the firm is to maximize the shareholders’ returns. With impact investing, firms can utilize more assets to be leveraged for social or environmental goals. This is also known as stakeholder theory where the goal of the firm is to maximize shareholders’ profit without harming the environment or society.

Negation of onvestor’s conflict

When investors utilize their money for impact investing, they are aware that the investments are in line with ethical values. As a result, investors do not find themselves in situations of conflict with the management regarding the utilization of money for social or environmental benefits.

Examples of impact investing

The Gates Foundation

One of the most commonly known impact investment funds is the Bill & Melinda Gates Foundation. It was launched with a total endowment of nearly $50 billion. The Foundation has a strategic investment fund with $2.5 billion under management, which is invested in ventures that align with the Foundation’s social goals.

Soros Economic Development Fund

Launched by billionaire philanthropist George Soros, the Soros Economic Development Fund is part of the Open Society Foundations. Out of the $18 billion contributed to the Open Society Foundations, the Soros Economic Development Fund uses $90 million to actively invest in impact ventures.

The Bottom Line

Socially and environmentally responsible practices tend to attract impact investors. It means that companies can gain financial benefits by committing to socially responsible practices. It is observed that impact investing is more attractive to younger generation, such as Millennials and Gen-Z, who want to give back to society.

Investors also tend to profit from impact investing. A 2020 survey by the Global Impact Investing Network (GIIN) found that more than 88% of impact investors reported that their investments were meeting or surpassing their financial expectations.

By engaging in impact investing, individuals or organizations essentially state their support to the vision and the mission of the company working towards a certain social or environmental change. As we see a shift in the investor’s perspective to be more socially conscience, and to engage in impact investing, it will most likely result in more companies to become socially conscious.

Useful resources

The Gates Foundation

The Open Society Foundation

The Global Impact Investing Network (GIIN)

Related posts on the SimTrade blog

▶ Akhsit GUPTA Portrait of George Soros: a famous investor

▶ Anant JAIN Environmental, Social & Governance (ESG) Criteria

▶ Anant JAIN Socially Responsible Investing

▶ Anant JAIN The Top 5 Impact Investing Financial Firms

About the author

The article was written in July 2021 by Anant JAIN (ESSEC Business School, Grande Ecole Program – Master in Management, 2019-2022).

Operating Profit

Operating Profit

Bijal GANDHI

In this article, Bijal GANDHI (ESSEC Business School, Grande Ecole Program – Master in Management, 2019-2022) explains the concept of Operating profit.

This read will help you understand in detail the meaning, components and formula for calculating operating profit along with relevant examples.

Operating Profit

Operating profit refers to the profit obtained from business operations before the deduction of interest and taxes. Operating profit is a good representation of the company’s profits as all the core expenses are taken into consideration except interest and tax. It is synonymously used with “EBIT” (Earnings before interest and taxes) and “operating income”. Although, EBIT may sometimes include non-operating revenue.

Components and Formula

Operating profit is equal to:

Operating revenue – COGS – Operating expenses – Depreciation –Amortization

  • Gross profit: We know from the blog on revenue, gross profit equals revenue less COGS (cost of goods sold). Therefore, operating profit is often simplified as, Gross Profit – Operating expenses – Depreciation – Amortization.
  • Operating expenses refers to the expenses that a business undertakes during its normal operations such as rent, electricity, salary, etc. These expenses are generally divided into broad categories in the income statement to make it concise. For example, in the LVMH example below, the operating expenses are divided into three broad categories like marketing and sales, general and administrative and other such costs.
  • Depreciation refers to the value of the assets that have been used up every year. It is a method to allocate the cost of a physical asset over its useful life.
  • Amortization refers to the accounting method of spreading the cost of an intangible asset over its useful life.

Example: LVMH

Let us once take the example of LVMH. The French multinational company LVMH Moët Hennessy Louis Vuitton was founded in 1987. The company headquartered in Paris specializes in luxury goods and stands at a valuation (market capitalization in June 2021) of $329 billion. It is a consortium of 75 brands controlled under around 60 subsidiaries. Here, you can find a snapshot of LVMH Income statement for three years: 2018, 2019 and 2020.

Bijal Gandhi

The operating profit for the year 2020 is 7,972 million euros. This means that from a revenue of 44,651 million euros in 2020, the company is now left with 7,972 million euros after deducting all expenses except interest and tax.

Operating profit vs Net profit

Net profit refers to the amount that a company is left with after deducting all expenses including interest and tax. For example, in the snapshot above, net profit is 4,702 million euros as compared to the operating profit of 7,972 million euros. This means that the total interest and tax expenses amounted to 7,972 less 4,702 million euros. Net profit which is also referred to as “bottom line” gives us a picture of the overall performance of the company and its management.

Exclusions from operating profit

There are several exclusions from operating profit because operating profit is calculated with the purpose of understanding the performance of a company’s core business only.

The revenue from the sale of an asset is not part of the operating profit. Similarly, investment income, interest income and debt interest expenses are not part of the company’s core business and therefore excluded from the calculation of operating profit.

Related posts on the SimTrade blog

   ▶ Bijal GANDHI Income statement

   ▶ Bijal GANDHI Revenue

   ▶ Bijal GANDHI Cost of goods sold

About the author

Article written in July 2021 by Bijal GANDHI (ESSEC Business School, Grande Ecole Program – Master in Management, 2019-2022).

Depreciation

Depreciation

Bijal GANDHI

In this article, Bijal GANDHI (ESSEC Business School, Master in Management, 2019-2022) explains briefly the meaning of Depreciation.

This reading will help you understand the concept of depreciation, its main components and types with examples.

What is depreciation?

Depreciation is the accounting technique of dividing the total cost of a physical asset over its useful life period. The amount allocated is the value of the asset used up in that particular financial year. Depreciation is used by companies to spread the cost of an asset over time. This method eliminates the cost burden in one particular year. If not for depreciation, the company’s profits would seriously be affected in the year of purchase.

Depreciation for long-term assets may also be practiced by companies for tax benefits in a particular year. The reduction in taxable income can be achieved through tax deduction for the cost of an asset. Note that there are standard rules regarding the accounting practices of depreciation and firms cannot do what they want.

Types of depreciable assets

The guidelines for the types of assets to be depreciated is set by Internal revenue service (IRS) in the U.S. The following criteria are to be met with,
• The asset should be owned by the company.
• The asset should be used in the business to generate income.
• The life of the asset is determinable and is more than a year.

The most common examples of depreciable assets include plant and machinery, equipment, furniture, computers, software, land and vehicles.

Components of a depreciation schedule

A depreciation schedule is a detailed document that comprises of the information pertaining to depreciation for each asset owned by the company. It generally includes the following,
• Description and purchase price of asset
• Date of purchase and expected useful life.
• Depreciation method and salvage value.

Depreciation types with examples

Depreciation can be carried in several ways. The company can use any one of the four depreciation methods highlighted by Generally accepted accounting principles (GAAP) guidelines. GAAP is the set of rules and guidelines that are to be adhered to by accountants. The four methods for depreciation include the following,

Straight-line depreciation

Straight-line is one of the simplest methods of depreciation. In this method, the value of the asset is split evenly over the useful life of the asset. The value of the asset is calculated by subtracting the salvage value (scrap value) from the original cost incurred to purchase the asset. For example, if an equipment is bought for 10,000 euros, with a useful life of 10 years and a salvage value of 1,000 euros, the depreciation is computed as follows:

Depreciation per year= (asset cost – salvage value) / useful life
= (10,000-1,000) / 10
= 900 euros per year.
Therefore, 900 euros will be written off each year for 10 years.

Declining balance depreciation

The declining balance method of depreciation is an accelerated version of the straight-line method. Instead of an equal amount of depreciation for each year of useful life, unequal amounts depending upon the use are written off. In this method, more of the assets value is depreciated in the initial years than afterwards. This method is practiced by businesses who wish to recover maximum value upfront. For example, the equipment bought for 10,000 euros with a useful life of 10 years and salvage value of 1,000 will be depreciated by 20% each year,

For first year, the depreciable amount will be (9,000*20%) = 1,800 euros
For second year, the depreciable amount will be ((9,000-1,800) *20%) = 1,440 euros and so on.

Sum-of-the-years’ digits depreciation

This method serves a similar purpose as the declining balance method. It allows to depreciate more in the initial years as compared to the later years. It is a bit more even in terms of distribution per year as compared to the declining balance method.

The formula is as follows,
 (Remaining life in years / SYD) x (asset cost – salvage value)
Where, SYD is the sum of the years of the asset’s useful life. SYD for an asset with a useful life of 4 years is equal to 11, which we get from (1 + 2 + 3 + 4).

Units of Production Depreciation

A simple way to depreciate would be to quantify an asset’s use every year. For example, an equipment can be depreciated in proportion to the units produced. This is exactly what the units of production method of depreciation works.

The formula is as follows,
Depreciation: (asset cost – salvage value) / units produced in useful life.
The number will vary each year, depending upon the use of the asset.

Related posts on the SimTrade blog

   ▶ Income statement

   ▶ Revenue

   ▶ Cost of goods sold

About the author

Article written in May 2021 by Bijal GANDHI (ESSEC Business School, Master in Management, 2019-2022).

Revenue

Revenue

Bijal Gandhi

In this article, Bijal GANDHI (ESSEC Business School, Grande Ecole Program – Master in Management, 2019-2022) delves deeper into the accounting concept of revenue.

This read will help you understand in detail the meaning, types and calculation of revenue  along with relevant examples.

What is revenue?

Revenue is referred to the money brought into a company from the sale of either goods, services, or both. Revenue is synonymous to sales and top line. This is because it first line on the income statement and it is a good indicator of a business’s performance. Revenue consists of two components, the price and the number of products/services sold. It is then calculated in the following manner:

Bijal Gandhi

Gross revenue vs net revenue

Gross revenue is simply the income generated from a sale without consideration for any expenses that might have occurred. Net revenue is the income after subtracting all the cost of goods sold and other expenses related to running the business.

For example, if Alpha sells 2,000 toy cars at $100 each, its gross revenue for the month would be $200,000. If the cost of producing each car was $25, their net revenue would be 2,000 x ($100 – $25) toy cars or $150,000.

Revenue example: LVMH

Let us once again take the example of LVMH. The French multinational company LVMH Moët Hennessy Louis Vuitton was founded in 1987. The company headquartered in Paris specializes in luxury goods and stands at a valuation of $329 billion. It is a consortium of 75 brands controlled under around 60 subsidiaries. Here, you can find a snapshot of LVMH Income statement for three years: 2018, 2019 and 2020.

Bijal Gandhi

Here, the revenue, also known as top line, is 44,651 million euros for the year 2020. The revenue is the sum of income generated from all divisions. In the snapshot below, the revenue is a consolidation of income generated by several brands that sell wines, spirits, fashion, leather goods, perfumes, etc.

Accrued vs deferred revenue

Accrued revenue refers to the revenue earned by a company for which the goods are delivered but the payment is yet to be received. In this type of accounting, the revenue is recorded irrespective of whether the cash is received or not.

Deferred revenue refers to the revenue for which the customer has already made the payment, but the company is yet to deliver the goods. Here, in accounting the company will record the cash payment but that the revenue is unearned, but it will not recognize the revenue on the income statement.

How do revenue & earnings differ?

Revenue refers to the income generated by a company before deducting expenses, while earnings refer to the profit earned by the company after deducting the expenses, interest, and taxes from revenue.

Earnings is synonymous to net income or the bottom line. Along with revenue, it is also a very important indicator of a company’s performance.

How do revenue & cash flows differ?

Cash flow refers to the total amount of cash that moves into or out of the company. While revenue is the indicator of a company’s overall effectiveness, the cash flow is an indicator of liquidity.

Related posts on the SimTrade blog

   ▶ Bijal GANDHI Income statement

   ▶ Bijal GANDHI Cost of goods sold

About the author

Article written in May 2021 by Bijal GANDHI (ESSEC Business School, Grande Ecole Program – Master in Management, 2019-2022).

Cost of goods sold

Cost of goods sold

Bijal GANDHI

In this article, Bijal GANDHI (ESSEC Business School, Grande Ecole Program – Master in Management, 2019-2022) explains Cost of goods sold.

This read will help you understand in detail the meaning and components of cost of goods sold along with relevant examples.

Introduction

Cost of goods sold (COGS) refers the sum of all costs directly related to the production of the goods. It is fundamentally very similar to cost of sales and hence synonymously used. Some examples of items that make up COGS include,

  • Cost of raw materials
  • Direct labor costs
  • Heat and electricity charges
  • Overheads

Components and Formula

The COGS is calculated using the following formula,

COGS = (Beginning Inventory + Purchases) – Ending Inventory

• Beginning Inventory is the total value of the inventory left over or not sold from the previous year.

• Cost of goods is the sum of all costs directly related to the production of the goods or the purchase value of the same (in case of retailer or distributor)

• Ending inventory is the total value of the remaining inventory that was not sold till the end of the financial year. This number is carried forward to next year.

Example: LVMH

Let us once again take the example of LVMH. The French multinational company LVMH Moët Hennessy Louis Vuitton was founded in 1987. The company headquartered in Paris specializes in luxury goods and stands at a valuation of $329 billion. It is a consortium of 75 brands controlled under around 60 subsidiaries. Here, you can find a snapshot: 2018, 2019 and 2020.

Bijal Gandhi

In the income statement, COGS is placed just below revenue (Link to the blog) to easily compare the numbers and derive the gross margin. For example, in the snapshot of LVMH income statement below, the cost of sales for the year 2020 is 15,871 million euros for the revenue of 44,651 million euros resulting in a gross margin of 28,780 million euros.

Direct costs vs indirect costs

Direct cost refers to the costs that are directly associated with the production of goods and services. They are generally variable in nature as they fluctuate depending upon the production. Some examples of direct costs include, raw materials, direct labour, manufacturing supplies, fuel, power, wages, etc. Most importantly, direct costs are the ones that can be directly assigned to the product or service.

Indirect costs are those which cannot be assigned to one specific product or service. These costs are those that apply to more than one business activity. For example, rent, employee salary, utility and administrative expenses, overheads, etc. These costs may be fixed or variable in nature.

COGS vs operating costs

Operating costs are expenses that are not directly related to the production of goods or services. The operating expenses are a separate line item in the income statement, and they include indirect costs like salaries, marketing, rent, utilities, legal and admin costs, etc.

It is important to classify the costs correctly as either COGS or operating. This will help managers differentiate well between the two and effectively build a budget for the same.

Related posts on the SimTrade blog

   ▶ Bijal GANDHI Income statement

   ▶ Bijal GANDHI Revenue

About the author

Article written in May 2021 by Bijal GANDHI (ESSEC Business School, Grande Ecole Program – Master in Management, 2019-2022).

Why do governments issue debt?

Why do governments issue debt?

Rodolphe Chollat-Namy

In this article, Rodolphe CHOLLAT-NAMY (ESSEC Business School, Grande Ecole Program – Master in Management, 2019-2023) gives the reasons why governments issue debt.

In normal times, governments use debt (bills, notes and bonds) to cover expenses and finance investments that will create new wealth, which will make it possible to repay the debt. This is what companies do when they use credit to buy new machinery for example. It is also what public authorities do when they build schools, hospitals or roads that will increase the productive capacity of the country and improve the living conditions of its inhabitants. However, the interest for a state to go into debt could not be limited to this. What are the other reasons to go into debt?

Public debt allows the mobilization of private savings

The level of savings directly influences investment in the economy and, therefore, the level of consumption. However, there are many factors that can push savings away from their optimal level, i.e. the level that maximizes consumption. It is therefore necessary for a government to find solutions to adjust this level of savings. Recourse to debt is one of the solutions.

Indeed, recourse to debt is a means of mobilizing, in return for remuneration, the savings of individuals, and in particular those of households with sufficiently high incomes to save. Today, there are not enough borrowers who issue good quality assets. The proof is that interest rates are very low on public debt. Savers are competing with each other and accepting lower and lower yields for this type of savings medium. Thus, in a world of asset shortages, it is the state that will provide sufficient savings vehicles. The state is then faced with a dilemma: to provide adequate and safe savings vehicles and to increase taxes in order to pay the interest on new public debt.

Public debt helps limit fluctuations in production levels

As we have seen with the Covid-19 crisis, an economy can be confronted with one or more shocks that temporarily push the level of production away from its potential level. Such fluctuations represent a cost. Indeed, a higher volatility in the level of output translates into a lower growth rate. In addition, a temporary fall in output from its potential level can lead to the failure of long-term viable businesses.

Investments financed by debt can be used to limit the magnitude of changes in the level of output. Changes in government spending or tax obligations significantly affect the level of output. An increase in expenditure usually results in an increase in output. Thus, public debt is an effective way of stabilizing output. This is what happened during the 1980s and 1990s. Governments around the world used massive debt to support their economic activity. During the Covid-19 crisis, the “whatever it takes” approach saved many companies. However, it has also kept unprofitable companies on life support, which should have disappeared, due to a lack of hindsight.

Public debt is a redistribution within the present generations

Public debt is often presented as a burden to be borne by future generations. However, this statement is far from obvious. Indeed, it is very difficult to measure the extent of transfers between generations. Future generations will also benefit from part of the money borrowed today that will have been invested and distributed to households that will be able to save it and then pass it on to their children. Thus, it is difficult to assess the real burden of the debt for future generations.

What is more certain, however, is that the public debt is primarily a transfer within the households at the present time. The State borrows from an agent X to redistribute to an agent Y or to make an investment that will benefit an agent Z. Thus, from this point of view, the use of debt is a good tool for redistribution among households.

Related posts on the SimTrade blog

   ▶ Rodolphe CHOLLAT-NAMY Government debt

   ▶ Rodolphe CHOLLAT-NAMY Bond valuation

   ▶ Rodolphe CHOLLAT-NAMY Bond markets

   ▶ Bijal GANDHI Credit Rating

   ▶ Jayati WALIA Credit risk

Useful resources

Rating agencies

S&P

Moody’s

Fitch Rating

About the author

Article written in July 2021 by Rodolphe CHOLLAT-NAMY (ESSEC Business School, Grande Ecole Program – Master in Management, 2019-2023).

Earnings per share

Earnings per share

Bijal GANDHI

In this article, Bijal GANDHI (ESSEC Business School, Grande Ecole Program – Master in Management, 2019-2022) explains the meaning and calculation of Earnings per Share.

This reading will help you understand the earnings per share in detail with relevant examples.

Introduction

The earnings per share (EPS) indicates the total amount of money that the company earns for each share of its total stock. A high EPS is a good indication as investors will be willing to pay more for each share owing to higher profits and vice versa. There are several methods to derive EPS.

Calculation of EPS

One direct way to calculate EPS is by simply dividing the net income by the number of common stocks that are outstanding for that period of the earnings. To understand the calculation for net income, refer to our blog on Income statement.

A refined way to calculate the EPS would be to adjust both the numerator and denominator. For the numerator, the net income should be adjusted for any dividends paid for preferred shares. For the denominator, a weighted average number of common shares should be taken since the number of outstanding shares tend to vary over time.

Bijal Gandhi

EPS example

Here, we again take the example of LVMH. The French multinational company LVMH Moët Hennessy Louis Vuitton was founded in 1987. The company headquartered in Paris specializes in luxury goods and stands at a valuation of $329 billion (market capitalization in June 2021). It is a consortium of 75 brands controlled under around 60 subsidies. Here, you can find a snapshot of LVMH Income statement for three years: 2018, 2019 and 2020. The last line highlights the basic and diluted EPS of the group for each of the three years.

Bijal Gandhi

Net income for the group= 4702 millions
Average number of shares= 503,679,272
Basic EPS= 9.33 euros per year.

Basic EPS vs. Diluted EPS

Basic EPS eliminates the dilutive effect of warrants, stock options, convertible debentures, etc. These instruments will increase the total number of outstanding shares if exercised by the holders. For example, warrants when exercised will result in dilution of equity.

Diluted EPS considers all the potential sources of equity dilution and therefore it gives a clear picture of the actual earnings per share. In the above LVMH example, the diluted earnings are derived after adding the dilutive effect of stock option like described below,

Net income for the group= 4,702 millions
Average number of shares outstanding: 503,679,272
Dilutive effect of stock option and bonus share plans: 530,861
Average number of shares after dilution: 504,210,133
Diluted earnings per share: 9.32

How is EPS used?

EPS is one of the best indicators of a company’s profitability and performance. It is a helpful indicator to choose stocks as it is one of the sole metrics that isolates net income to find the earnings for shareholders. A growing or a consistent EPS means that the company creates value for the shareholders while a negative EPS might indicate losses, financial trouble or eroding investor value.

It also helps calculate the price to earnings (PE) ratio where the market price per share is divided by the EPS. This ratio helps understand how much the market is willing to pay for each euro of earnings.

Related posts on the SimTrade blog

   ▶ Bijal GANDHI Income statement

   ▶ Bijal GANDHI Revenue

   ▶ Bijal GANDHI Cost of goods sold

About the author

Article written in May 2021 by Bijal GANDHI (ESSEC Business School, Grande Ecole Program – Master in Management, 2019-2022).

Income Statement

Income Statement

Bijal GANDHI

In this article, Bijal GANDHI (ESSEC Business School, Grande Ecole Program – Master in Management, 2019-2022) explains briefly the structure of an Income Statement.

This reading will help you understand the structure and the main components of the income statement.

Introduction

Income statement is a financial statement that reports the financial performance of an entity over a specified accounting period. The financial performance is measured by summarizing all income and expenses over a given period. Also known as ‘Profit and Loss’ Statement, the Income statement helps the company have a look at the profits for the year and helps it take financial decisions about costs and revenues. The Income statement is also the basis for the tax institution to compute the income tax that the company has to pay every year. The Income statement also allows shareholders to know the dividends that they can receive from the earnings.

Structure of an income statement

Bijal Gandhi

Main components of an income statement

The income statement may slightly vary sometimes depending upon the type of company and its expenses and income, but the general structure and lines may remain the same.

  • Revenue: Also known as top line, revenue or sales revenue refers to the value of the total quantity sold multiplied by the average price of goods or services sold.
  • Cost of goods sold: The cost of goods sold is the sum of all the direct costs associated with a product or service. For example, labor, materials, equipment, machinery, etc.
  • Gross Profit: Gross profit is derived after subtracting the cost of goods from sales/revenue.
  • Indirect Expenses: Indirect expenses include general, selling, and administrative expenses like marketing, advertisement, salary of employees, office, and stationery, rent, etc.
  • Operating Income: Gross profit less indirect expenses are equal to operating income. It is the firm’s profit before non-operating expenses and income, taxes and interest expenses are subtracted from revenues.
  •  Interest Expenses/Income: Interest expense/income is deducted/added from operating income to derive earnings before tax.
  • Tax: The taxes are deducted from pre-tax income to derive the net income. The taxes can be both current and future. The net income then flows to retained earnings on the balance sheet after deducting dividends.

Example: LVMH

The French multinational company LVMH Moët Hennessy Louis Vuitton was founded in 1987. The company headquartered in Paris specializes in luxury goods and stands at a valuation of $329 billion (market capitalization in June 2021). It is a consortium of 75 brands controlled under around 60. Here, you can find a snapshot of LVMH Income statement for three years: 2018, 2019 and 2020.
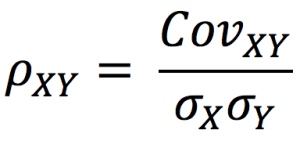
Bijal Gandhi

Most important components of an income statement include:

  • Total Revenue= Sum of Operating and Non-Operating Revenues for the accounting period. ($ 44,651)
  • COGS: Cost of goods Sold is the total cost of sales of the products actually sold. ($15,871)
  • Gross Margin = Net Sales – Total COGS ($28780)
  • Total Expenses = Sum of Operating and Non-Operating Expenses (Marketing and Selling Expenses + General and administrative expenses + Loss from joint Venture = ($ 16,792 + $ 3641 + $ 42= $ 20475)
  • EBT: Earning before taxes = Net Financial Income (Income – Expenses before Taxes). ( – $ 608)
  • Net Income = (Total Revenues and Gains) – (Total Expenses and Loses) = $ 4702

Income statement and Statement of cash flow

It is important to know that Income Statement does not convey the cash inflow and outflow for the year; The Cash Flow Statement is used for this. For example, credit sale is not recorded in the cash flow statement while cash sale is. Credit sale refers to sale for which the customer will make payment in the future while for cash sales the customer makes the payment at the time of purchase.

Conclusion

Income statement is the source to obtain valuable insights about factors responsible for company’s profitability.

Related posts on the SimTrade blog

   ▶ Bijal GANDHI Earnings per share

   ▶ Bijal GANDHI Revenue

   ▶ Bijal GANDHI Cost of goods sold

About the author

Article written in May 2021 by Bijal GANDHI (ESSEC Business School, Grande Ecole Program – Master in Management, 2019-2022).

Could the 2008 financial crisis been foreseen?

Could the 2008 financial crisis been foreseen?

img_SimTrade_Photo1_Raphael_Roero_de_Cortanze

In September 2008, the bankruptcy of Lehman Brothers broke the news and disclosed to the public what would become the biggest financial crisis since 1929. This crisis, fuelled by the speculation around ill-rated and poorly packaged mortgage securities, has been explained by some by the “black swan” theory.

Developed by Nassim Nicholas Taleb (2007), the black swan theory states that, similarly to black swans which were unthinkable for Europeans before they conquered Australia, exceptional financial events have a very low probability of occurring and are unpredictable from a statistics point of view. Nonetheless, is it fair to consider the 2008 as an unpredictable “black swan”?

According to the dominant economic theory, 2008 was a surprise

From the 1980’ to 2007, the “great moderation” period has reinforced in the dominant economic school of thought (the new classical economy) the idea of a stable long-term growth, uninterrupted by economics shocks and crisis. Indeed, from the 1980’, especially in the United States, all the indicators are green. The GDP is growing steadily, unemployment is low (under 4% for three years in a row under the Clinton presidency) and credit is accessible.

The “great moderation” is characterized by the reduction in the volatility of business cycle fluctuations in developed nations compared with the decades before. The flattening of business cycle fluctuations had been on the public debate since the 1967 and the famous conference led by Social Science Research Council Committee On Economic Stability called “Is the business cycle obsolete”.
During this period, Central banks became more independent, and governments began to widely use counter-cyclical policies in order to maintain growth in the long term with a balanced budget.

In “La Grande Crise: comment en sortir autrement”, James K. Galbraith describes this thirty-year period as a “great mirage”: everything was going well, so economists believed that everything was going well in the economy, and that everything would go well in the economy. Ben Bernanke, Governor of the Federal Reserve between 2005 and 2014, explained in 2015 that between the 1980’ and 2007, developed economics had returned to a stable economic pattern, thus that a shock could inevitably come from outside the economy. This framework of thought shared by most economists, politicians and central bankers at that time can explain why the 2008 crisis was not even foreseeable, as it is impossible to foresee an external shock.

Nonetheless, the analysis of certain parameters foreshadowed an upcoming financial crisis

During the early 2000s, Dean Baker studied the evolution of bubbles across history in order to understand when the future crisis would occur. He specifically studied the price-to-earnings ratio (stock price / net income) of stocks on the stock market. He explained that a bubble appears when the gap between price and earnings widens in a non-proportional way (i.e., the stock prices increase more quickly than the net income or earnings does). During the course of his analysis, Dean Baker has even estimated the size of the mortgage bubble. He valued the bubble at $8,000 billion, which is strangely equivalent to the total amount of wealth destroyed during the 2008 financial crisis…

Minsky in 1986 stated that financial crises are a moment of the financial cycle. He explained that during a period of stability (here the “great moderation”), speculators get bored and begin to take more and more risks, until they reach a Ponzi phase, and the economy collapses. According to Minsky, the international wave of financial deregulation and the recombination of investment and commercial banks during the 1980s have allowed the speculative game to become even more dangerous. According to this theory, the 2008 crisis was thus bound to happen, the only uncertainty has been the exact date of the collapse of the economy.

Financial crisis are not black swans: they are rather common

Modern history is paved with financial crises. In 1637 the “tulip mania” in Holland led to a dramatic increase and then collapse in the price of the tulip bulb. At the height of the tulip craze, in February 1637, promises to sell a bulb were negotiated for ten times the annual salary of a skilled craftsman. Some historians have called this crisis the “first speculative bubble” in history, as the sudden drop in prices is similar to a crash and the financial instruments used (futures sales, “options” contracts – purchase/sale at a fixed price in advance) make it a real financial crisis.

Picture7
Anonymous, The Sale of Tulip Onions, 17th century. Oil on wood

During the XIXth century, the crises of the modern era appear. They are usually overproduction industrial crises which spread internationally. In 1857 occurred the “1st international crisis of the industrial era”. A series of bank failures in the US spread to the financial spheres in Europe, and then to the real economy, impacting industrial production and generating wage decreases. In May 1873, an intense speculation around real-estate led to a financial crash which spread to the rest of developed world. It was followed by a depression, a thirty-year period of depression and growth deceleration, characterized by persistent underemployment.

The 20th century also had its share of financial crises: 1929, the 1970s, etc.

Furthermore, economic research on financial crisis mainly focuses a western-centric event. If developed countries have enjoyed a high degree of stability, despite regular financial crises, it is not the case for economies of less-developed countries, which experience numerous repeated financial crises.

Useful resources

Baker D. (2008), The housing bubble and the financial crisis, Center for Economic and Policy Research (issue #46)

Bernanke B. (2015) The Federal Reserve and the Financial Crisis.

Galbraith J. (2015) La Grande Crise : Comment en Sortir Autrement.

Taleb N. (2007) The Black Swan: The Power of the Unpredictable.

About the author

Article written in June 2021 by Raphaël ROERO DE CORTANZE (ESSEC Business School, Master in Management, 2019-2022).

Stock split

Stock split

img_SimTrade_Photo1_Raphael_Roero_de_Cortanze

In this article, Raphaël ROERO DE CORTANZE (ESSEC Business School, Grande Ecole Program – Master in Management, 2018-2022) introduces the specificities of stock splits.

Stock split

What a stock split?

A stock split is a decision by a company’s board of directors to increase the total number of shares by issuing more shares to current shareholders. The effect is to divide the existing shares into multiple new shares.
Picture5

For instance, a company with 1 million shares launches a 2-for-1 stock split. Post-stock split, the Number of Outstanding Shares (NOSH) will be 2 million, thus, the company has to issue 1 million new shares. Each existing shareholder will receive an additional issued share for each share he/she already has.

During a stock split, the market capitalization of the company remains the same. In effect, the company has simply issued new shares to existing shareholders, it has not sold those shares (it would have been the case during a capital increase for instance). As the market cap remained the same and the Number of Outstanding Shares doubled during this stock split, the adjusting variable is the stock price. In this case it is divided by 2.

Before the operation, the per share price amounted to:

Screenshot 2021-06-21 at 19.32.33

After the stock split, the per share price amounts to:

Screenshot 2021-06-21 at 19.32.45

In other words, a stock split does not add any real value, because the issued shares are not bought.

Why do companies split their stock?

Stock splits are far from being uncommon. Apple has undergone two stock splits in the last 10 years: the first in 2014 (7-for-1 stock split) and the second in 2020 (4-for-1 stock split, where the share price decreases from $460 to $115). In 2020, Tesla has also decided to go with a 5-for-1 stock split, which reduced the share price from $1,875 to $375. But why do companies resort to stock-splits?

Two main reasons can explain why companies go through splitting their stock:

  • Decrease the stock price: when to stock price is too high, it can be quite expensive to acquire “lots” of shares (lot in the sense of bundle). Splitting the stock reduces the prices, thus allowing more investors to buy the company’s stock.
  • Increase the stock liquidity on the market: a higher number of shares outstanding can result into a higher liquidity for the stock, which makes the stock more attractive for buyers and sellers. Indeed, it allows more flexibility, and provide buying and selling movements from having too much of an impact on the company’s stock price.

Many companies exceed later the price level at which they had previously split their stock, causing them to go through another stock split. For instance, Walmart has split its stock 9 times between 1975 and 1999.

Stock exchanges publish regularly a Stock Splits Calendar, which notifies the market when to expect a split and at what ratio.

Stock split signaling

As we have seen in our example above, a stock-split is supposed to not influence the stock price (besides dividing its price by the stock-split ratio). In reality, a stock-split usually sends a positive signal to the market, as stock-splitting announces higher liquidity and decreased prices. Stock splits also allow companies such as Apple or Tesla to prevent their stock from breaking through the ceiling and make the stock unaffordable.

Reverse stock-split

What is a reverse stock-split

As for a traditional stock split, a reverse stock split is a decision made by a company’s board of directors. Nonetheless, like its name indicates, a reverse stock-split is the opposite of a traditional stock split. The goal is to decrease the total number of shares.

Before the reverse stock split After the reverse stock split

Picture6

In this example, the reverse stock split ratio is 1-for-2 (i.e., 1 new share for 2 existing shares). From the 1 million shares of the company, 0.5 million are destroyed. The Number of Outstanding Shares post-reverse stock-split is thus 0.5 million. As for a traditional stock split, no real value is created or destroyed, the market capitalization remains the same. The adjusting variable is the stock price. In this case, the stock price is multiplied by 2.

Why do companies go through reverse stock-split?

The reverse stock-split procedure is usually used by companies which have a low share price and would like to increase it. Indeed, companies can be delisted from stock exchanges if their stock falls below a certain price per share.

In addition, a reverse stock split can be used to eliminate shareholders that hold fewer than a certain number of shares. For instance, in 2011, Citigroup launched a reverse 1-for-10 split in order to reduce its share volatility and discourage speculator trading.

Useful resources

CNN Why it’s time for Amazon and other quadruple-digit stocks to split

Nasdaq Stock Splits Calendar

The Economic Times What is ‘Stock Split’

About the author

Article written in June 2021 by Raphaël ROERO DE CORTANZE (ESSEC Business School, Grande Ecole Program – Master in Management, 2019-2022).

How does the stock price of a firm change according to the shift of its capital structure?

How does the stock price of a firm change according to the shift of its capital structure?

img_SimTrade_Photo1_Raphael_Roero_de_Cortanze

In this article, Raphaël ROERO DE CORTANZE (ESSEC Business School, Master in Management, 2018-2022) analyses the effects of the shifts of capital structure on the stock price.

Capital structure and asymmetric information

The capital structure of a firm can be defined as the mix of the company’s debt and equity. Debt can be long-term or short-term. Equity can be common or preferred equity. The capital structure discloses the different sources of funding a firm uses in order to finance its operations and growth. It is usually measured through the gearing ratio: Debt / (Debt + Equity).

Picture2

The overall capital structure of a firm varies across the firm’s life and development through equity or debt issuances. Equity and debt issuance are seen on the balance sheet as an increase on the liabilities side.

Nonetheless, the balance sheet does not reveal the future decisions regarding the capital structure of the firm. Indeed, firms’ managers are suspected to hold information that outside investors and/or the market lack. These information discrepancies between the firm (managers) and the market (investors) are known as “asymmetric information”. Almost all economic transactions involve information asymmetries. These information failures influence the managers’ financial decision, and influence the market perception of the firm, through changes in stock price.

Announcement effects

The debt-equity choice conveys information for two reasons:

  • Managers will avoid increasing the firm’s leverage if the firm could have financial difficulties in the future.
  • Managers are reluctant to issue equity when the stock is thought to be undervalued.

Stock price reactions to capital structure changes are usually the following:

  • Common stock issuance: negative
  • Convertible debt issuance: negative
  • Straight debt: negative but insignificant
  • Bank debt (renewal): positive

Debt issuance

In 1958, Modigliani and Miller stated that in a world without taxes, bankruptcy costs, agency costs and asymmetric information, and in an efficient market, the value of a firm is unaffected by how it is financed. In other word, the choice of capital structure is irrelevant as it does not impact the value of the firm. As a result, debt issuance does not have any impact on the value of the firm according to their theory.

In 1963, Modigliani and Miller adapted their theory by integrating the notion of corporate taxation. In this framework, they show that the value of the levered firm is equal to the value of the unlevered firm plus the present value of the tax savings associated with the tax deductibility of the interests on the debt. In effect, debt conveys a taxable benefit called the “tax shield”.

In our non-Modigliani Miller perfect world, an increase in a firm’s debt ratio is often seen as a positive signal by the market as it shows that the firm managers believe in the firm capacity to generate taxable earnings in the future.

In order to come to this conclusion, Grinblatt and Titman (2002) have explained that firms choose their capital structure by comparing the tax benefit of debt financing and the cost of financial distress.
Picture3
Let us consider two firms, A (unlevered) and B (levered). Firm A has no debt, thus no interest expense, and Firm B has a debt of 100 with a 10% interest rate. A and B have the same EBIT. Through its debt, B has a yearly tax shield of 3 (the tax rate is 30%), meaning that B pays less tax than A which has no debt and then no tax shield.

Nonetheless, the effects of issuing straight debt (a debt which cannot be converted into something else) is negative but insignificant. But renewing bank debt translates into an increase in stock prices. Overall, the announcement of a debt issuance has on average little impact on the stock price, as it shows to the market that the firms:

  • Needs funding
  • Expects taxable income in the future
  • Will pay less tax as it will benefit from a higher tax shield
  • Is financially stable enough to convince banks or investors to lend it money.

Security sales

The table below (from Grinblatt and Titman (2002) summarizes a number of event studies that examine stock price reaction to the announcements of new security issues. It shows that raising capital is considered as a negative signal. For instance, when industrial firms issue common stock, their stock prices decline, on average about 13.1%.

Picture4
This is explained by the “adverse selection theory”, which states that firms are reluctant to issue common equity when the stock is undervalued. Thus, the market often assumes than common equity issuance and overvaluation go hand in hand. The issuing of common equity will thus have a negative effect on stock prices, as the market will think the stock is overvalued. As convertible bonds have a strong equity-like component, Grinblatt and Titman (2002) argue that the “adverse selection theory” can also explain why the market usually reacts negatively to the issuance of convertible bonds.

Pecking order theory

The market reacts favorably to leverage increase and unfavorably to leverage decrease. As a result, firms will use either internal financing (inside equity) or debt to finance their project over outside equity (equity issuance). This is called the “pecking order theory” of capital structure.

The theory of the financial pecking order states that, of the three possible forms of financing for a firm (internal cash flow, debt, equity), a firm will prefer to finance itself from internal cash flow, then debt, and finally, in the last case, by selling equity. This has a practical consequence on the way the company operates: once it has emptied its internal cash flow, it will issue debt. If it can no longer generate debt, it will issue equity.

Myers and Majluf (1984) highlight the consequences of information asymmetry between managers and investors. If the company finances itself with shares, it is because it believes that shares are overvalued and can therefore provide easy and abundant financing. If the company finances itself with debt, it is because it believes that shares are undervalued.

Nonetheless, firms can prefer to resort to equity rather than debt when they are experiencing financial difficulties. Indeed, in case of financial distress, the risk of having to suffer financial distress costs can be greater than the cost of issuing equity. Furthermore, firms can also decide to issue preferred equity in difficult times rather than common equity. In effect, preferred shareholders cannot force a firm into bankruptcy when it fails to meet its dividend obligations (while common shareholders can).

Useful resources

Grinblatt M. and S. Titman (2002) Financial Markets & Corporate Strategy, Second Edition – Chapter 19: The information conveyed by financial decisions.

Myers S.C. and N.S. Majluf (1984) Corporate financing and investment decisions when firms have information that investors do not have, Journal of Financial Economics, 13(2) 187-221.

Related posts on the SimTrade blog

   ▶ Shruti CHAND Balance sheet

   ▶ Louis DETALLE A quick review of the DCM (Debt Capital Market) analyst’s job…

   ▶ Louis DETALLE A quick review of the ECM (Equity Capital Market) analyst’s job…

About the author

Article written in June 2021 by Raphaël ROERO DE CORTANZE (ESSEC Business School, Master in Management, 2019-2022).

Dividend policy

Dividend policy

Raphael Roero de Cortanze

In this article, Raphaël ROERO DE CORTANZE (ESSEC Business School, Master in Management, 2018-2022) analyses the effects of dividend policy on the stock price.

What is a dividend?

Firms that generate earnings through their activities must choose between retaining these earnings (increase in reserves on the liabilities side of the balance sheet) or distributing these earnings to shareholders through paid dividends.

A dividend is a payment from a company to its shareholders. Dividends can take several forms:

Cash: the shareholders receive cash

  • Regular: the most common form of dividend, usually a quarterly cash distribution charged against retained earnings. These regular dividends are an engagement: the board of directors declares a dividend, of a certain amount and for a certain duration. Regular dividends are thus not very flexible: regular dividends are “sticky” as they represent a higher commitment (compared to special dividends or buybacks for instance).
  • Special: a special dividend is a payment made by a company to its shareholders, which the company declares to be separate from the typical recurring dividend cycle
  • Liquidating: a liquidating dividend is a distribution of cash or other assets to shareholders, with a view to shutting down the business. It is paid out after all creditor obligations have been settled

Stock dividend: the shareholders receive stock

A stock dividend is a dividend payment with shares rather than cash. It has the advantage to distribute to shareholders without decreasing the company’s cash balance. Nonetheless, it can dilute earnings per share

Dividend policy

Modigliani Miller: irrelevance of the dividend policy

The first theorem formulated by Modigliani and Miller in 1958 states that in a world without taxes, bankruptcy costs, agency costs and asymmetric information, and in an efficient market, the value of a firm is unaffected by how it is financed. In other word, the choice of capital structure is irrelevant as it does not impact the value of the firm. In the same way, the dividend policy (to pay or not to pay dividends to shareholders) does not affect the value of the firm. Dividend policy is thus irrelevant.

In 1963, Modigliani and Miller adapted this theorem by integrating corporate taxation. In this framework, they show that the value of the levered firm is equal to the value the unlevered firm plus the present value of the tax savings associated with the tax deductibility of the interests on the debt in the income statement (tax shield). With corporate taxation, the capital structure matters as debt is more interesting than equity. But they show that the dividend policy still does not affect the value of the firm. Dividend policy is thus irrelevant.

Signaling

First of all, the stock price is expected to fall after the issuance of a dividend by the amount of the dividend itself. Dividend policy conveys information. Michaely, Thaler and Womack (1995) have demonstrated that the market reacts positively to dividend initiations (when the board of directors declares a dividend) and negatively to omissions (when the board of directors announces it won’t distribute a dividend).

As dividend policy conveys information, managers try to smooth out dividends. Dividends are thus less volatile than earnings: payout ratios (Dividend / Earnings per Share) increase in bad times and decrease in good times.

Example

As an example, General Motor’s dividend per share remained fairly stable between 1985 and 2008, even though its earnings were very volatile.

Picture1
Not all firms pay dividend. Dividend-paying firms are bigger and more profitable. DeAngelo, DeAngelo and Skinner (2004) have shown that dividends have become more concentrated. Indeed, in 1978 in the US, 67% of the total dividends were distributed by the Top 100 dividend-paying firms. In 2000, this proportion increased to 81% (of which 46% in the top 25 players).

Dividends during the COVID-19 crisis

During a financial crisis, it is logical to observe dividend cuts and omissions. Nonetheless, the crisis entailed by the COVID-19 pandemic is notable for the fact these dividend cuts and omissions were found among all firms from all sectors, whereas for instance the financial crisis of 2008 was primarily associated with a sharp drop of dividends across the financial sector (banks, insurance companies, brokers, market infrastructure firms such as stock exchanges, etc.).

In 2020, the pandemic caused a 12% global decline in dividends distribution compared to 2019. Between the second and fourth quarters of 2020, the dividend cuts reached 220 billion US dollars globally. Indeed, firm profitability and debt are determinants of dividend cuts and omissions, especially during crisis.

Nonetheless, part of the global decrease in dividends can be explained by the extraordinary measures taken by governments. In France, the government announced in April 2020 that large companies would be able to benefit from support measures if and only if they undertook not to pay dividends or buy back their shares. Similarly, the Federal Reserve in the US has imposed limits on dividend distribution for US banks and the European Central bank has forbidden to credit institutions (such as banks) to distribute dividends. As financial institutions present a systemic risk, these measures were a way to make sure banks focused on withstanding the economic depression, rather than compensating their shareholders. The Federal Reserve recently declared it would free most banks from the pandemic dividend limits as soon as the large US banks would have cleared the last round of stress tests. As a result, as dividend distribution limitations are lifted and economies return to their long-term trajectory, global dividend distribution is expected to gradually return to normalcy.

Key concepts

Earnings

A company’s earnings refer to its after-tax net income. Located at the bottom of the Income Statement, earnings are also referred as the “bottom line”.

Retained earnings

A company’s retained earnings is the amount of net income (or earnings) left after the company has paid out dividends to its shareholders. Retained earnings remains available for financing the firm business (day-to-day activity, investments, acquisitions of other companies).

Useful resources

Michaely R., R. Thaler and K. Womack (1995) Price Reactions to Dividend Initiations and Omissions: Overreaction or Drift? Journal of Finance, 50(2): 573-608.

DeAngelo H., L. DeAngelo and D. Skinner (2004) Are dividends disappearing? Dividend concentration and the consolidation of earnings, Journal of Financial Economics, 72(3): 425-456.

Krieger K., N. Mauck, S. Pruitt (2020) The impact of the COVID-19 pandemic on dividends, Finance Research Letters.

Holly Ellyatt (February 21, 2021) Pandemic caused $220 billion of global dividend cuts in 2020, research says CNBC.

Barrons

Bloomberg

Lex Europa

About the author

Article written in June 2021 by Raphaël ROERO DE CORTANZE (ESSEC Business School, Master in Management, 2019-2022).