In this article, Youssef LOURAOUI (ESSEC Business School, Global Bachelor of Business Administration, 2017-2021) presents the main actors of the smart beta industry, which is estimated to represent a cumulative market value of $1.9 trillion as of 2017 and is projected to grow to $3.4 trillion by 2022 (BlackRock, 2021).
The structure of this post is as follows: we begin by presenting an overview of the smart beta industry actors. We will then discuss the case of BlackRock, the 10 trillion dollar powerhouse of the asset management industry, which is the main actor in the smart beta industry segment.
Overview of the market
The asset management sector, which is worth 100 trillion dollars worldwide, is primarily divided into active and passive management (BCG, 2021). While active management continues to dominate the market, passive management’s proportion of total assets under managed (AUM) increased by 4 percentage points between 2008 and 2019, reaching 15%. This market transition is even more dramatic in the United States, where passive management accounted for more than 40% of the total market share in 2019. A new category has arisen and begun to acquire market share over the last decade. Smart beta exchange-traded funds (ETFs) are receiving fresh inflows and are the industry’s fastest-growing ETF product. Various players are entering the market by developing and releasing new products (Deloitte, 2021).
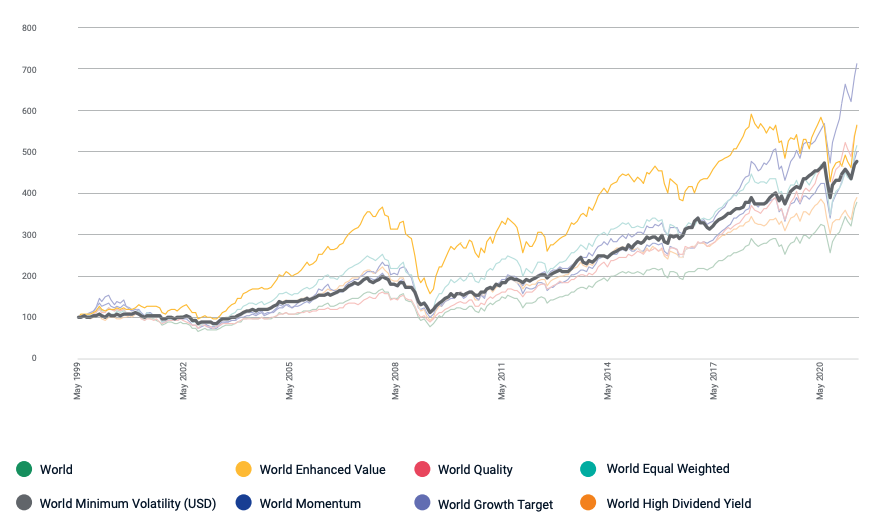
Active funds have demonstrated divergent returns when compared to passive funds, making the cost difference increasingly difficult to justify (Figure 1). The growing market share of passive funds in both the United States and the European Union is putting further pressure on active managers’ fees. When it comes to meeting the demands of investors, both active and passive management has shown shortcomings. Active management funds often fail to outperform their benchmarks because they lack clear indicators, charge expensive fees, and don’t always have clear indicators. As seen in Figure 1, active funds struggle to deliver consistent returns over a prolonged timeframe, as depicted in the European market. In this sense, the active funds success rate is divided by more than half between year one and year three (Deloitte, 2021). Concentration is a problem for passive funds that are weighted by market capitalization.. These limits have prepared the ground for smart beta funds to emerge (Figure 1).
Figure 1. Active funds success rates (% of funds beating their index over X years)
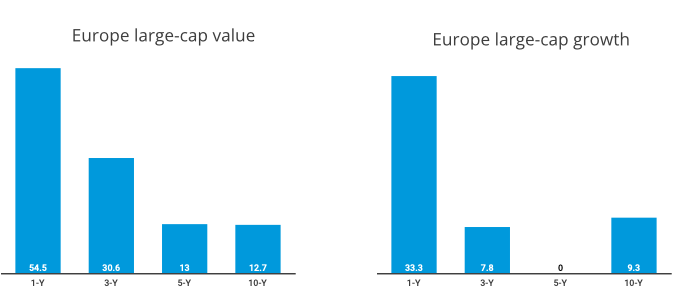
Source: Deloitte (2021).
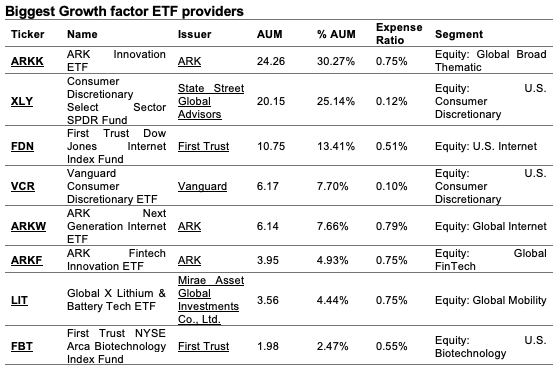
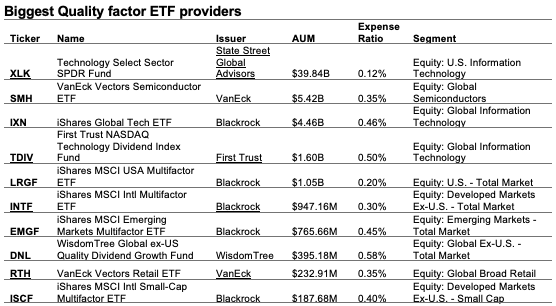
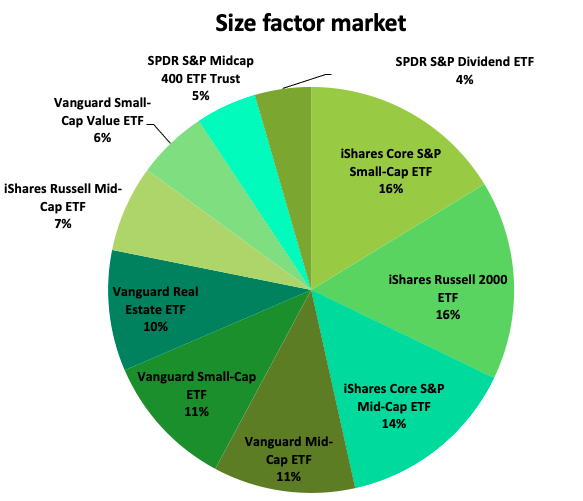
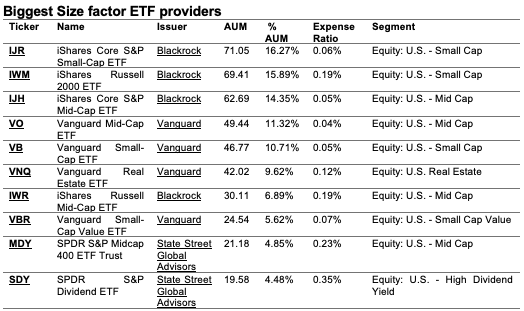
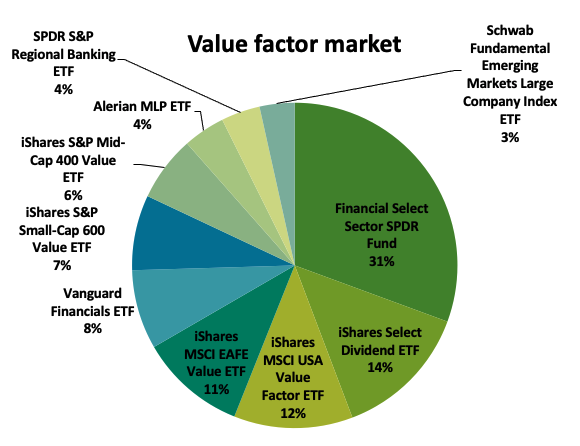
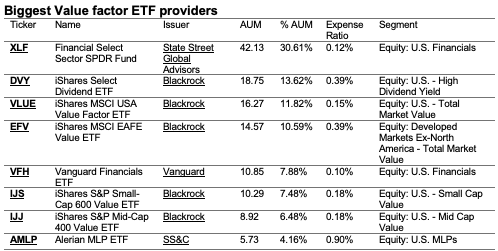
The smart beta market is dominated by several players who have a strategic position with a large volume of assets under management. Figure 2 compares smart beta actors based on percentage of asset under management (%AUM), one the most important metric in the asset management industry. Some key elements can be drawn for the first figure. BlackRock is the provider with the largest market share, with over 40% of the smart beta industry in the analysis, followed by Vanguard and State Street Global Advisors with 30.66% and 18.44% respectively in this benchmark study underpinning nearly $1 trillion (Figure 2).
Figure 2. % AUM of the biggest Smart Beta ETF providers
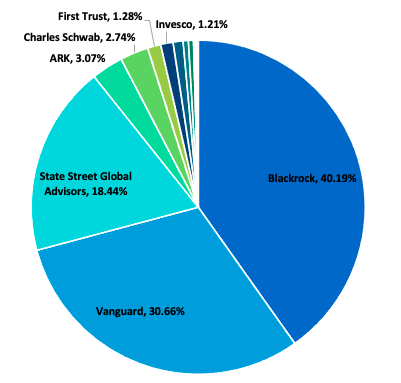
Source: etf.com (2021).
BlackRock dominance
The main powerhouses of the passive investing industry, BlackRock and Vanguard, are poised to capture the lion’s share of assets in the rapidly rising world of actively managed exchange-traded funds. The conclusion is likely to dissatisfy active fund managers, who have been squeezed by the fast development of passive ETFs in recent years and may have seen the introduction of active ETFs as a chance to fight back and get a piece of the lucrative pie (Financial Times, 2021).
According to a study of 320 institutional investors with a combined $12.9 trillion in assets, institutional investors prefer BlackRock and Vanguard to handle their active ETF investments. The juggernauts were expected to provide the best performance as well as the best value for money. With over a third of the global ETF market capitalization, BlackRock remains the dominant player (The Financial Times, 2021). BlackRock is unquestionably a major force in the ETF business, with an unparalleled market share in both the US and European ETF markets. BlackRock has expanded to become the world’s largest asset manager, managing funds for everyone from pensioners to oligarchs and sovereign wealth funds. It is now one of the largest stockholders in practically every major American corporation — as well as a number of overseas corporations. It is also one among the world’s largest lenders to businesses and governments.
Aladdin, the company’s technological platform, provides critical wiring for large portions of the worldwide investing industry. By the end of June this year, BlackRock was managing a stunning $9.5 trillion in assets, a sum that would be hardly understandable to most of the 35 million Americans whose retirement accounts were managed by the business in 2020. If the current rate of growth continues, BlackRock’s third-quarter reports on October 13 might disclose that the company’s market capitalization has surpassed $10 trillion. It’s expected to have surpassed that mark by the end of the year (FT, 2021). To put this in perspective, it is about equivalent to the worldwide hedge fund, private equity, and venture capital industries combined.
Industry-wide fee cuts had helped BlackRock maintain its dominance in the ETF sector. Its iShares brand is the industry’s largest ETF provider for both passive and actively managed products (CNBC, 2021).
Why should I be interested in this post?
If you are a business school or university undergraduate or graduate student, this content will help you in understanding the various evolutions of asset management throughout the last decades and in broadening your knowledge of finance.
Smart beta funds have become a trending topic among investors in recent years. Smart beta is a game-changing invention that addresses an unmet need among investors: a higher return for lower risk, net of transaction and administrative costs. In a way, these investment strategies create a new market. As a result, smart beta is gaining traction and influencing the asset management industry.
Related posts on the SimTrade blog
Factor investing
▶ Youssef LOURAOUI Factor Investing
▶ Youssef LOURAOUI Origin of factor investing
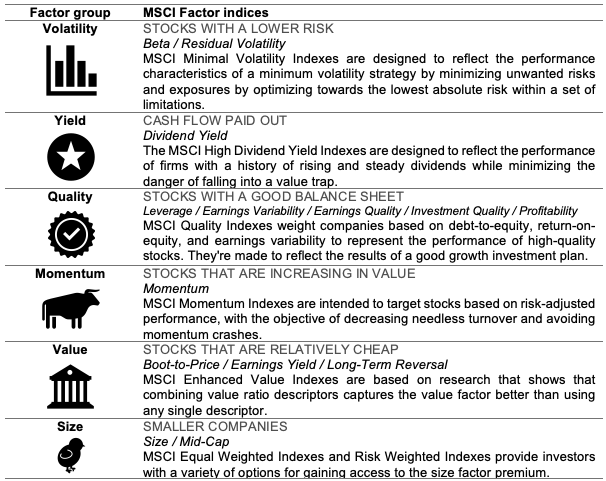
▶ Youssef LOURAOUI MSCI Factor Indexes
▶ Youssef LOURAOUI Smart beta 1.0
▶ Youssef LOURAOUI Smart beta 2.0
Factors
▶ Youssef LOURAOUI Size Factor
▶ Youssef LOURAOUI Value Factor
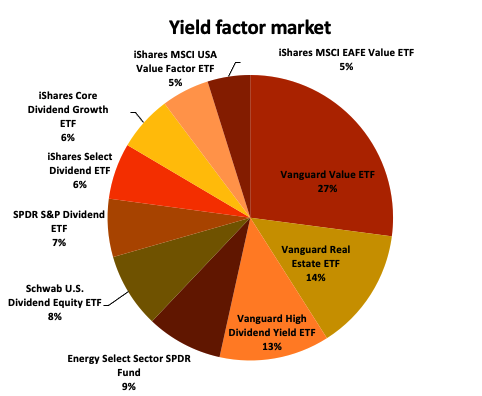
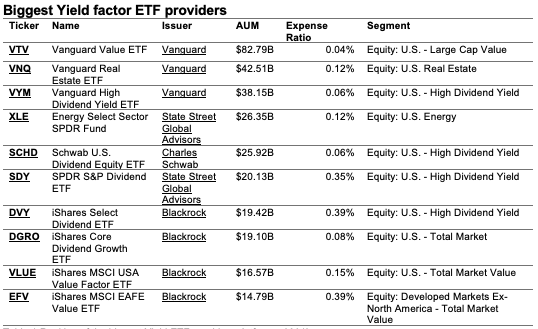
▶ Youssef LOURAOUI Yield Factor
▶ Youssef LOURAOUI Momentum Factor
▶ Youssef LOURAOUI Quality Factor
▶ Youssef LOURAOUI Growth Factor
▶ Youssef LOURAOUI Minimum Volatility Factor
Useful resources
Business analysis
BlackRock, 2021.What is factor investing?
BCG, 2021.The 100$ Trillion Machine: Global Asset Management 2021
CNBC, 2021. What Blackrock’s continued dominance means for other ETF issuers.
Etf.com, 2021.Smart Beta providers
Financial Times (13/09/2020) BlackRock and Vanguard look set to extend dominance to active ETFs
Financial Times (07/10/2021) The ten trillion dollar man: how Larry Fink became king of Wall St
About the author
The article was written in October 2021 by Youssef LOURAOUI (ESSEC Business School, Global Bachelor of Business Administration, 2017-2021).