In this article, Nithisha CHALLA (ESSEC Business School, Grande Ecole Program – Master in Management (MiM), 2021-2024) presents Institutional Brokers’ Estimate System (IBES), which provides market consensus for the financial community.
Introduction
In the fast-paced world of finance, the Institutional Brokers’ Estimate System, commonly known as IBES (often written as “I/B/E/S.”), stands as a linchpin in providing investors, analysts, and financial professionals with reliable forecasts and estimates.
IBES, with its roots in comprehensive data aggregation, takes center stage in providing a panoramic view of financial analysts’ estimates and forecasts. IBES acts as a centralized repository of earnings estimates, revenue projections, and other key financial metrics, serving as a vital resource for investors seeking actionable insights.
History
IBES was created in 1976 by the investment research firm, Lynch, Jones & Ryan (LJR). It was developed to address the need for a centralized system to collect and distribute earnings estimates from brokerage analysts. The database offers historical data from its inception and extends internationally from 1987. Over the years, IBES went through several ownership changes. In 1988, LJR was acquired by Primark Corporation. Primark Corporation later merged with Thomson Financial Services in 1990, and IBES became part of Thomson Financial. Thomson Financial subsequently merged with Reuters Group in 2008 to form Thomson Reuters. Thus, IBES became a part of Thomson Reuters. Then Thomson Reuters was acquired by private equity firm Blackstone Group and rebranded as Refinitiv in 2018. Refinitiv was later acquired by the London Stock Exchange Group (LSEG) in 2020. Therefore, IBES is currently owned by the London Stock Exchange Group (LSEG) through its subsidiary, Refinitiv.
Key Components of IBES
Earnings Estimates
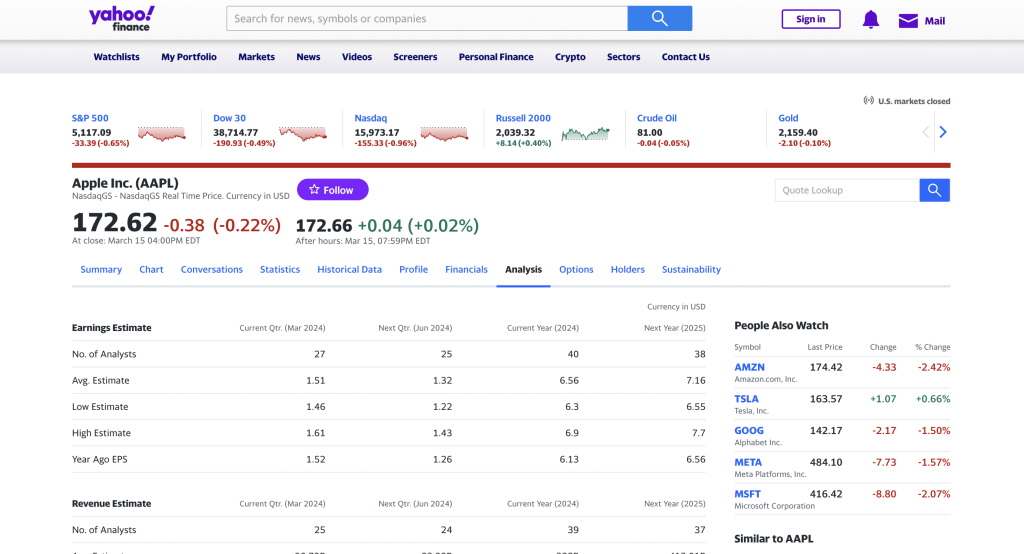
IBES compiles earnings estimates from a multitude of financial analysts, providing a consensus view on the expected earnings of a company. As of the latest data, it aggregates forecasts from over 16,000 analysts worldwide, providing a robust consensus on expected earnings for companies across the globe.
Revenue Projections
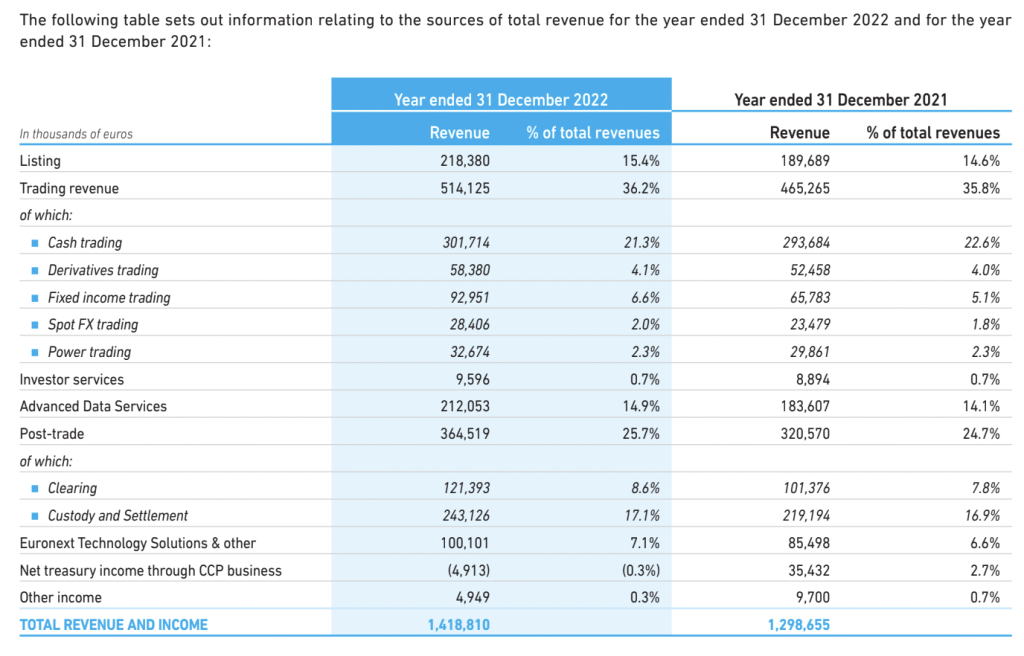
Beyond earnings, IBES includes revenue projections, offering a comprehensive view of a company’s expected top-line growth. Analysts’ forecasts are aggregated to provide a consensus estimate, aiding investors in gauging revenue expectations.
Forecasts for Key Financial Metrics
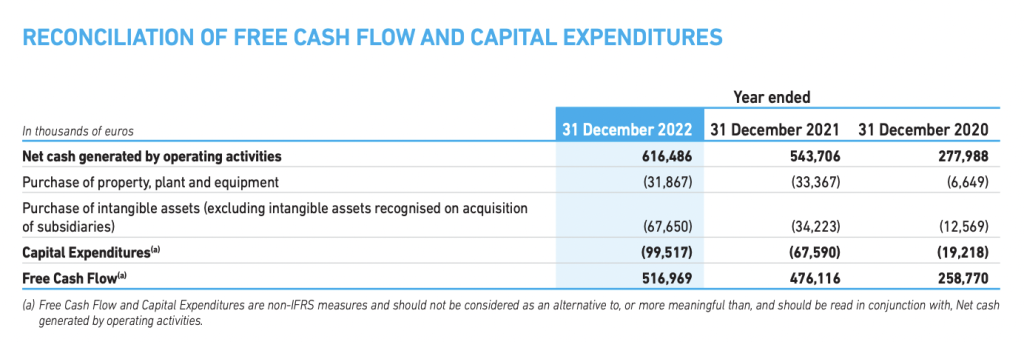
IBES extends beyond earnings and revenue, encompassing a spectrum of financial metrics. This includes estimates for operating margins, cash flows, and other key indicators, providing a holistic view of analysts’ expectations. The sheer volume of data—covering over 18,000 companies—ensures a comprehensive snapshot of financial expectations.
Coverage
There are certain types of coverage when we are talking about data coverage such as the Number of Companies Covered, geographic Coverage, Market Capitalization Coverage, Industry Coverage, Depth of Coverage, and Historical Coverage.
According to LSEG data analytics, I/B/E/S Estimates data is displayed at the company level, screened with rigorous quality control methods across more than 23,400 active companies in more than 90 countries, and sourced from over 19,000 analysts.
Estimates Data from over 950 firms contribute data to I/B/E/S, from the largest global houses to regional and local brokers, with U.S. data back to 1976 and international data back to 1987.
Period
IBES has evolved since its introduction in 1976 and includes international data from 1987. I/B/E/S Global Aggregates, with over 30 years of history, facilitates top-down analysis to better assess potential growth and risk as well as future value across industry, sector, index, country, and region.
Frequency
Initially focusing on annual earnings estimates, the database subsequently broadened to encompass quarterly earnings forecasts.
Firms and Financial analysts
IBES covers a wide range of firms across different industries, sectors, and regions. This includes companies listed on major stock exchanges in numerous countries and markets around the world. 950+ contributors, across 90+ in developed and emerging markets, totaling over 19,000 individual analysts – the most in the industry. Unmatchable history across more than 60,000 companies back to 1976 for North America, 1987 for other markets.
Pricing
The specific pricing for accessing I/B/E/S data is not explicitly mentioned on the IBES website and you have to make a request through the LSEG website which manages IBES. The cost likely varies based on the package and offerings selected, which can include different data sets, access methods, and service frequencies. For detailed pricing information, it’s recommended to directly contact LSEG or the respective service providers you’re interested in, as they can provide more precise details based on your specific requirements and the scale of your intended use.
For academic and non-commercial research purposes, access might be available through institutional subscriptions with specific terms of use, as seen with Aalto University’s subscription financed by the Aalto University Data Hub for its users. This indicates that the availability and cost of I/B/E/S data may vary significantly based on the type of use and the access platform. For precise pricing and package options, directly contacting the service providers is the best approach.
Use of IBES by the Financial Community
Benchmark for Analysis
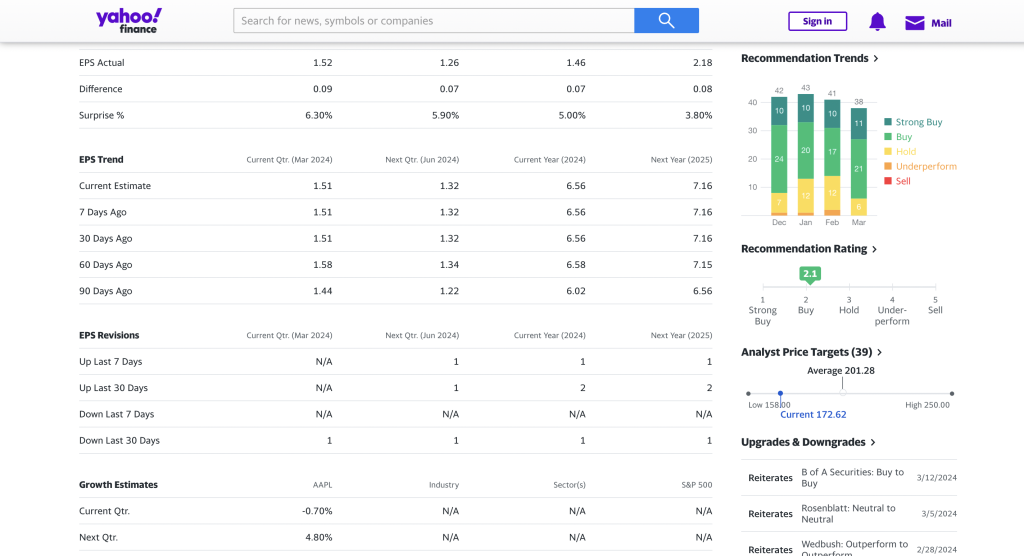
IBES serves as a benchmark for investors and analysts, quantifying market reactions, it dives into the numbers behind market reactions. According to Faster Capital, studies reveal that stocks experiencing positive earnings surprises, surpassing IBES estimates, tend to outperform the market. These numerical insights underscore the practical implications of aligning investment decisions with IBES consensus.
Market Expectations
Analysts and fund managers utilize IBES to gauge market expectations for specific companies. Understanding consensus estimates aids in forming investment strategies aligned with prevailing market sentiments.
Earnings Season Preparation
During earnings seasons, IBES becomes a critical tool for investors preparing for companies’ financial releases. It provides a consolidated view of analysts’ forecasts, helping investors assess potential surprises or disappointments.
IBES and Tests of Market Efficiency
Academic works
The data was subsequently used as the basis for articles in academic finance journals attempting to demonstrate that changes in consensus earnings estimates could identify opportunities to capture excess returns in subsequent periods.
Information Dissemination
IBES plays a pivotal role in disseminating timely information. As estimates are constantly updated based on new information, IBES ensures that market participants have access to the latest insights, contributing to market efficiency.
Pros and Cons
Given its history and operations in huge industries and markets, we certainly need to know the pros and cons of the IBES estimates. In terms of accuracy metrics, IBES relies on the accuracy of analysts’ forecasts. Statistical metrics, such as the mean absolute error (MAE), offer a quantitative evaluation of the system’s precision.
Conclusion
IBES, when viewed through a data-driven lens, transforms into more than a system and becomes a useful tool for decision-makers navigating the intricacies of financial markets.
Why should I be interested in this post?
In essence, this article discovers how the global data powerhouse, backed by impactful statistics, empowers investors, providing a data-driven lens into market expectations and offering actionable insights for informed decision-making in the dynamic world of finance.
Related posts on the SimTrade blog
▶ Aamey MEHTA Market efficiency: the case study of Yes bank in India
▶ Louis DETALLE The importance of data in finance
▶ Bijal GANDHI Earnings per share
Useful resources
London Stock Exchange Group (LSEG) I/B/E/S Estimates
Wikipedia Institutional Brokers’ Estimate System
Market consensus What is market consensus?
Faster Capital Navigating Markets: The Power of Market Analysis and Consensus Estimates