

In this article, Nithisha CHALLA (ESSEC Business School, Grande Ecole Program – Master in Management, 2021-2023) presents the KOSPI 50 index representing the South Korean equity market and details its characteristics.
The KOSPI 50 index
A well-known stock market index in South Korea, the KOSPI 50 index serves as a crucial benchmark for the South Korean equity market. It represents the performance of the 50 biggest and busiest companies traded on the main South Korean stock exchange, the Korea Exchange (KRX), listed on the market.
The KOSPI 50 index, which was created on April 1, 2002, is managed by the Korea Exchange and is widely regarded as an accurate indicator of the Korean economy and its key sectors. Market capitalization, trading volume, and liquidity are used in the index selection process to make sure that only the most significant and representative companies from the Korean market are included.
The KOSPI 50, a market capitalization-weighted index, takes into account the market value of each constituent stock to reflect the relative importance of each stock. The KOSPI 50 is prominently displayed on trading platforms and financial websites, similar to other significant stock market indices, making it simple for investors and analysts worldwide to access. It is a crucial indicator of the state and trends of the Korean economy and is important for making investment decisions.
The ticker symbol commonly used in the financial industry to represent the KOSPI 50 index is “KOSPI50”.
Table 1 below gives the Top 10 stocks in the KOSPI 50 index in terms of market capitalization as of January 31, 2023.
Table 1. Top 10 stocks in the KOSPI 50 index.
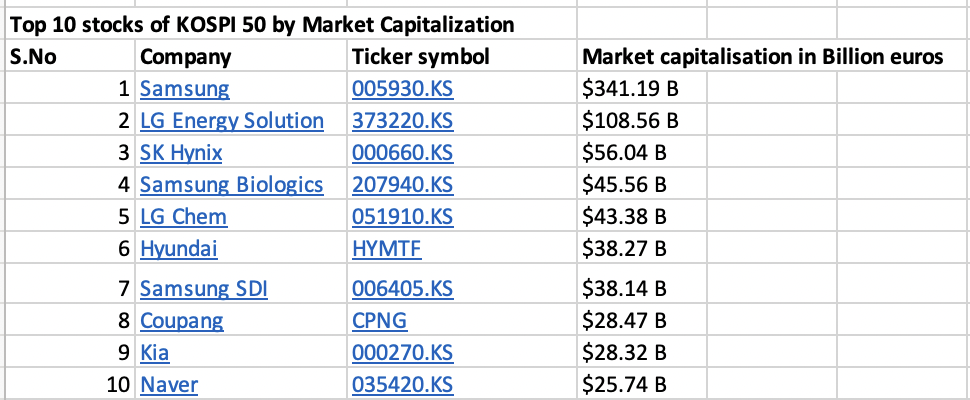
Source: computation by the author (data: Yahoo! Finance website).
Table 2 below gives the sector representation of the KOSPI 50 index in terms of number of stocks and market capitalization as of January 31, 2023.
Table 2. Sector representation in the KOSPI 50 index.
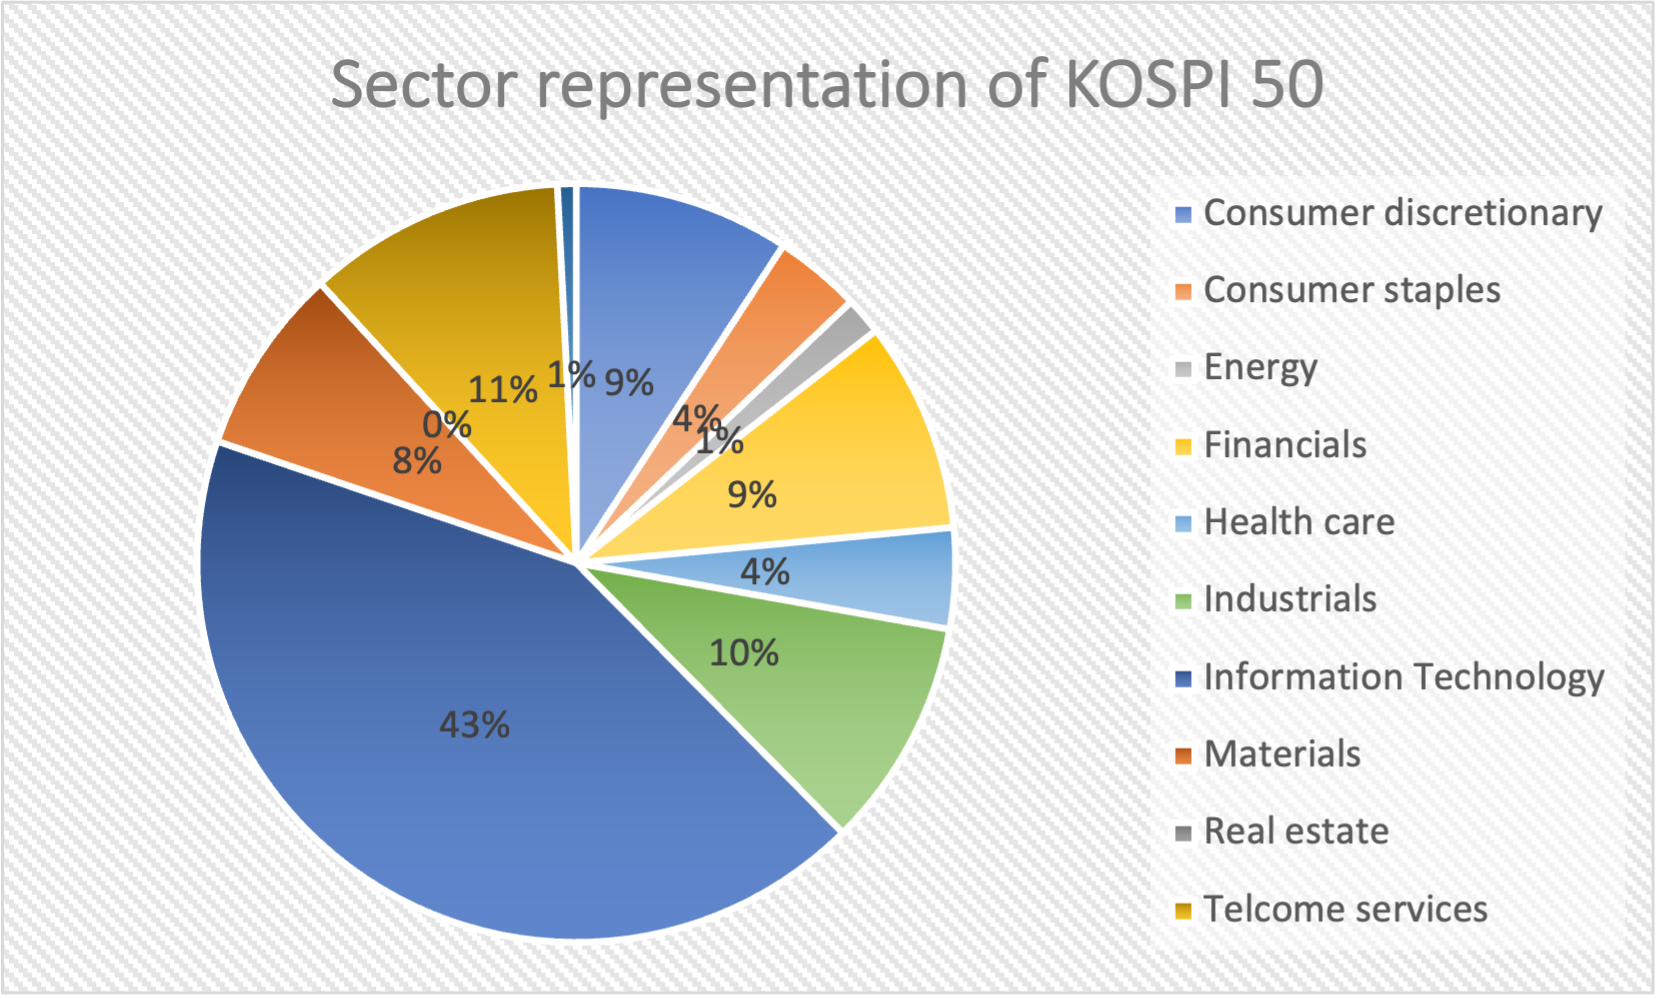
Source: computation by the author (data: Yahoo! Finance website).
Calculation of the KOSPI 50 index value
The KOSPI 50 index is a float-adjusted market-capitalization-weighted index. It is adjusted for the proportion of shares that are available for trading in the market as well as the market value of each constituent stock. With the help of this weighting methodology, investors can get a complete picture of the Korean market by ensuring that larger companies have a greater influence on the index’s movements than smaller ones.
The formula to compute the KOSPI 50 index is given by
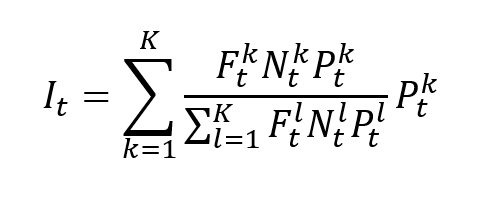
where I is the index value, k a given asset, K the number of assets in the index, Pk the market price of asset k, Nk the number of issued shares for asset k, Fk the float factor of asset k, and t the time of calculation of the index.
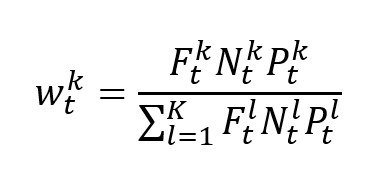
In a float-adjusted market-capitalization-weighted index, the weight of asset k is given by
Use of the KOSPI 50 index in asset management
The analysis of the companies that make up the KOSPI 50 index offers important new perspectives on the Korean economy, its key industries, and the elements that influence business success there. The index also acts as a crucial tool for investors, allowing them to assess the performance of their portfolios in comparison to the larger Korean market and make well-informed investment choices. It supports various asset management tasks, such as passive investments, evaluating corporate risk, asset allocation, and portfolio management, and offers investors insightful information.
Benchmark for equity funds
Investors can gain a thorough understanding of the South Korean market and make wise investment decisions by following the KOSPI 50 index. It is significant to remember that the KOSPI 50 index, which includes the 50 largest and most actively traded companies in South Korea, represents a particular market segment. While it offers an accurate indicator of the performance of these well-known businesses, it might not accurately reflect the performance of all markets and industry sectors nationwide. Investors should think about incorporating other indices, such as the KOSPI 200, which covers a wider range of companies listed on the Korea Exchange, or the MSCI Korea Index, which includes a more diverse set of companies, to obtain a more thorough evaluation of the South Korean market.
Financial products around the KOSPI 50 index
Different financial products linked to the KOSPI 50 index are available for investors looking to diversify their portfolios and increase their exposure to the South Korean stock market. These products offer chances to possibly profit from changes in the market and take part in the performance of the 50 biggest and most actively traded South Korean companies.
Here are some of the main financial products associated with the KOSPI 50 index:
- Exchange-Traded Funds (ETFs): similar to stocks, investors can trade and invest in ETFs that track the KOSPI 50 index. These ETFs offer a practical way to get exposure to the KOSPI 50 companies’ performance. The KODEX KOSPI 200 ETF and the Samsung KODEX Leverage ETF are two examples of KOSPI 50 ETFs.
- Options and Futures Contracts: Investors can use options and futures contracts based on the KOSPI 50 index to manage risk, make predictions about market trends, or put trading strategies into practice. Investors can purchase or sell the index through these derivative contracts at predetermined future prices and dates.
- Mutual Funds and Index Funds: A number of mutual funds and index funds concentrate their investments in the businesses represented by the KOSPI 50 index. These funds seek to match the performance of the index or build portfolios that closely resemble the index’s components. Through these funds, investors can gain exposure to the KOSPI 50, allowing for investment diversification and expert management.
Historical data for the KOSPI 50 index
How to get the data?
The KOSPI 50 index is the most common index used in finance, and historical data for the KOSPI 50 index can be easily downloaded from the internet.
For example, you can download data for the KOSPI 50 index from December 11, 1996 on Yahoo! Finance (the Yahoo! code for KOSPI 50 index is ^KS11).
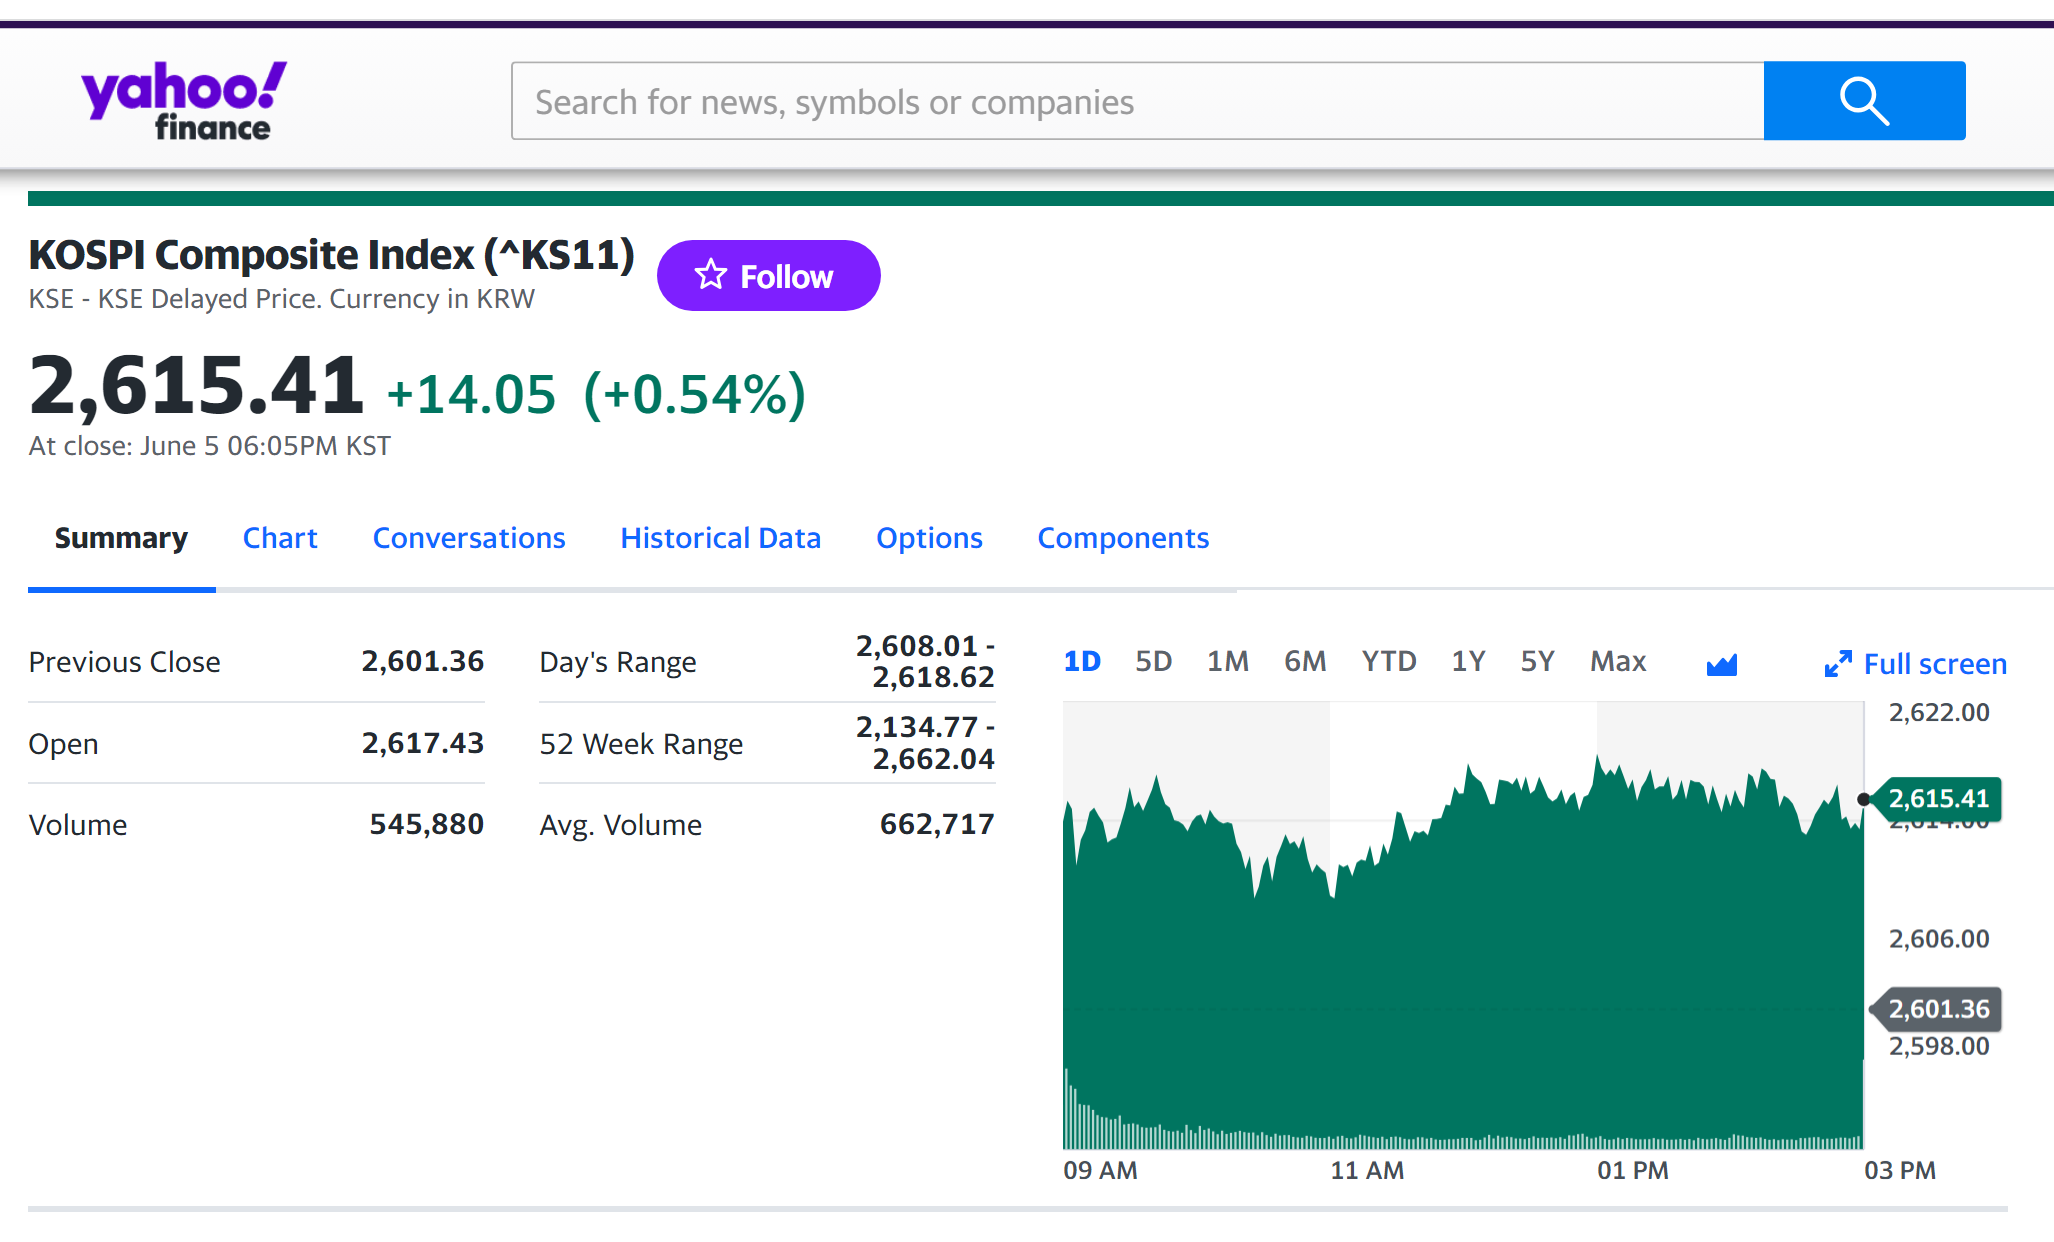
Source: Yahoo! Finance.
You can also download the same data from a Bloomberg terminal.
R program
The R program below written by Shengyu ZHENG allows you to download the data from Yahoo! Finance website and to compute summary statistics and risk measures about the KOSPI 50 index.

Data file
The R program that you can download above allows you to download the data for the KOSPI 50 index from the Yahoo! Finance website. The database starts on December 11, 1996. It also computes the returns (logarithmic returns) from closing prices.
Table 3 below represents the top of the data file for the KOSPI 50 index downloaded from the Yahoo! Finance website with the R program.
Table 3. Top of the data file for the KOSPI 50 index.
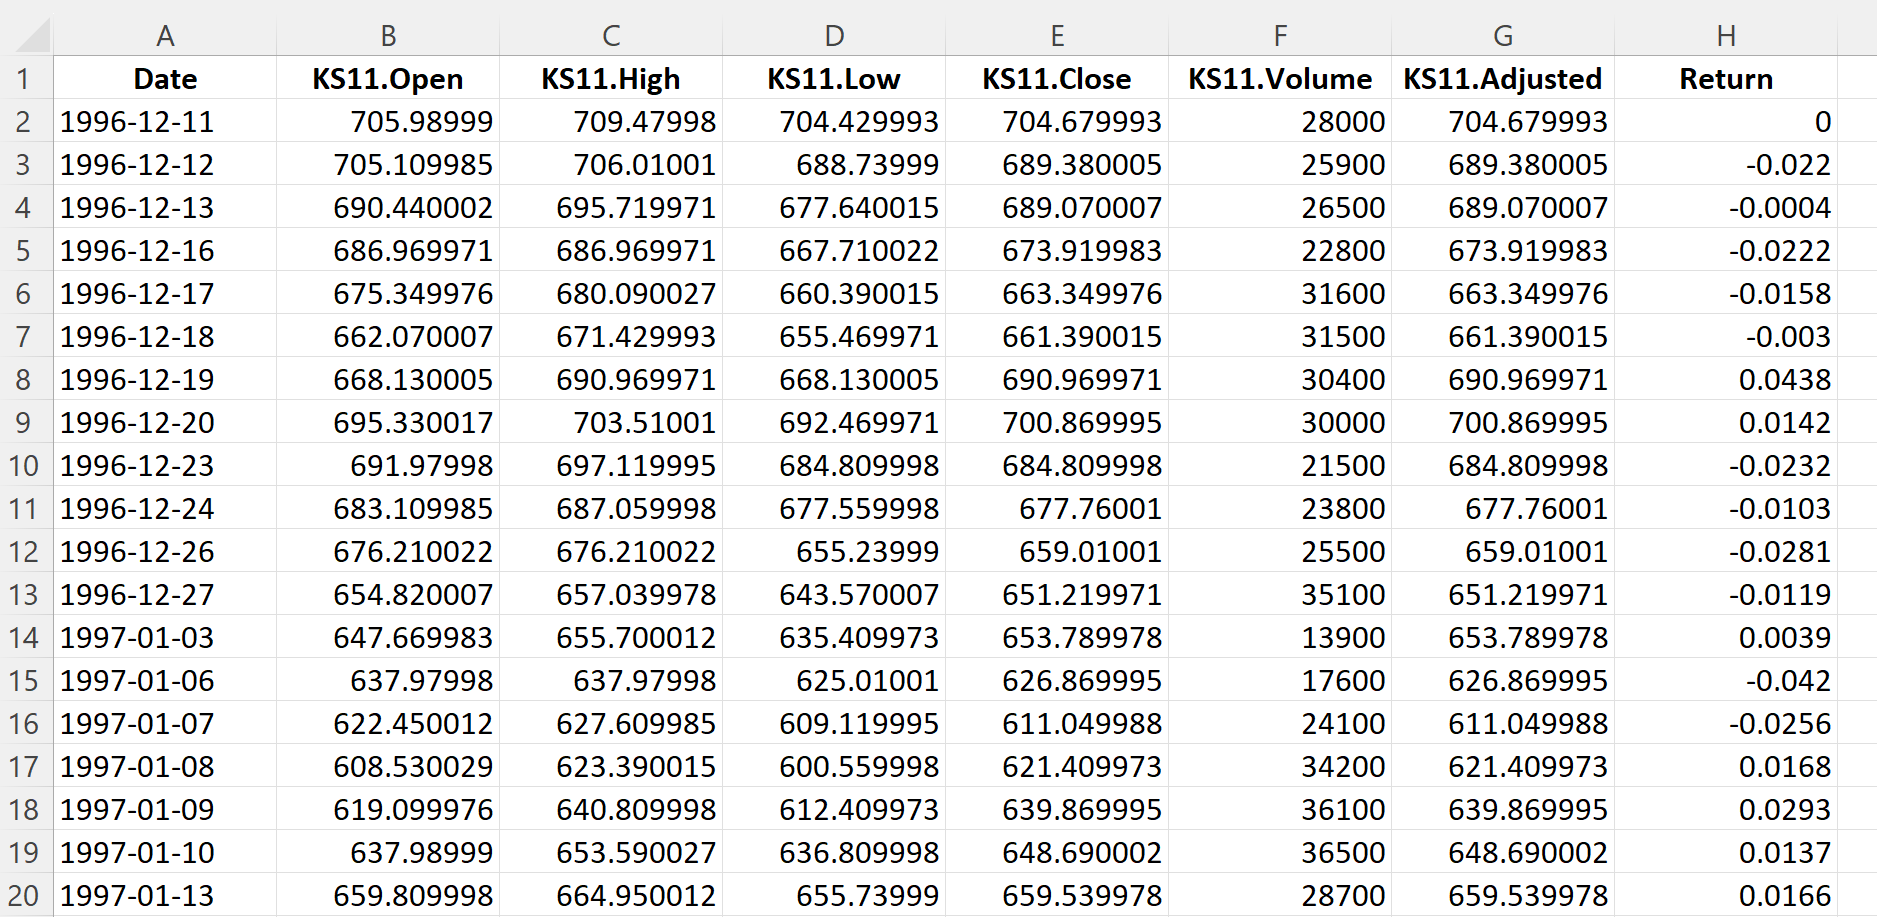
Source: computation by the author (data: Yahoo! Finance website).
Evolution of the KOSPI 50 index
Figure 1 below gives the evolution of the KOSPI 50 index from December 11, 1996 to December 30, 2022 on a daily basis.
Figure 1. Evolution of the KOSPI 50 index.
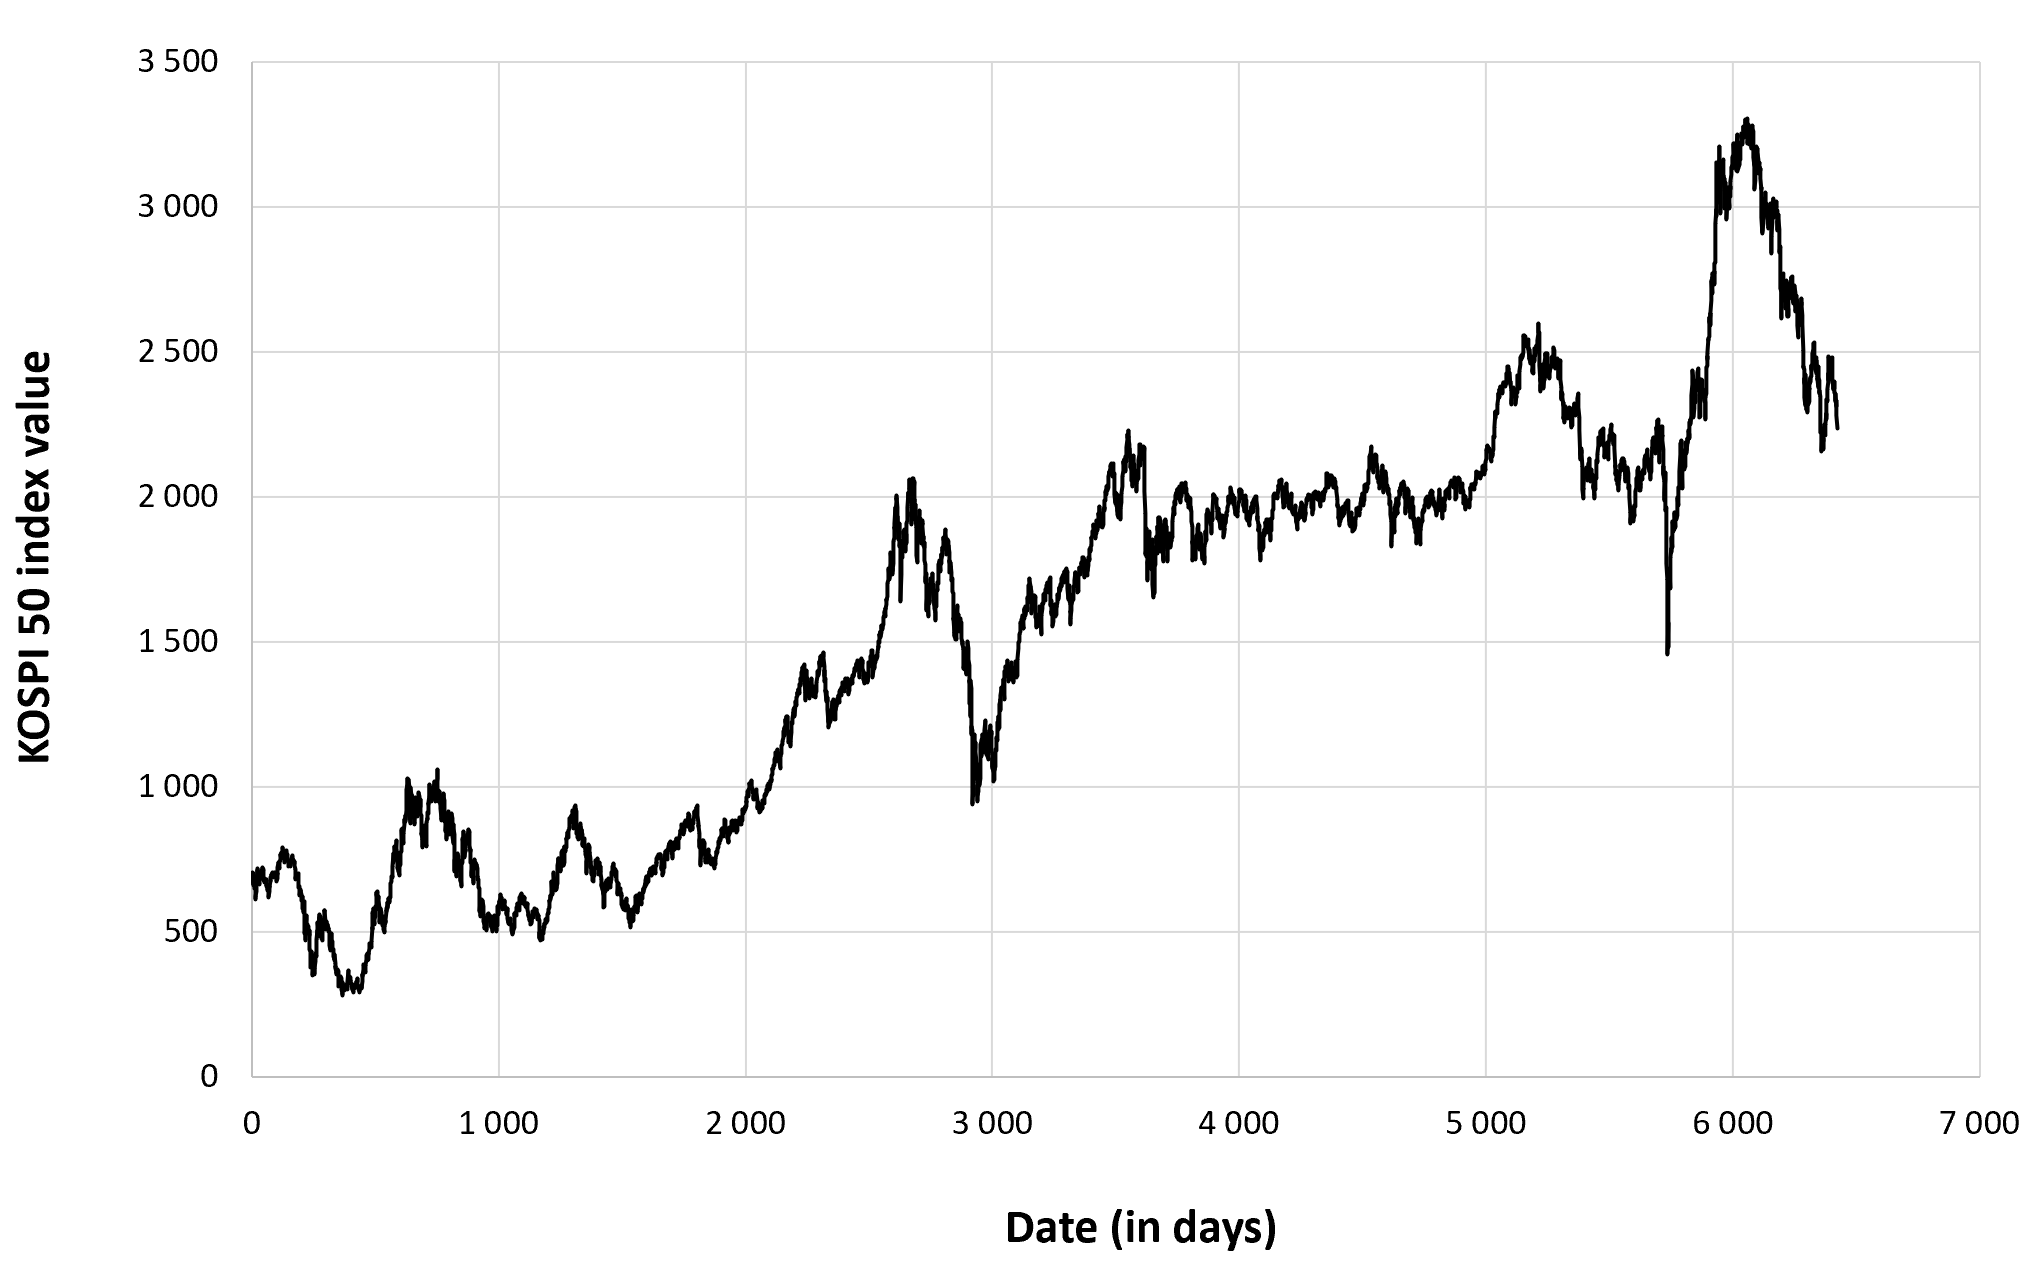
Source: computation by the author (data: Yahoo! Finance website).
Figure 2 below gives the evolution of the KOSPI 50 index returns from December 11, 1996 to December 30, 2022 on a daily basis.
Figure 2. Evolution of the KOSPI 50 index returns.
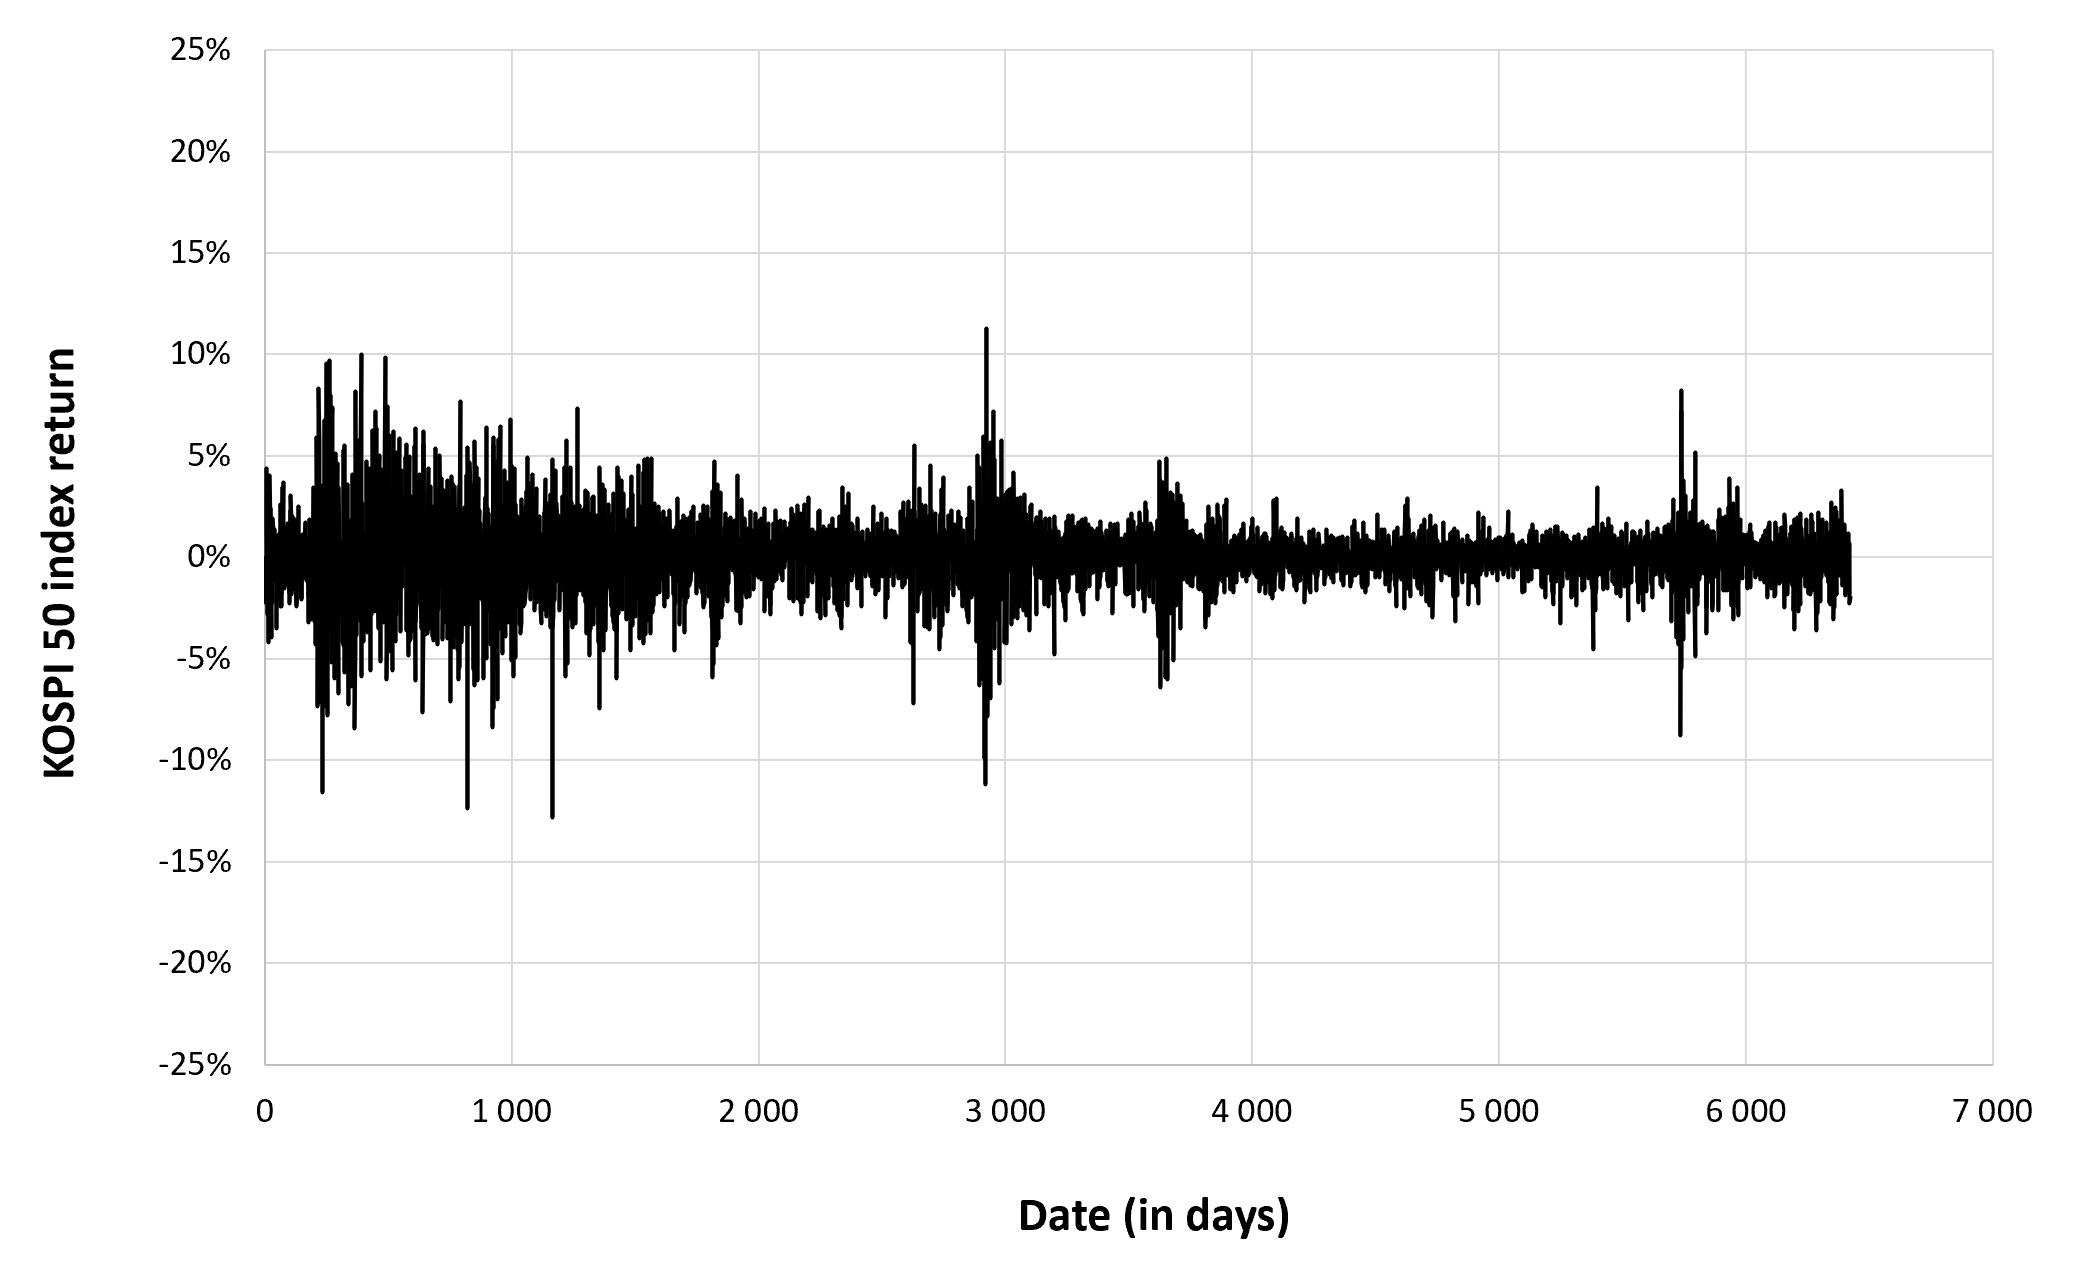
Source: computation by the author (data: Yahoo! Finance website).
Summary statistics for the KOSPI 50 index
The R program that you can download above also allows you to compute summary statistics about the returns of the KOSPI 50 index.
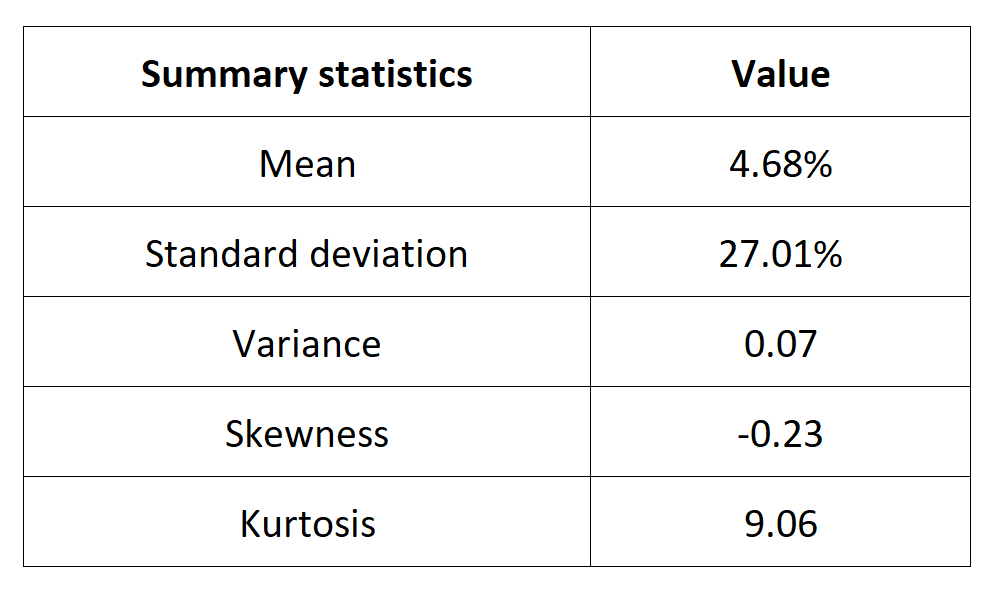
Table 4 below presents the following summary statistics estimated for the KOSPI 50 index:
- The mean
- The standard deviation (the squared root of the variance)
- The skewness
- The kurtosis.
The mean, the standard deviation / variance, the skewness, and the kurtosis refer to the first, second, third and fourth moments of statistical distribution of returns respectively.
Table 4. Summary statistics for the KOSPI 50 index.
Source: computation by the author (data: Yahoo! Finance website).
Statistical distribution of the KOSPI 50 index returns
Historical distribution
Figure 3 represents the historical distribution of the KOSPI 50 index daily returns for the period from December 11, 1996 to December 30, 2022.
Figure 3. Historical distribution of the KOSPI 50 index returns.
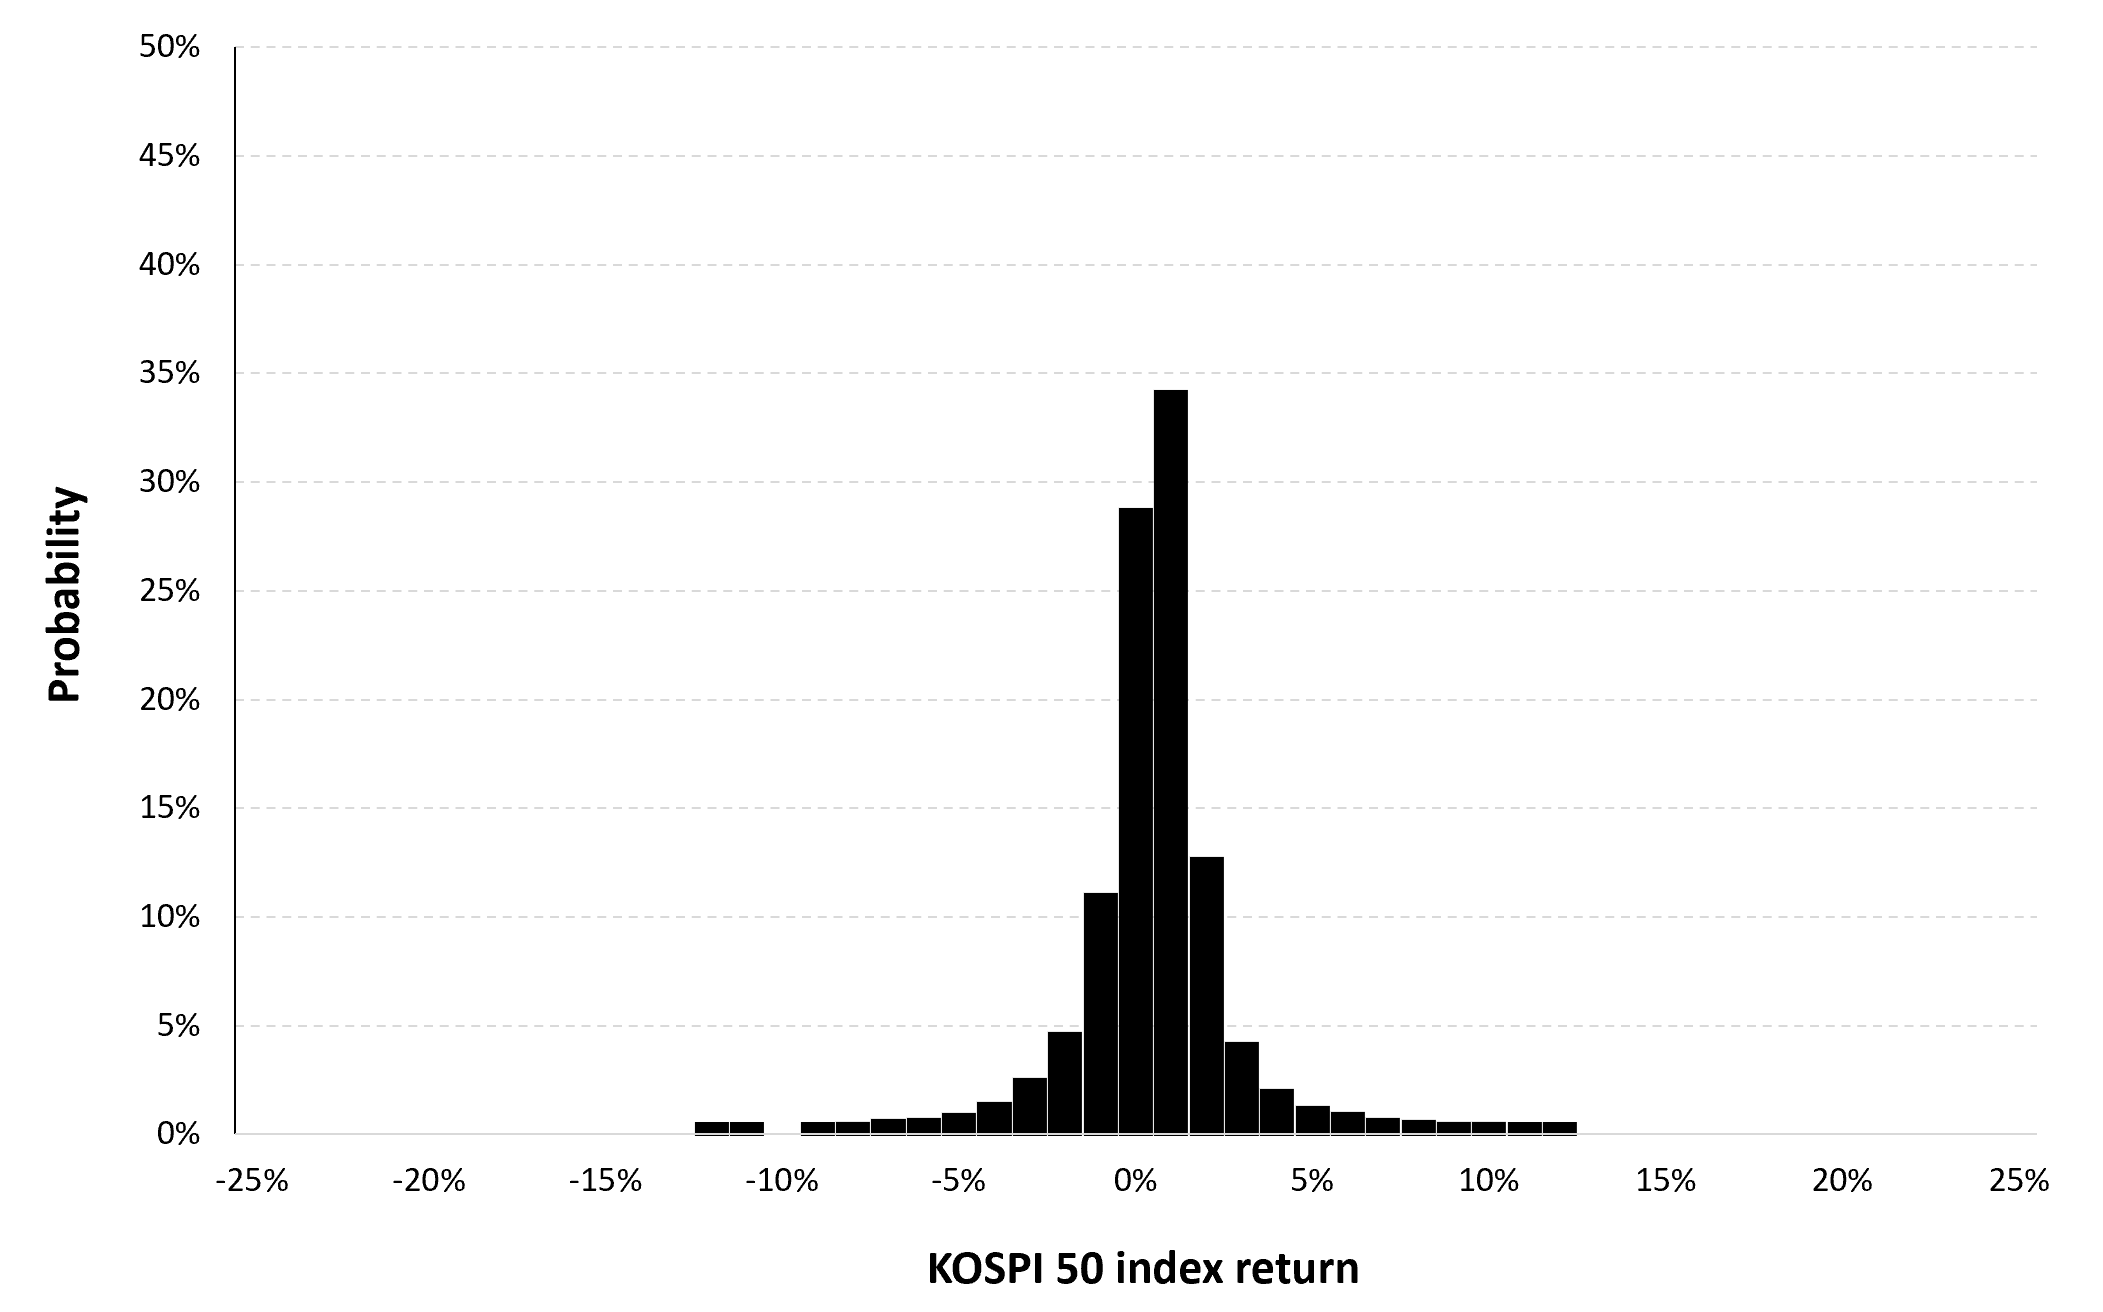
Source: computation by the author (data: Yahoo! Finance website).
Gaussian distribution
The Gaussian distribution (also called the normal distribution) is a parametric distribution with two parameters: the mean and the standard deviation of returns. We estimated these two parameters over the period from December 11, 1996 to December 30, 2022. The mean of daily returns is equal to 0.02% and the standard deviation of daily returns is equal to 1.37% (or equivalently 3.94% for the annual mean and 28.02% for the annual standard deviation as shown in Table 3 above).
Figure 4 below represents the Gaussian distribution of the KOSPI 50 index daily returns with parameters estimated over the period from December 11, 1996 to December 30, 2022.
Figure 4. Gaussian distribution of the KOSPI 50 index returns.
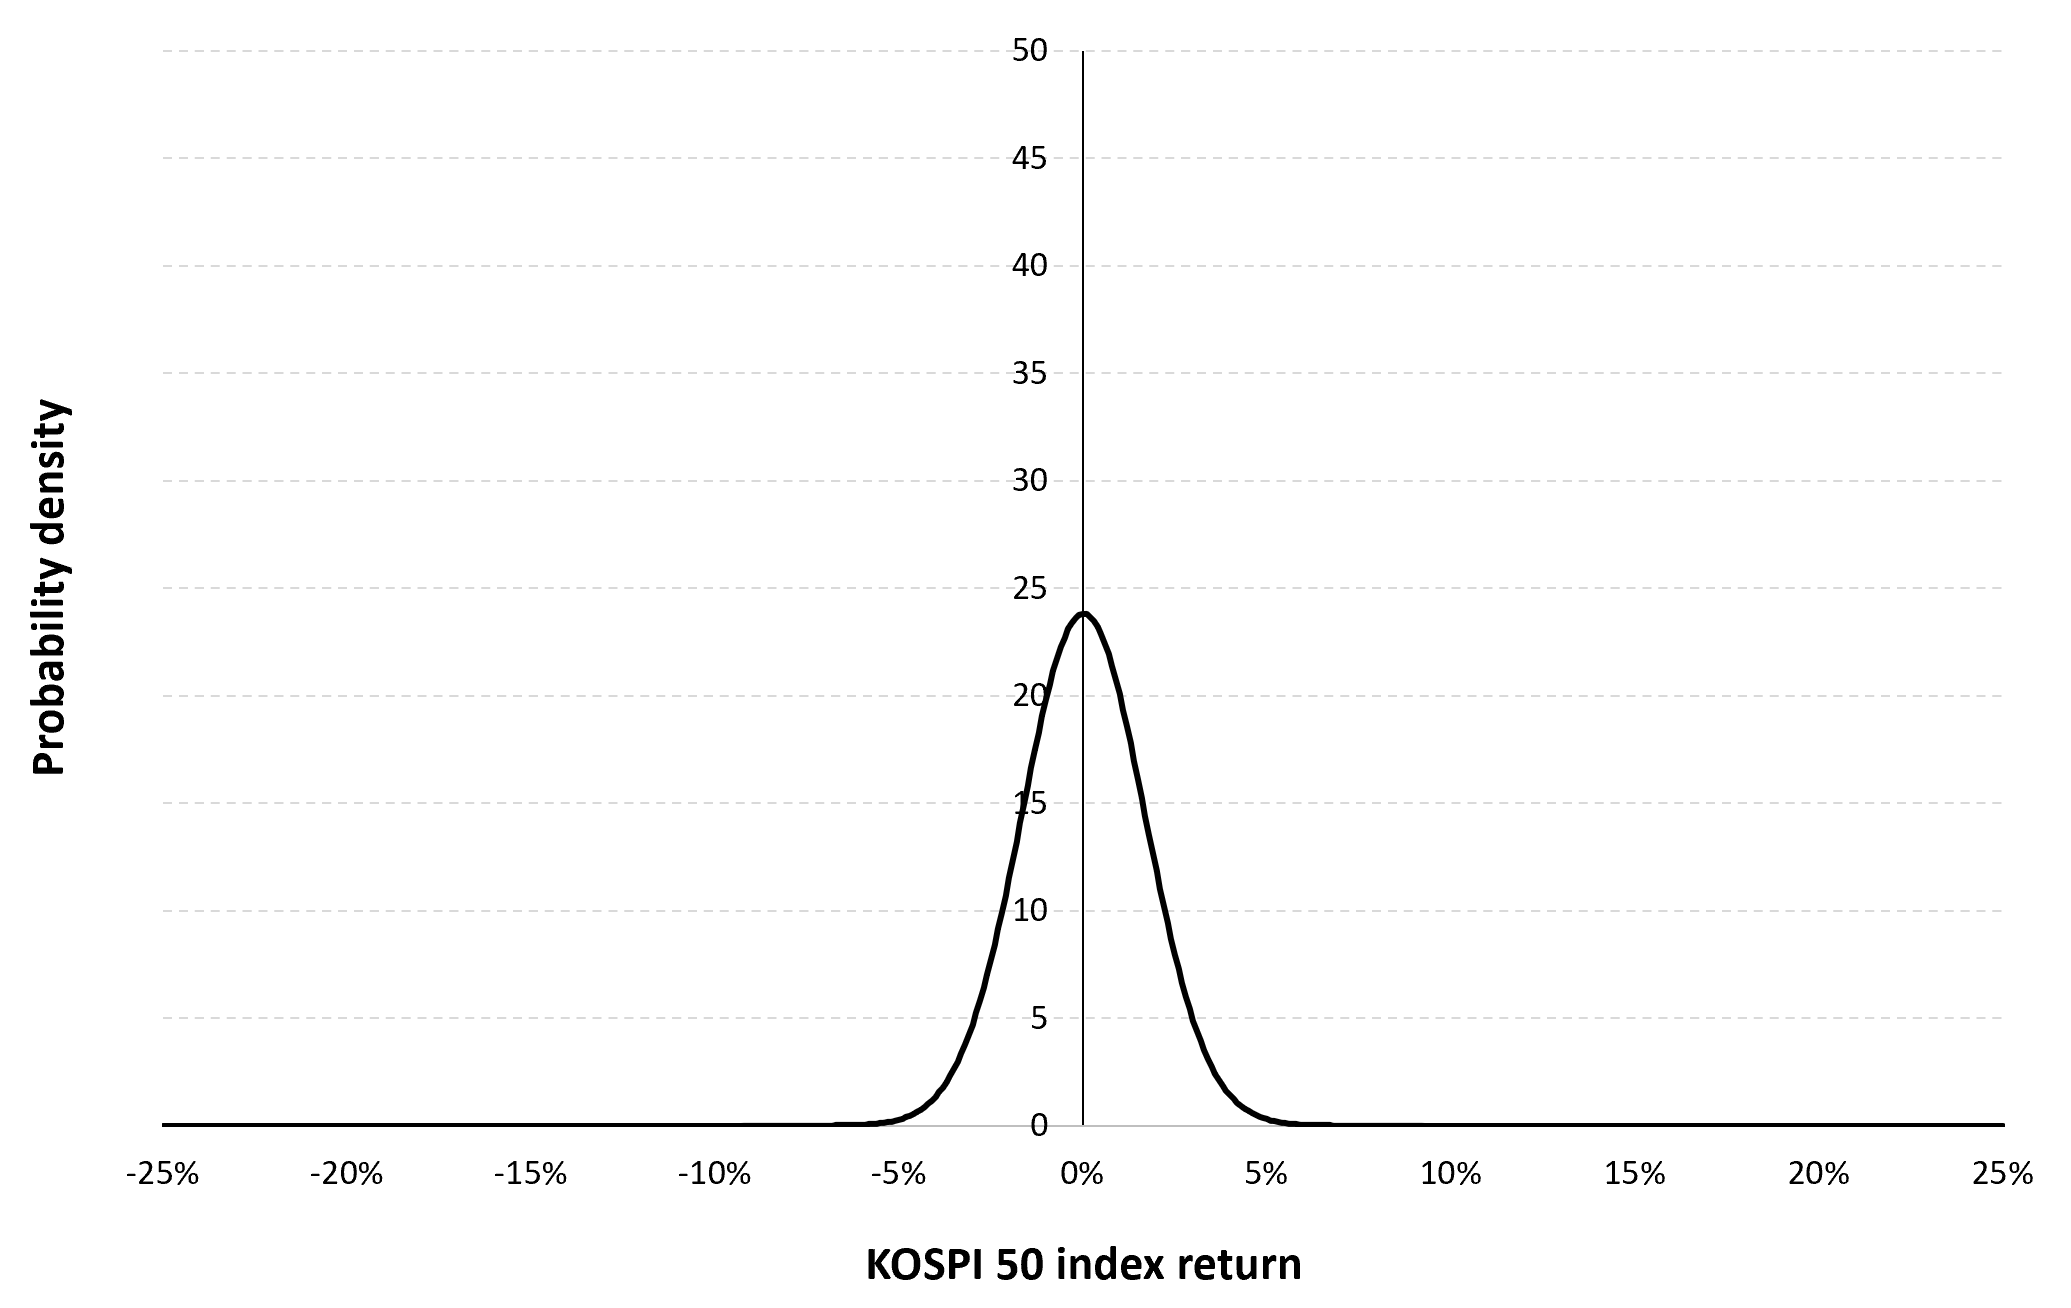
Source: computation by the author (data: Yahoo! Finance website).
Risk measures of the KOSPI 50 index returns
The R program that you can download above also allows you to compute risk measures about the returns of the KOSPI 50 index.
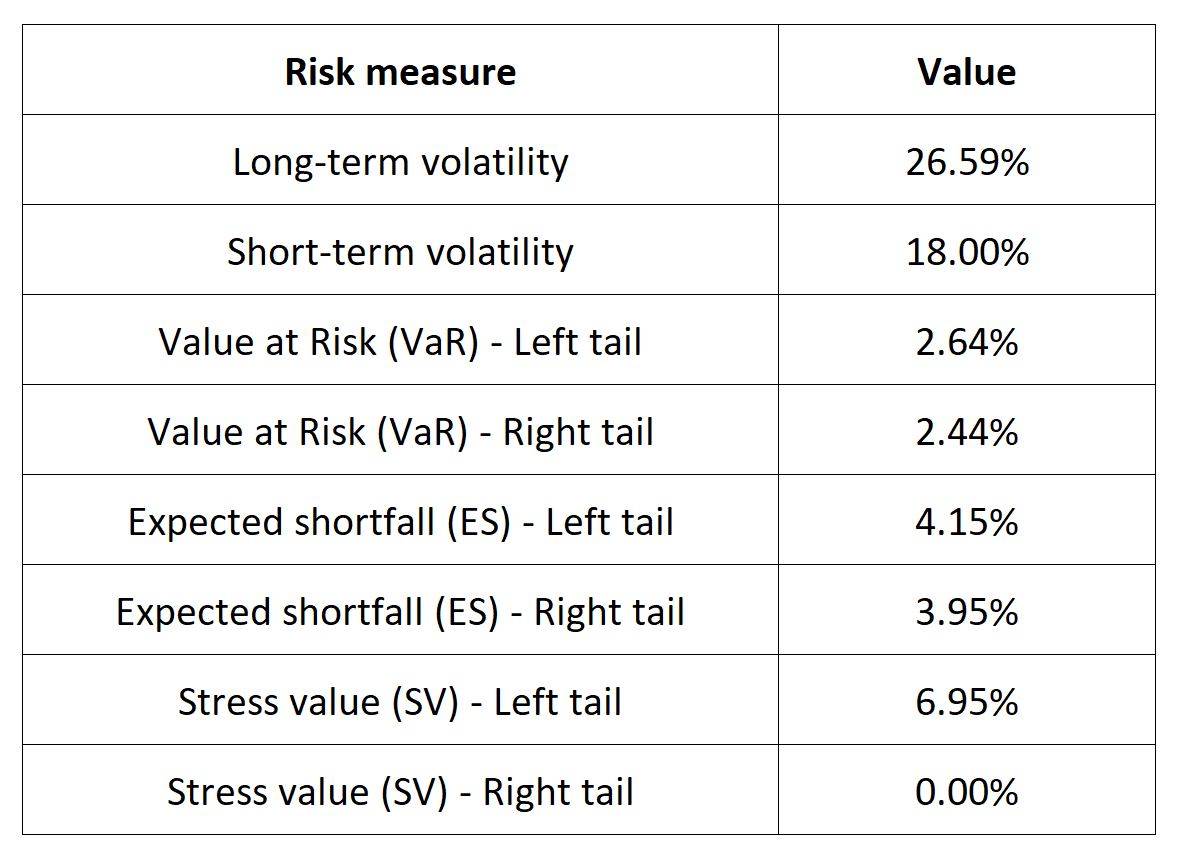
Table 5 below presents the following risk measures estimated for the KOSPI 50 index:
- The long-term volatility (the unconditional standard deviation estimated over the entire period)
- The short-term volatility (the standard deviation estimated over the last three months)
- The Value at Risk (VaR) for the left tail (the 5% quantile of the historical distribution)
- The Value at Risk (VaR) for the right tail (the 95% quantile of the historical distribution)
- The Expected Shortfall (ES) for the left tail (the average loss over the 5% quantile of the historical distribution)
- The Expected Shortfall (ES) for the right tail (the average loss over the 95% quantile of the historical distribution)
- The Stress Value (SV) for the left tail (the 1% quantile of the tail distribution estimated with a Generalized Pareto distribution)
- The Stress Value (SV) for the right tail (the 99% quantile of the tail distribution estimated with a Generalized Pareto distribution)
Table 5. Risk measures for the KOSPI 50 index.
Source: computation by the author (data: Yahoo! Finance website).
The volatility is a global measure of risk as it considers all the returns. The Value at Risk (VaR), Expected Shortfall (ES) and Stress Value (SV) are local measures of risk as they focus on the tails of the distribution. The study of the left tail is relevant for an investor holding a long position in the KOSPI 50 index while the study of the right tail is relevant for an investor holding a short position in the KOSPI 50 index.
Why should I be interested in this post?
For a number of reasons, management students (as future managers and individual investors) should learn about the KOSPI 50 index. The index includes wide range of industries, including energy, finance, telecommunications, and consumer goods, and it covers the biggest and most liquid German companies. Understanding how the index is constructed, how it performs, and the companies that make up the index is important for anyone studying finance or business in Russia or interested in investing in German equities.
Individual investors can assess the performance of their own investments in the German equity market with the KOSPI 50 index. Last but not least, a lot of asset management firms base their mutual funds and exchange-traded funds (ETFs) on the KOSPI 50 index which can considered as interesting assets to diversify a portfolio. Learning about these products and their portfolio and risk management applications can be valuable for management students.
Related posts on the SimTrade blog
About financial indexes
▶ Nithisha CHALLA Financial indexes
▶ Nithisha CHALLA Calculation of financial indexes
▶ Nithisha CHALLA The business of financial indexes
▶ Nithisha CHALLA Float
Other financial indexes
▶ Nithisha CHALLA The S&P 500 index
▶ Nithisha CHALLA The FTSE 100 index
▶ Nithisha CHALLA The CSI 300 index
▶ Nithisha CHALLA The Nikkei 225 index
About portfolio management
▶ Youssef LOURAOUI Portfolio
▶ Jayati WALIA Returns
About statistics
▶ Shengyu ZHENG Moments de la distribution
▶ Shengyu ZHENG Mesures de risques
Useful resources
Academic research about risk
Longin F. (2000) From VaR to stress testing: the extreme value approach Journal of Banking and Finance, N°24, pp 1097-1130.
Longin F. (2016) Extreme events in finance: a handbook of extreme value theory and its applications Wiley Editions.
Business
Wikipedia What is the KOSPI 50 index
PWC A guide to listing on the Korean exchange
Data
Yahoo! Finance Historical data for the KOSPI 50 index
About the author
The article was written in June 2023 by Nithisha CHALLA (ESSEC Business School, Grande Ecole Program – Master in Management, 2021-2023).