My experience as a sell-side equity research analyst

My experience as a sell-side equity research analyst

Tanmay DAGA

In this article, Tanmay DAGA (ESSEC Business School, Global Bachelor of Business Administration, 2017-2021) introduces equity research, shares his internship experience at a top sell-side equity research company named Kotak Securities and gives his opinions on what the future holds for the industry.

About Kotak Securities

Kotak Securities was founded in 1994 as a subsidiary of Kotak Mahindra Bank and is headquartered in Mumbai, India. It is headed by Mr. Jaideep Hansraj who is a leading figure and has over 20 years of experience in the equity research industry. The company has over 1.7 million customer accounts and handles over 800,000 trades every single day making it one of the biggest brokerage houses in the country. The company handles operations in over 394 cities in India and is well poised for further expansion helping it expand its customer base. Kotak Securities offers stock broker services, portfolio management services, depository services, research expertise, dynamic market data and international reach for clients looking for investment opportunities overseas.

Kotak Securities

What is equity research?

It is a mainstream finance position which entails fundamental analysis and subsequent recommendation of public securities. Fundamental analysis is a method of evaluating the intrinsic value of an asset (future cash flows discounted to the present) and analyzing the factors that could influence its price in the future. Hence, equity research is an investigation based upon the core business drivers of a particular business which are reflected in its financial statements. Hence, equity researchers use financial statements combined with other industry and macroeconomic reports to form their opinion about a certain company or a universe of companies (also called coverage list). Investors such as money/managers use this information to better investigate their potential or existing investment decisions. To conclude, the main purpose of equity research is to provide investors with detailed financial analysis and recommendations on whether to buy, hold, or sell a particular stock. The professionals working in brokerage firms which sell analysis reports to investors are called sell-side analysts. Professionals working for mutual funds or hedge funds and who make direct investment decisions are called buy-side analysts.

Read an interesting interview with an industry expert who shares his experience of working in the industry.

Me and Finance

I had gotten enrolled in ESSEC’s GBBA in 2017 owing to my curiosity in finance and the university’s premier status, especially in finance. At the end of the first year, I had the opportunity to apply my mind and practically learn a few things along with it. It had always been my mission to work in finance, particularly in valuation. My fascination with valuation is simple – you are allowed to deem the situation as you see fit provided you have a logical reasoning behind it. Nothing can narrow the scope of your thoughts as long as they are realistic and reasonable. It is a great way for individuals to look at things from a broader perspective and develop an analytical mindset to help comprehend several moving parts simultaneously. It does take time getting used to the idea of having to dig into minute details but it’s worth it! Valuation is not purely science per se. It is a blend between sound analytical reasoning that helps you come up with a story (forecast as experts call it) and simple objective mathematics to help validate your story’s credibility. The fact that valuation today in investment banking and other fields looks so complicated is partly to mask the simplicity involved in the process so big banks can continue to charge hefty fees for what they do. Moreover, it is not a skill that will ever go in vain. The mindset a sound valuer develops helps him/her analyze the pros and cons any situation better than a counterpart. It is a skill that I recommend everyone to acquire.

My internship in Kotak Securities

In 2018, at the end of my first year of my GBBA at ESSEC Business School, I did an internship at Kotak Securities equity research division in Mumbai, India. I was 18 years old and comparatively new to equity research. Resulting, I witnessed a steep learning curve requiring me to learn and apply several concepts in a short span of time. My main responsibility was to help the fundamental research team carry out due diligence (financial analysis to analyse the true or intrinsic value of an asset and all other factors affecting this value) for the companies under our coverage universe. This was done by performing rigorous research for the company’s business, its supply chain, its value drivers and all other factors that affect its value and ultimately its stock price. The conclusions were to be presented to the senior management and the sales team along with a thorough explanation behind the rationale of selecting a particular stock for client recommendation. Based on the findings, recommendations were to be published in a bi-monthly analysis report which also included other important topics like the economic analysis of the current situation and trends in the currencies traded in foreign exchange (FX) market. As the organization was agile and flexible with what responsibilities members could take, I had the opportunity of working with several other departments aside from fundamental research. Some of the other projects I worked on were developing a proprietary algorithm based on analysis of trading patterns for index companies alongside the technical analysis team (which is the motivation for me in selecting the SimTrade course) and a model project on sentiment analysis – how news and company perception (especially on Twitter) affect the stock price in the short run. I learnt several hard skills such as modelling in Excel, literacy in reading company’s financial statements and intermediate level of coding in Python. Overall, it was a great work experience for me.

Key takeaways from my internship

During my time at Kotak, I have come across some important financial concepts that I believe every individual, irrespective of their affiliation with the finance industry, must truly understand. They will help you better understand financial issues and make sound investment decisions.

Inflation

Inflation refers to the sustained increase in the price of goods and services in an economy. This increase in price is hard to pinpoint at any one factor but more often than not, it is a combination of various factors. This could range from increase in labor prices to jump in raw material costs. As prices rise due to inflation, you’ll be able to afford less and less over a given period of time. That’s why it is imperative to understand that long-term savings must be invested in a manner by which the returns surpass the inflation rate. That’s the only way one can continue to afford to buy more in a definite time period in the future. In many countries, the only reliable way to beat inflation is investing in stocks/equities. As Bonds or Bank savings do not offer any positive real interest realization.

Diversification

Diversification is a risk management strategy that mixes a wide variety of investments within a portfolio. A diversified portfolio contains a mix of distinct asset types and investment vehicles in an attempt at limiting exposure to any single asset or risk. The rationale behind this technique is that a portfolio constructed of different kinds of assets will, on average, yield higher long-term returns and lower the risk of any individual holding or security. This is a widely approved method for protecting capital against unexpected events in the global markets. By using the primary study of correlation, investors can diversify certain risk away. However, data on correlation is historical and thus, backwards looking, and might not always hold true in the future. For instance, during the shutdown of the global economy in March 2020, multiple assets like stocks, commodities and bitcoin (which have not been positively correlated in the past) collapsed together. All have had a positive recovery together since (again implying positive correlation as opposed to results from previous studies).

Time Value of Money

The time value of money (TVM) is the concept that money you have now is worth more than the identical sum in the future due to its potential earning capacity. This core principle of finance holds that provided money can earn interest, any amount of money is worth more the sooner it is received. For instance, assume a sum of $10,000 is invested for one year at 10% interest. The future value (FV) of that money is: FV = $10,000 x (1 + 10%) = $11,000. The formula can also be rearranged (reversed) to find the value of the future sum in present day dollars. For example, the present value (PV) of $5,000 one year from today, compounded at 7% interest, is: PV = $5,000 / (1 + 7% ) = $4,673.

TVM is also sometimes referred to as present discounted value. This is a fundamental pillar on which company valuation is based. The true value of a company is the future free cash flows the company generates, discounted to the present time using an appropriate discount factor.

Future of equity research: my personal view

Equity research is an important role that has come into prominence since the bull market in the 1950s. Thousands of fund managers handling trillions of dollars in assets under management often use sell-side research to get an outsider’s opinion before making investment decisions. Certainly, the size of the industry has shrunk significantly since buy-side and IB analysts are being better compensated, causing a shift in the workforce. However, things are not bad. Companies are now letting analysts focus more on analysis than on sales. This is certainly going to attract new talents who want to focus purely on analysis.

Read this interesting counter-view on the future of the industry.

Relevance to SimTrade

This course helps in understanding the other side of the same coin – technical analysis (using price movements and other factors to predict the future of a security). Participants of this course can expect to gain practical knowledge about stock trading by using a real-world like simulator where multiple strategies can be applied and tested. Other benefits include gaining a broad understanding of the financial markets and concepts.

Related posts on the SimTrade blog

   ▶ All posts about Professional experiences

   ▶ Louis DETALLE My experience as a Transaction Services intern at EY

   ▶ Aastha DAS My experience as an investment banking analyst at G2 Capital Advisors

   ▶ Basma ISSADIK My experience as an M&A/TS intern at Deloitte

Useful resources

Kotak Securities

Corporate Finance Institute Example of equity research report

About the author

The article was written by Tanmay DAGA (ESSEC Business School, Global Bachelor of Business Administration, 2017-2021).

Introduction to bonds

Introduction to bonds

Rodolphe Chollat-Namy

In this article, Rodolphe CHOLLAT-NAMY (ESSEC Business School, Grande Ecole Program – Master in Management, 2019-2023) introduces you to bonds.

While the bond market is growing fast and is worth about $115,000 billion as of 2021, in the following series of articles we will try to understand what it is all about. It is therefore appropriate here, firstly, to try to define what a bond is.

What is a bond?

A bond is a debt security, i.e. a tradable financial asset, that represents a loan made by an investor to a borrower. It allows the issuer to finance its investment projects and the creditor to receive interest payments at regular intervals until maturity when it is repaid the nominal amount. Creditors of the issuer are also known as debt holders.
Bonds are fixed-income securities because you know from the debt contract the exact amount of cash you can expect in the future, provided you hold the security until maturity.

What are the main characteristics of a bond?

A bond has several characteristics:

  • The face value, also known as the par value or principal, equal to the original capital borrowed by the bond issuer divided by the number of securities issued.
  • The maturity, which expresses the number of years to wait for the principal to be repaid. This is the life of the bond. The average maturity of a bond is ten years.
  • The coupon, that refers to the payment of interest to the creditor at regular intervals. The interest rate paid may be fixed or variable. It is the creditor’s remuneration for the risk taken as a bondholder. The higher the risk, the higher the return, the coupon, will be.

Example

Let us take the example of a company needs to borrow ten million euros in the bond market.

It decides to issue fixed-rate bonds. It divides this issuance into 1,000 shares of €10,000. The face value of each bond is therefore €10,000. The nominal interest rate is set at 5%. Interest payments are made on an annual basis. The annual coupon is then equal to €500 (=0.05*10,000). The maturity of the bond is set at 10 years.

In terms of cash flows, you will receive €500 per year for ten years. At the end of the tenth year, the issuer will pay you a final installment of €10,000 in addition to the interest payment of €500.

What are the different types of bonds?

The bonds issued can be diverse. Their maturity, interest rate and repayment terms vary. In order to better understand them, we must first distinguish their issuer and then the terms of payment of interest.

Types of issuers

There are three main types of issuers: governments, local authorities, and companies.

Government bonds

A government bond represents a debt that is issued by a government and sold to investors to support government spending. They are considered low-risk investments since the government backs them. So, because of their relative low risk, they are typically pay low interest rates. Country that issues bonds use different terms for them. UK government bonds, for example, are referred to as gilts. In the US, they are referred to as treasuries: T-bills (expire in less than one year), T-notes (expire in one to ten years) and T-bonds (expire in more than ten years).

Municipal bonds (“munis”)

A municipal bond represents a debt that is issued by a local authority (a state, a municipality, or a county) to finance public projects like roads, schools and other infrastructure. Interest paid on municipal bonds is often tax-free, making them an attractive investment option. Because of this tax advantage and of the backing by their issuer, they are also pay low interest rates.

Corporate bonds

A corporate bond represents a debt that is issued by a company in order for it to raise financing for a variety of reasons such as ongoing operations (organic growth) or to expand business (mergers and acquisitions). They have a maturity of at least one year, otherwise they are referred to as commercial paper. They offer higher yields than government or local authority bonds because they carry a higher risk. The more fragile the company is, the higher the return offered to the investor is. They are divided into two main categories High Grade (also called Investment Grade) and High Yield (also called Non-Investment Grade, Speculative Grade, or Junk Bonds) according to their credit rating reflecting the firm financial situation.

Technical characteristics

In addition, the way in which interest is paid may vary from one bond to another. For this purpose, there are several types of bonds:

Fixed-rate bonds

A fixed-rate bond is a bond with a fixed interest rate that entitles the holder to receive interest payments at a predetermined frequency. The interest rate is set when the bond is issued and remains the same throughout the life of the bond. This is the most common type of bond.

Floating-rate notes

A floating-rate note is a bond with an interest rate that changes according to market conditions. The contract of issuance fixes a specific reference serving as a basis for the calculation of the remuneration. For example, the most common references for European bonds are Eonia and Euribor.

Zero-coupon bonds

A zero-coupon bond is a bond that does not pay regular interest. They are therefore sold at a lower price than the value redeemed at maturity by the issuer. This difference represents the investor’s return.

Convertible bonds

A convertible bond is a bond with a conversion right that allows the holder to exchange the bond for shares in the issuing company, the two parties having previously fixed a conversion ratio which defines the number of shares to which the bond gives right.

Useful resources

Rating agencies

S&P

Moody’s

Fitch Rating

Related posts

   ▶ Rodolphe CHOLLAT-NAMY Bond valuation

   ▶ Rodolphe CHOLLAT-NAMY Bond risks

   ▶ Rodolphe CHOLLAT-NAMY Bond markets

   ▶ Bijal GANDHI Credit Rating

   ▶ Jayati WALIA Credit risk

About the author

Article written in April 2021 by Rodolphe CHOLLAT-NAMY (ESSEC Business School, Grande Ecole Program – Master in Management, 2019-2023).

Leading and Lagging Indicators

Leading and lagging indicators

Bijal GANDHI

In this article, Bijal GANDHI (ESSEC Business School, Grande Ecole Program – Master in Management, 2019-2022) elaborates on the concept of leading and lagging indicators. This reading will help you understand in detail the meaning of the leading and lagging indicators.

Leading indicators

Indicators that precede economic events and help predict the direction of an economy are termed as “leading indicators”. These indicators prove to be critical when the economy is heading from one stage to another in the business cycle. A single indicator may or may not be accurate to forecast the health of the economy. Therefore, these indicators are analyzed in conjunction through a composite index to predict the trend. In this post we deal with the U.S. case.

Composite index of leading indicators

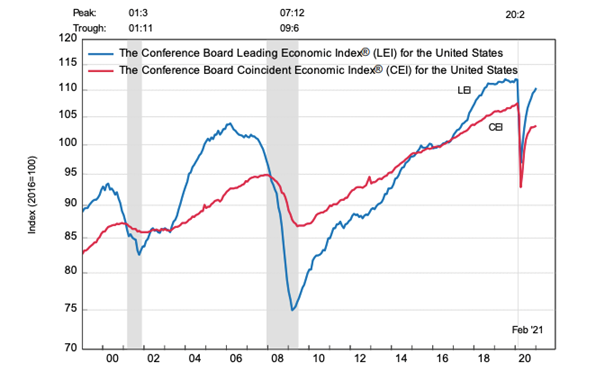
The Composite Index of Leading Indicators is published monthly by The Conference Board to help market participants (traders, investors, financial analysts, central bankers, etc.) gauge the overall direction of the economy in the near-term future. It is a comprehensive index calculated with leading indicators based on their impact on the economy. This index is also known as the Leading Economic Index (LEI) in the U.S., and it comprises ten components detailed below.

The following is a snapshot of the LEI and the CEI for the United States. CEI refers to the coincident economic index which is based on the coincident indicators. Economic indicators that describe the current state of the economy within a particular segment (such as the job market or the market for goods and services), are termed “coincident indicators”. Coincident indicators move simultaneously along the changes in business cycles of the economy. Here we can see that the LEI increased for the month of February. The CEI also increased, following the LEI.

Bijal Gandhi
Source: The Conference Board.

Yield curve

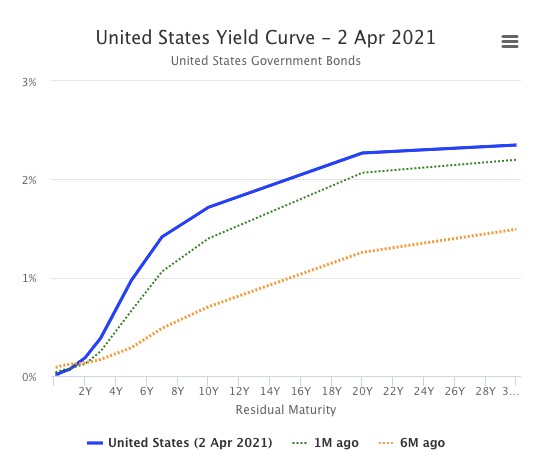
Daily yields compare the return on short-term investment instruments like Treasury bills to long-term instruments like Treasury bonds. Generally, in the yield curve, the yields over the short term are lower than those over the long-term. When the yield curve inverts, it is a signal that the investors are expecting uncertainty over the long term. This may also be an indicator of a downturn in the economy or a recession.

Source: worldgovernmentbonds

Credit spreads

Credit Spread refers to the difference in yield between a risk-free instrument and a corporate bond over the same maturity. Credit spreads fluctuations are caused due to changes in other economic indicators like inflation, liquidity, etc. A widening credit spread would reflect investor concern and vice versa.

Stock market

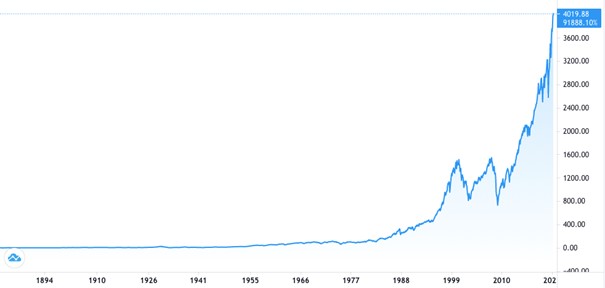
The stock market is a leading indicator as stock prices are highly dependent on the future growth and expected earnings of companies. Investors may sell their stocks if they are not confident about the future of the company. The S&P 500 stock index for the U.S. is a close estimation of the total value of the business sector and therefore it is used to comprise the LEI.


Source: TradingView.

Durable goods orders

Durable Goods Manufactures’ report refers to the total capital goods purchased by companies. An increase in the volume of purchases is an indication that companies are confident about the future. It is classified under the leading indicator as business orders change much before an actual change in the business cycle.

Manufacturing jobs

The manufacturing jobs survey is also classified as a leading indicator as to the demand for labor shifts much before an actual change in the business cycle. If the demand for goods is anticipated to increase the supervisors may ask for a greater labor supply indicating a positive sign for the economy. A change in demand for labor will also impact other dependent sectors like transportation and retail.

Building permits

Building permit numbers are published monthly by the U.S. census which tells us in advance about the expected spending on construction-related projects. We all know the importance of the real estate sector on the economy from the subprime mortgage crisis in 2008.

Unemployment claims

The weekly claims for unemployment insurance help the government calculate the total layoffs and publish a report. This report is an indication of the changes in unemployment levels, business activities, and their impact on consumer income.

Manufacturing new orders

The Manufacturing New Orders Index published by the Institute of Supply Management (ISM) is calculated from the survey of purchasing manufacturers of hundreds of manufacturing firms. It indicates the change (increase or decrease) of orders of manufactured goods.

Consumer expectations

Consumer expectations is a survey conducted to gain insights from the end-users themselves. The surveyors ask the consumers about their opinions regarding jobs, income, and overall business conditions. They try to gauge the consumer sentiment for the next 6 to 12 months.

Leading Credit Index

This component is derived from six other financial indicators. All these financial indicators are forward looking such as 2 years swap spreads, security repurchases, investor’s sentiments, etc.

Lagging indicators

Lagging indicators are those economic indicators that lag the economic performance of a geographic region. Therefore, these indicators are not useful to predict the future health of the economy but to assess and confirm a pattern after a large movement in an underlying economic variable of interest like the unemployment rate. Since these indicators trail the shifts in the underlying variable, they are useful to analyze long-term trends in the economy. They are further categorized into economic, technical, and business indicators as per their use.

Composite index of lagging indicators

As discussed in the blog Economic Indicators, the Composite Index of Lagging Indicators is published monthly by the Conference Board. This Index includes the following seven components which help assess and confirm the economic situation of the U.S.

Average duration of unemployment

The Bureau of Labor Statistics computes the average number of weeks an individual has been unemployed. During a recession, long-term unemployment rises and vice versa.

Ratio, manufacturing, and trade inventories to sales

The Bureau of economic analysis computes the ratio of inventories to sales to understand the business conditions of both the individual firm and the industry. The inventory and sales data related to the manufacturing, wholesale, and retail is provided by the Bureau of the Census. When sales targets are not reached due to a weak economy, the inventories tend to shoot up and the ratio reaches its cyclical peak in the middle of a recession.

Change in labor cost per unit of output, manufacturing

The Conference Board computes the rate at which the labor costs per unit rise with respect to the cost of production per unit. During a weakening state of the economy, the production declines at a much higher rate than the labor costs even with layoffs of the laborers. This series is calculated over six months as monthly data can tend to be inconsistent.

Average prime rate charged by banks

The prime rate is the benchmark rate which banks use to estimate their interest rates for various types of loans. The change in this rate usually tends to lag the general economic performance. During periods of a strengthening economy, banks tend to resist reducing the interest rates, while during times of a weak economy, banks tend to resist increasing the interest rates.

Commercial and industrial loans outstanding

The total volume of outstanding business loans held by both banks and non-financial companies is computed by The Conference Board from the data compiled by the Board of Governors of the Federal Reserve System. When the revenues or profits decline in a business due to the weakening of the economy, banks start to take out more loans to cover their costs. Similarly, an improvement in the economy will result in liquidity and the demand for short-term credit may fall if the deflation sets in.

Ratio, consumer installment credit outstanding to personal income

This is the ratio of consumer debt to personal income. This ratio is a measurement of the indebtedness relative to income. This ratio tends to increase during times of expansion when the consumers are confident enough to pay off their debts in the future. Similarly, they tend to hold off borrowing even until after the months of recession due to skepticism and uncertainty.

Change in Consumer Price Index for services

The Bureau of Labor Statistics computes the rate of change in the services component of the Consumer Price Index (CPI). This is a lagging indicator as the services sector may raise prices well in advance in anticipation of a recession. The rise in prices may be due to market rigidities and recognition lag. Even with the recovery, firms in the services sector may keep cutting the prices. This is because they might not recognize when the recession is over.

Related posts on the SimTrade blog

   ▶ Bijal GANDHI Economic indicators

   ▶ Bijal GANDHI Gross Domestic Product (GDP)

Useful resources

US Department of Treasury

United States Census Bureau

Labor Statistics

About the author

Article written by Bijal GANDHI (ESSEC Business School, Grande Ecole Program – Master in Management, 2019-2022).

Economist – Job description

Economist – Job Description

Akshit Gupta

This article written by Akshit Gupta (ESSEC Business School, Master in Management, 2019-2022) presents the job description of an Economist.

Introduction

Economists are finance professionals who study and examine market activities in different geographical zones, economic sectors, and industries. They are primarily hired by commercial and investment banks, asset management firms, rating agencies, consultancy firms, central banks and other state agencies. In such institutions, economists are responsible for analyzing market and socioeconomic trends, devising statistical models to predict future trends (economic forecasting) and preparing economic reports.

In commercial banks, the work of economists will be used to manage credit risk and to prevent corporate credit default. In investment banks, economists will help traders to anticipate the economic events during the day like the publication of an economic indicator (inflation, GDP, unemployment, etc.). In asset management firms, economists will help portfolio managers to optimize their portfolios based on the current economic conditions and future scenarios. In other contexts, economists work on studying and assessing the economic situation to support investment decisions.

Duties of an economist

More specifically, the important duties of an economist include the following:

  • Analyze economic and market trends – An economist is responsible for researching, collecting data, and analyzing information pertaining to socio-economic, financial, political and market trends in different geographies and sectors.
  • Develop economic models – After analyzing the different trends, an economist is responsible for making econometric models to compute the numerical impact of different trends and make future predictions.
  • Prepare economic reports – The economist is responsible for preparing economic reports based on the statistical analysis to present technical insights about an economic situation. The reports are used to advise banks, investment firms, government agencies to take calculated investment decisions.
  • Communicate data – The reports prepared by the economists are effectively communicated by them to banks or agencies by ways of presentations, media releases or publication in journals.

Whom does an economist work with?

An economist depending in the sector he/she is employed in, works in tandem with many internal and external stakeholders including:

  • Retail or institutional clients of the firm – A economist works with the retail or institutional clients of the firm to communicate the different economic or market trends and policies.
  • Sales and Trading – An economist works with the sales and trading team to advise them on the investment decisions across sectors and geographies based on the economic reports.
  • Sector specialists – An economist works with the sector specialists to assess and quantify the economic opportunities and risks posed by different sectors and industries
  • Portfolio managers – An economist works with portfolio managers to advise and help them optimize their portfolios as per the current economic and market trends.
  • Legal compliance – To maintain a proper check over different rules and regulations and prevent legal challenges
  • Media – To give insights from technical and non-technical economic reports about different sectors and present future forecasts

How much does an economist earn?

The remuneration of an economist depends on the type of role and organization he/she is working in. As of the writing of this article, an entry level economist working in an investment bank earns a base salary between €40,000–50,000 in the initial years of joining. The economist also avails bonuses and other monetary/non-monetary benefits depending on the firm he/she works at. (Source: Glassdoor)

What training do you need to become an economist?

An individual working as a economist is expected to have a strong base in economics and mathematics (statistics, econometrics). He/she should be able to understand micro and macro-economic trends, devise different mathematical models, prepare reports and have strong research skills and interpersonal skills.

In France, a Grand Ecole diploma with a specialization in economics/mathematics is highly recommended to get an entry level economist position in a reputed bank, government agency or investment firm.

A bachelor degree coupled with an master degree in economics provides a candidate with an edge over the other applicants while hunting for a job.

In terms of technical skills, an economist should be efficient in using word processing, spreadsheet, presentation tool, and possess good understanding of database management and programming languages like VBA, R, Python, Mathlab, etc.

Example of an economist’s report – BNP Paribas

BNP Paribas – Economic Research Report

Related posts on the SimTrade blog

   ▶ Akshit GUPTA Remuneration in the finance industry

   ▶ Akshit GUPTA Trader: Job Description

   ▶ Akshit GUPTA Financial Analyst: Job Description

Useful Resources

All About Careers

Relevance to the SimTrade certificate

The concepts about the job of an economist can be understood in the SimTrade Certificate:

About theory

  • By taking the Market information course, you will understand how information is incorporated into market prices and the associated concept of market efficiency.

Take SimTrade courses

About practice

  • By launching the Efficient market simulation, you will practice how information is incorporated into market prices through the trading of market participants and grasp the concept of market efficiency.

Take SimTrade courses

About the author

Article written by Akshit Gupta (ESSEC Business School, Master in Management, 2019-2022).

Is smart beta really smart?

Is smart beta really smart?

Youssef LOURAOUI

In this article, Youssef LOURAOUI (ESSEC Business School, Global Bachelor of Business Administration, 2017-2021) presents the concept of smart beta used in the asset management industry.

Mutual funds and Exchange traded funds (ETF) based on the smart beta approach have increased in size during the recent years. As Burton Malkiel (2014), we also wonder if the smart beta approach is really smart.

The smart beta industry

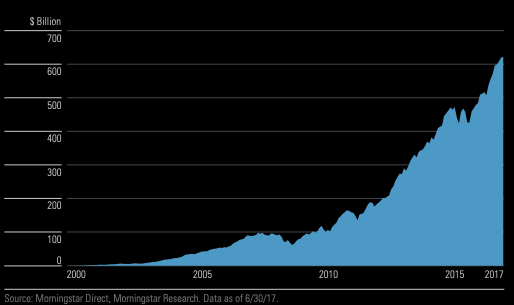
Smart beta funds have experienced a significant growth with total assets under management approaching market 620 billion dollar in the U.S. as shown in Figure 1 (Morningstar Reseach, 2017).

Figure 1. Smart Beta Exchange Traded Products growth in the US market (2000-2017).
Smart Beta Exchange Traded Products growth
Source: Morningstar Research (2017).

Traditional approach in portfolio management

The traditional approach to build asset portfolio is to define asset weights based on the market capitalization. The framework of this traditional approach is based on the Capital Asset Pricing Model (CAPM) introduced by the work of Henry Markowitz and William Sharpe in 1964. The CAPM is based on a set of hypotheses about the market structure and investors:

  • No intermediaries
  • No constraints (possibility of short selling)
  • Supply and demand equilibrium
  • Inexistence of transaction cost
  • Investors seeks to maximise its portfolio value by optimizing the mean associated with expected returns while minimizing variance associated with risk
  • Investors are considered as “rational” with a risk averse profile
  • Investors have access to the information simultaneously in order to execute their investment ideas

Under this framework, Markowitz developed a model relating the expected return of a given asset and its risk:

Relation between expected return and risk

where E(r) represents the expected return of the asset, rf the risk-free rate, β a measure of the risk of the asset and E(rm) the expected return of the market.

In this model, the beta (β) parameter is a key parameter and is defined as:

Beta

where Cov(r,rm) represents the covariance of the asset with the overall market, and σ(rm)2 is the variance of market return.

The beta represents the sensibility of the asset to the fluctuations of the market. This risk measure helps investors to predict the movements of their asset according to the movement of the market overall. It measures the asset volatility in comparison with the systematic risk inherent to the market. Statistically, the beta represents the slope of the line through a regression of data points between the stock returns in comparison to the market returns. It helps investors to explain how the asset moves compared to the market.

More specifically, we can consider the following cases for beta values:

  • β = 1 indicates a fluctuation between the asset and its benchmark, thus the asset tends to move in a similar rate than the market fluctuations. A passive ETF replicating an index will present a beta close to 1 with its associated index.
  • 0 < β < 1 indicates that the asset moves in a slower rate than market fluctuations. Defensive stocks, stocks that deliver consistent returns without regarding the market state like P&G or Coca Cola in the US, tend to have a beta with the market lower than 1.
  • β > 1 indicates a more aggressive effect of amplification between the asset price movements with the market movements. Call options tend to have higher betas than their underlying asset.
  • β = 0 indicates that the asset or portfolio is uncorrelated to the market. Govies, or sovereign debt bonds, tend to have a beta-neutral exposure to the market.
  • β < 0 indicates an inverse effect of market fluctuation impact in the asset volatility. In this sense, the asset would behave inversely in terms of volatility compared to the market movements. Put options and Gold typically tend to have negative betas.

In order to better monitor the performance of an actively managed fund, active fund managers seek to improve the performance of their fund compared to the market. This additional performance is measured by the “alpha” (Jensen, 1968) defined by:

Alpha Jensen

where E(r) is the average return of the fund over the period studied, rf the risk-free rate, E(rm) the expected return of the market, and β×(E(rm)-rf) represents the systematic risk of the fund.

Jensen’s alpha (α) represents the abnormal returns of the fund.

The Smart beta approach

The smart beta approach is based on the construction of a portfolio of assets using several different yield enhancement “factors”. BlackRock Investment Solutions (2021) lists the following factors mainly used in the smart beta approach:

  • Quality, which aims to study the financial environment of the underlying asset.
  • Volatility which aims to filter assets according to their risk.
  • Momentum, which aims to identify trends in the selection of assets to be retained by focusing on stocks that have performed strongly in the short term.
  • Growth is the approach that aims to select securities that have strong return expectations in the medium to long term.
  • Size which aims to classify according to the size of the assets.
  • Value that seeks to denote undervalued assets that are close to their fundamental values.

The smart beta approach is opposed to the traditional portfolio approach where a portfolio is constructed using the weights defined by the market capitalization of its assets. The smart beta approach aims to position the portfolio sensitivity or “beta” according to the market environment expectation of the asset manager. For a bull market, the fund manager will select a set of factors to achieve a pronounced exposure of his portfolio. Symmetrically, for a bear market, the fund manager will select another set of factors opting for a beta neutral approach to protect the sensitivity of his portfolio against bear market fluctuations.

Performance and impact factor

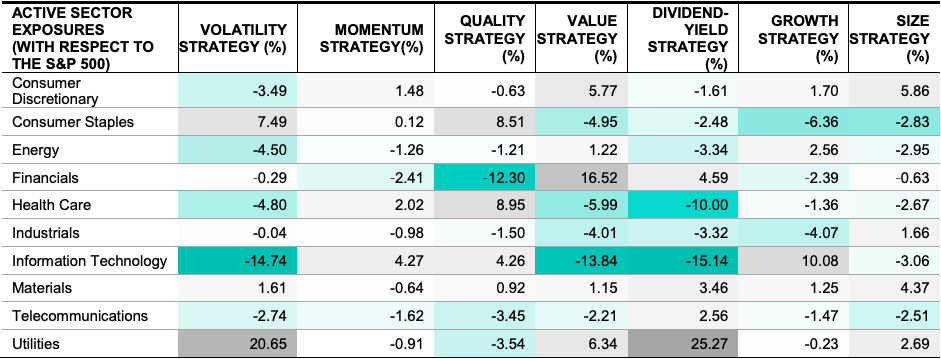
S&P Group (2016) studied the performance of different factors (volatility, momentum, quality, value, dividend yield, growth and size) on the S&P500 index for 1994-2014 broken down into sub-sectors (see Table 1). This study finds that each sector is impacted differently by choosing one factor over another. For example, in the energy sector, the strategies of value and growth has led to a positive performance with respectively 1.22% and 2.56%, while in the industrial sector, the strategies of size were the only factor with a positive performance of 1.66%. In practice, there are two approaches: focusing on a single factor or finding a combination of factors that offers the most interesting risk-adjusted return to the investor in view of his/her investment strategy.

Table 1. Sector exposures to smart beta factors (1994-2014).
Sector exposures to smart beta factors
Source: S&P Research (2014).

S&P Group (2016) also studies the performance of the factors according to the market cycles (bull, bear or recovery markets), business cycles (expansion or contraction) and investor sentiment (neutral, bullish and bearish). The study shows how each factor has been mostly effective for every market condition.

Table 2. Performance of factors according to different market cycles, business cycles and investor sentiment.
Performance of factors
Source: S&P Research (2014).

In summary, the following characteristics of the different approaches discussed in this article can be identified:

  • The CAPM approach aims to give a practical configuration of the relationship between the return of an asset with the market return as well as the return considered as risk-free.
  • Alpha is an essential metric in the calculation of the portfolio manager’s return in an actively managed fund. In this sense, alpha and CAPM are linked in the fund given the nature of the formulas used.
  • Smart beta or factor investing follows an approach that straddles the line between active and passive management where the manager of this type of fund will use factors to filter its source of return generation which differs from the common approach based on CAPM reasoning (Fidelity, 2021).
  • The conductive link of these three reasoning is closely related to the fact that historically the CAPM model has been a pillar in financial theory, the smart beta being a more recent approach that tries to disrupt the codes of the so-called market capitalization based investment by integrating factors to increase the sources of return. Alpha is related to smart beta in the sense that the manager of this type of fund will want to outperform a benchmark and therefore, alpha allows to know the nature of this out-performance of the manager compared to a benchmark.

Is smart beta really smart?

Nevertheless, the vision of this smart beta approach has raised criticisms regarding the relevance of the financial results that this strategy brings to a portfolio’s return. Malkiel (2014) questioned the smartness of smart beta and found that the performance of this new strategy is only the result of chance in the sense that the persistence of performance is dependent in large part on the market configuration.

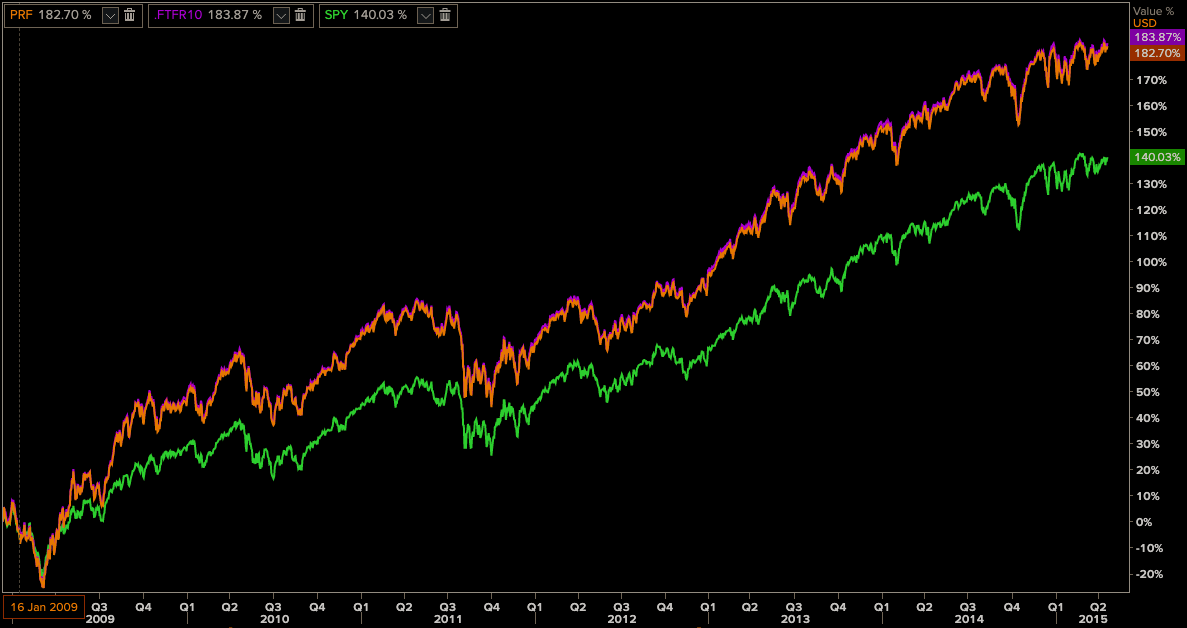
In his analysis of the performance of the smart ETF fund called FTSE RAFI over the period 2009-2014, he attributed the out-performance to luck. The portfolio allocation was highly exposed to two financial stocks, Citigroup and Bank of America, which accounted for 15% of the portfolio allocation. Note that Citigroup and Bank of America were prosecuted by the American courts for post-crisis financial events and interest rate manipulation operations related to the LIBOR scandal. This smart beta fund outperformed the passive managed US large cap ETF (SPY). Malkiel associated the asset selection of the FTSE RAFI fund with a bet on Bank of America that with another market configuration it could have ended in a sadder way.

Figure 2. FTSE RAFI ETF (orange) compared with its benchmark (FTSE RAFI US 1000) and with SPY ETF (green).
FTSE RAFI ETF
Source: Thomson Reuters Datastream.

We can conclude that the smart beta strategy can allow, as outlined in Blackrock’s research (BlackRock Investment Solutions, 2021), an opportunity to improve portfolio performance while seeking to manage variables such as portfolio out-performance, minimizing its volatility compared to the market or seeking diversification to reduce the risk of the investor’s portfolio. It is an instrument that must be taken judiciously in order to be able to affirm in fine if it is smart in the end, as Malkiel would say.

Related posts on the SimTrade blog

   ▶ Jayati WALIA Capital Asset Pricing Model (CAPM)

   ▶ Youssef LOURAOUI Beta

   ▶ Youssef LOURAOUI MSCI Factor Indexes

   ▶ Youssef LOURAOUI Factor Investing

   ▶ Youssef LOURAOUI Origin of factor investing

Useful resources

Academic articles

Malkiel, B. (2014). Is Smart Beta smart? The Journal of Portfolio Management 40, 5: 127-134

El Lamti N. (2017) Are smart beta strategies really smart? HEC Paris.

Business resources

BlackRock Investment Solutions (2021) What is Factor Investing

Fidelity (2021) Smart beta

S&P Global Research (2016) What Is in Your Smart Beta Portfolio? A Fundamental and Macroeconomic Analysis

Morningstar Research (2017) A Global Guide to Strategic-Beta Exchange-Traded Products

Fidelity (2021) Smart beta

About the author

The article in April 2021 was written by Youssef LOURAOUI (ESSEC Business School, Global Bachelor of Business Administration, 2017-2021).