In this article, Nithisha CHALLA (ESSEC Business School, Grande Ecole Program – Master in Management (MiM), 2021-2024) delves into the top five companies in the defense sector by market capitalization and provides information into their origins, latest announcements, and notable developments to provide financial professionals and students with actionable insights.
Introduction: The Global Defense Landscape
In the 2020s, the global defense industry is undergoing a period of profound and structural transformation. A confluence of escalating geopolitical tensions, rapid technological advancement, and a fundamental reassessment of national security priorities has catalyzed an unprecedented surge in military spending. In 2024, global military expenditure reached an astonishing $2.718 trillion, marking a 9.4% year-on-year increase—the steepest rise recorded since at least 1988. This marks the tenth consecutive year of rising expenditures, signaling a definitive end to the post-Cold War “peace dividend” and the dawn of a new era of sustained, high-level investment in great power competition.
This spending surge is not a monolithic trend but is driven by specific, interlocking security challenges. The protracted conflict in Ukraine has compelled NATO allies to not only replenish stockpiles of munitions and equipment but also to fundamentally modernize their forces for high-intensity conventional warfare. Concurrently, persistent instability in the Middle East and rising strategic competition in the Indo-Pacific are fueling demand for advanced capabilities across all domains. This has created a demand environment of a scale and duration not seen in decades, providing the world’s leading defense contractors with unparalleled long-term revenue visibility.
The modern technological battlefield is also evolving at a breakneck pace. The key domains driving research, development, and procurement have shifted to areas such as hypersonic weapons, artificial intelligence (AI) for command and control, cyber and electronic warfare, autonomous systems, and space-based intelligence and communications assets. These technologies represent the future of warfare and are central to the corporate strategies and investment priorities of the industry’s top firms. The defense industrial base is a unique ecosystem characterized by multi-decade program cycles, exceptionally high technological and capital barriers to entry, and a deeply symbiotic relationship with a concentrated customer base, dominated by the U.S. Department of Defense (DoD) and allied governments.
This report provides a detailed financial and strategic analysis of the five largest defense contractors in the world. These firms are ranked based on their most recent full-year defense-related revenue, the most direct and relevant metric for assessing their scale and influence within the sector. This primary ranking is augmented by an examination of total revenue, market capitalization, and crucially, the size and composition of their order backlogs, which serve as a key indicator of future financial performance.
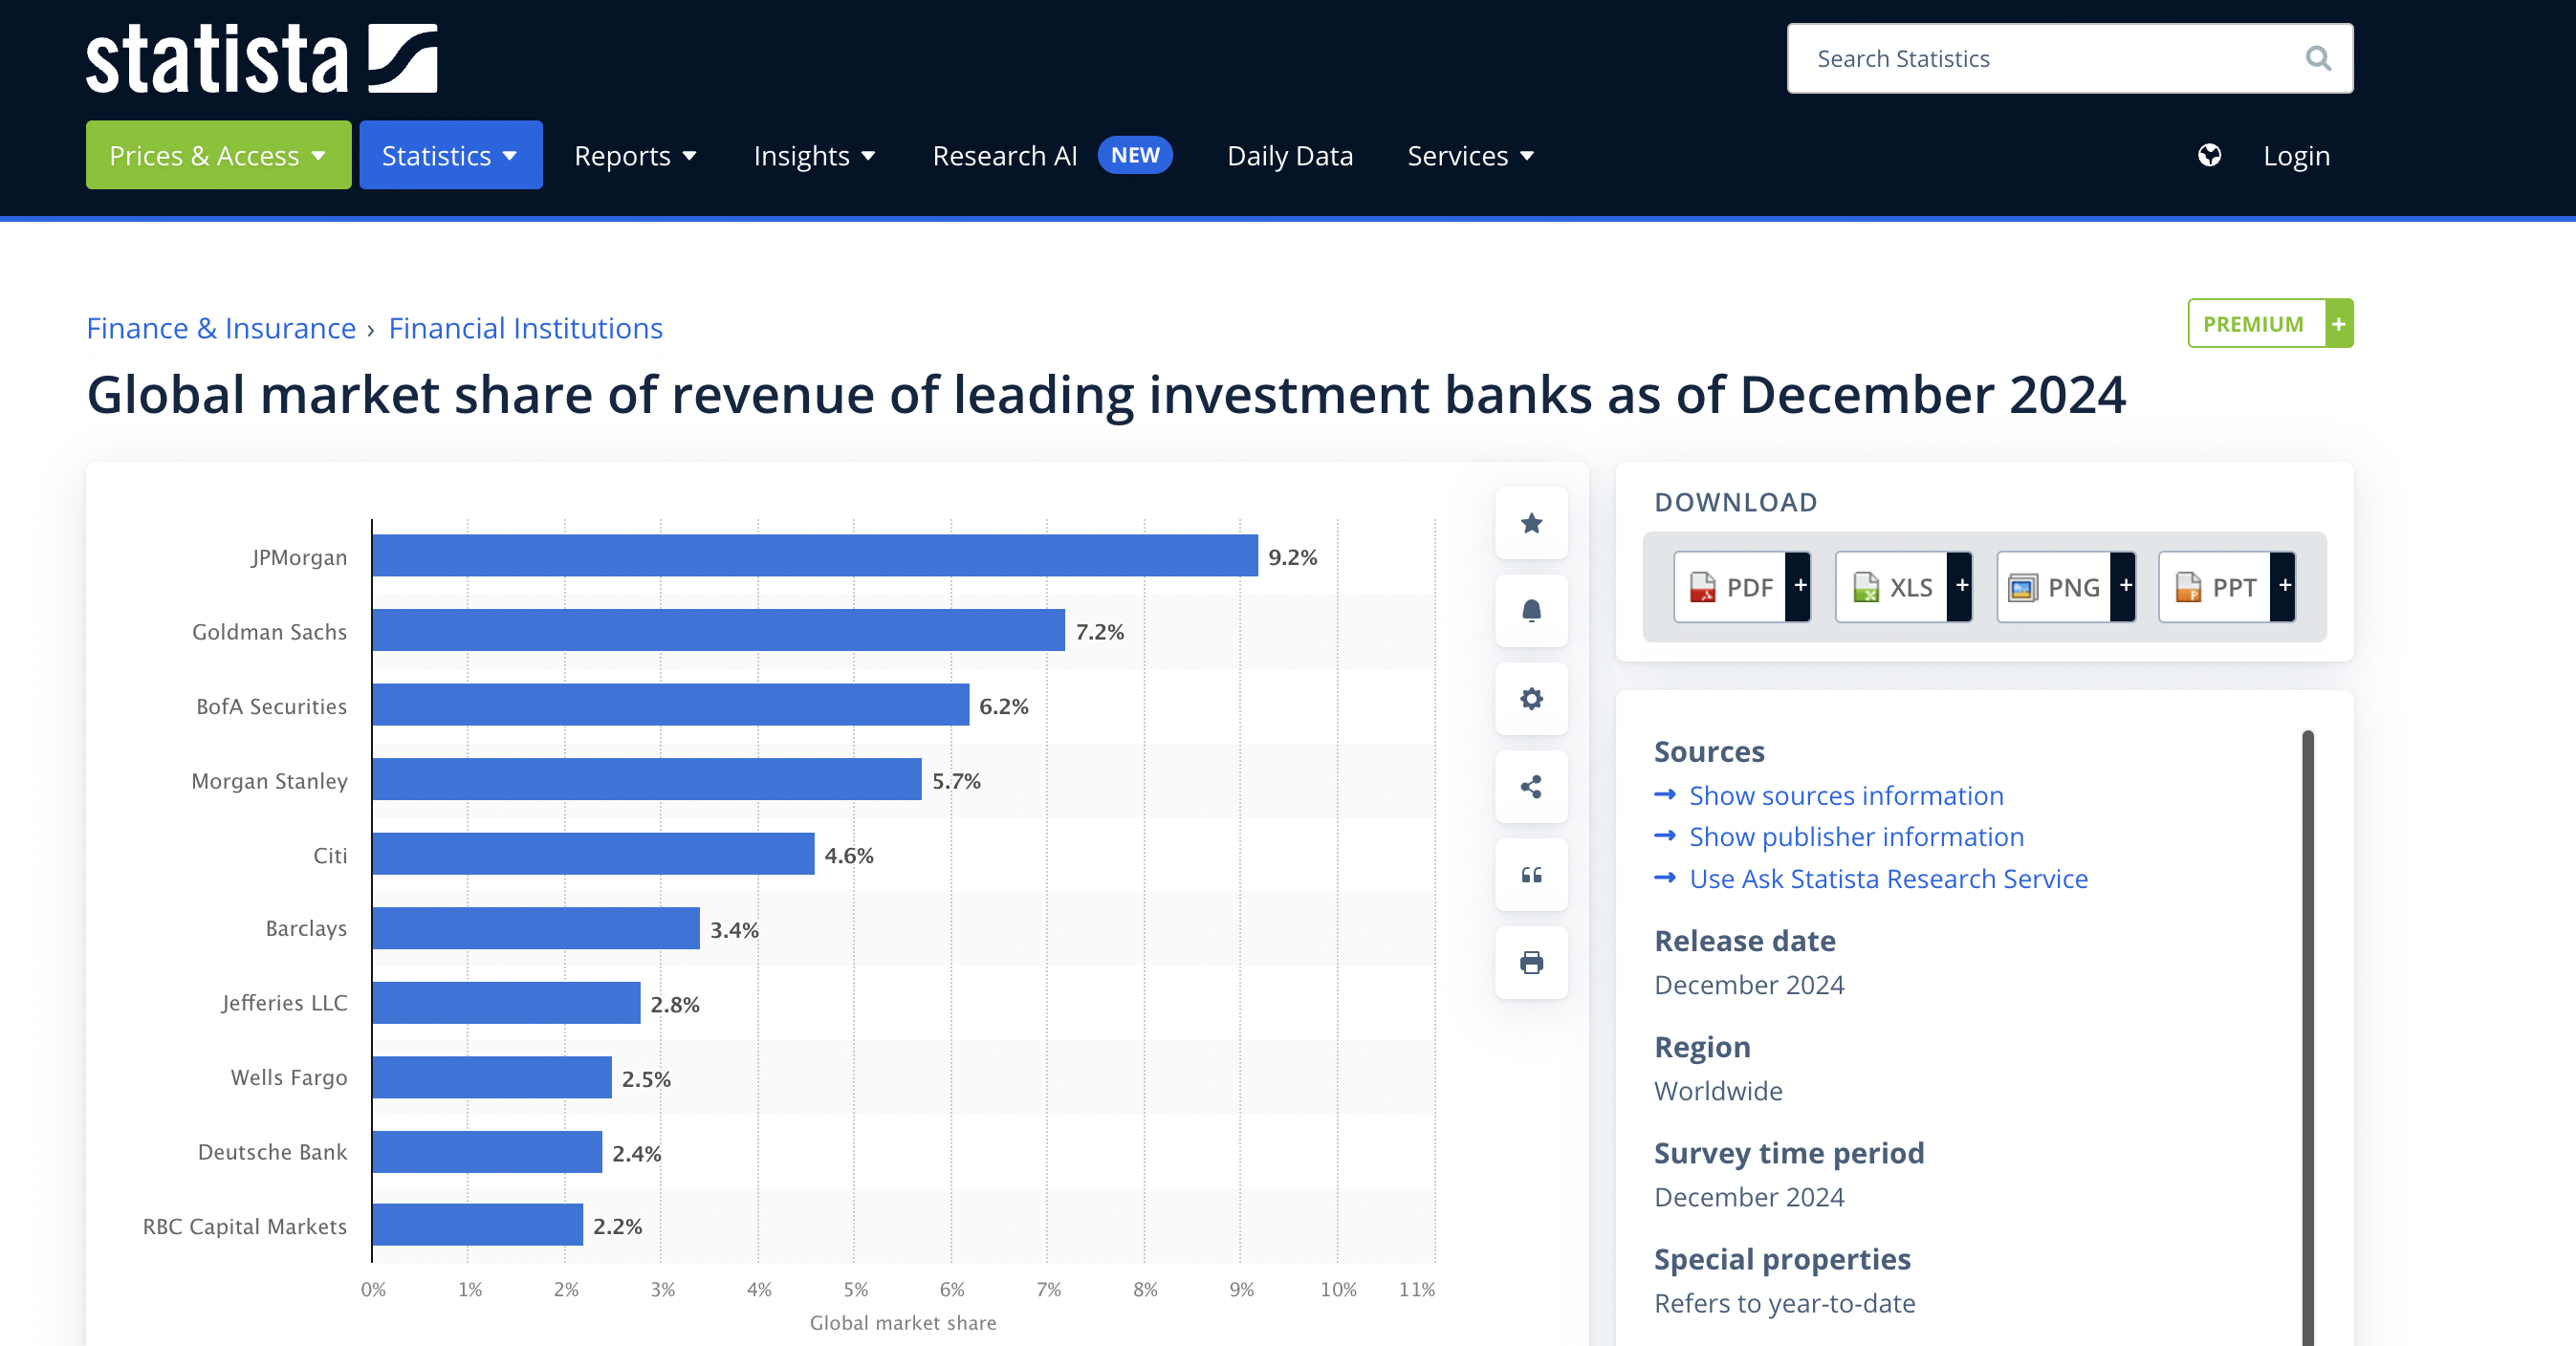
The picture below shows the world’s top 5 valuable defense companies by market capitalization (Companies Market Cap, August 2025).
World’s top 5 valuable companies by market capitalization in the defense industry
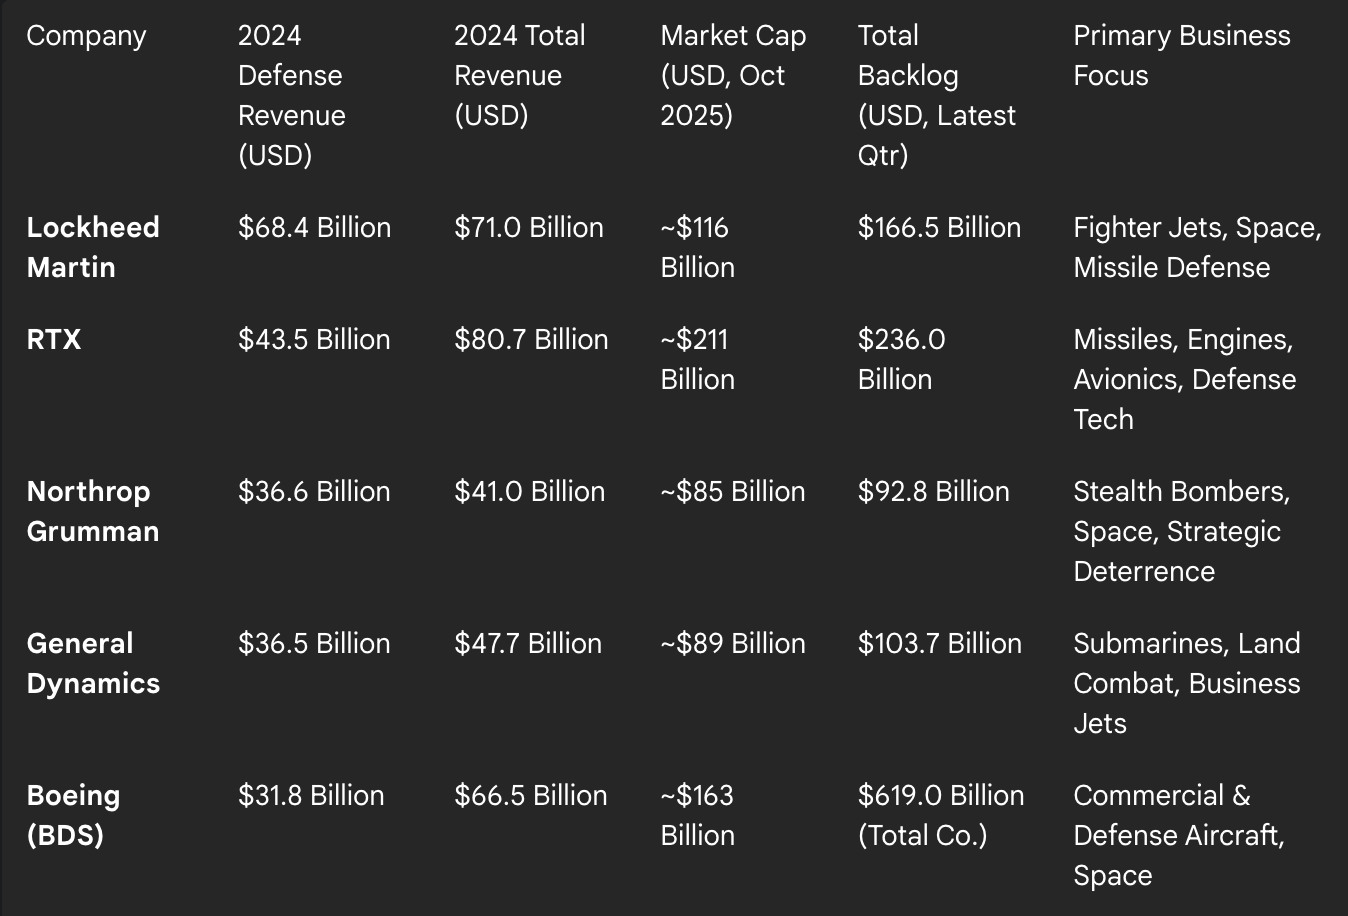
Source: Companies Market Cap.
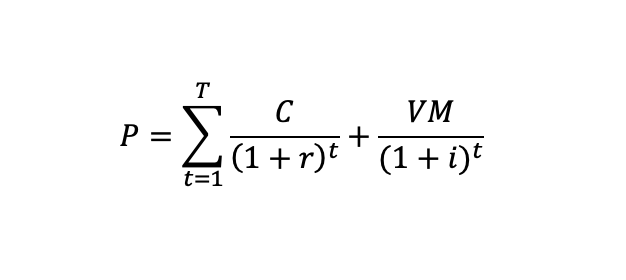
The market capitalization, commonly called a “market cap”, is the total market value of a publicly traded company’s outstanding shares and is widely used to measure how much a company is worth. In most cases, it can be easily calculated by multiplying the share price by the amount of outstanding shares.
Lockheed Martin Corporation (LMT)
Lockheed Martin Corporation is the world’s largest defense contractor, a global security and aerospace giant with a legacy of pioneering advanced military technology. The modern corporation was formed in 1995 through the merger of two of America’s largest defense firms, Lockheed Corporation and Martin Marietta, creating an entity with unparalleled scale and a comprehensive portfolio. Headquartered in Bethesda, Maryland, the company is led by Chairman, President, and CEO James D. Taiclet, a former U.S. Air Force officer who brings a deep understanding of the company’s primary customer.
Lockheed Martin’s operations are organized into four core business segments, each a leader in its respective domain: Aeronautics, Rotary and Mission Systems (RMS), Missiles and Fire Control (MFC), and Space.
- Aeronautics: This is the company’s largest segment, accounting for approximately 41% of total revenue in fiscal year 2023 with sales of $27.5 billion. It is the home of the F-35 Lightning II, the cornerstone of modern air power for the U.S. and its allies. The segment also produces the C-130 Hercules transport aircraft and houses the legendary Skunk Works® advanced development division, responsible for iconic aircraft like the U-2 and SR-71 Blackbird.
- Rotary and Mission Systems (RMS): Generating 24% of revenue ($16.2 billion), this segment includes Sikorsky helicopters, the manufacturer of the ubiquitous UH-60 Black Hawk. It is also a leader in naval systems, producing the Aegis Combat System, ship-based missile defense systems, and advanced radar technologies.
- Missiles and Fire Control (MFC): This segment, with 17% of revenue ($11.3 billion), is a premier provider of precision engagement systems. Its portfolio includes the High Mobility Artillery Rocket System (HIMARS), the Javelin anti-tank missile, and cutting-edge hypersonic weapons programs.
- Space: Accounting for 19% of revenue ($12.6 billion), the Space segment is a critical player in national security, developing and producing satellites for communications and missile warning, space transportation systems, and strategic defensive systems.
The F-35 program is the central pillar of Lockheed Martin’s financial and strategic position. It is far more than a simple product line; it represents a multi-decade, global platform that has created an entire ecosystem of revenue streams. The initial sale of each aircraft is merely the entry point into a long-term relationship that generates recurring, high-margin revenue from sustainment, software and hardware upgrades, pilot training, and spare parts for the next 30 to 50 years. As more allied nations join the F-35 program, it creates a powerful network effect, fostering interoperability and effectively locking out competitors for a generation. This transforms the F-35 from a manufacturing program into a long-term service annuity that underpins the company’s entire financial structure.
Logo of Lockheed Martin Corporation![]()
Source: the company.
Lockheed Martin’s recent financial performance reflects both the strength of its portfolio and the inherent risks of large-scale development programs. In the second quarter of 2025, the company reported sales of $18.2 billion. However, this was overshadowed by the recognition of $1.8 billion in losses on several legacy and classified programs, which prompted a downward revision of its full-year 2025 earnings per share (EPS) guidance.
Despite these challenges, the company’s future revenue is secured by an immense order backlog, which stood at a record $166.5 billion as of June 30, 2025. This massive backlog provides exceptional visibility into future sales but also highlights the company’s exposure to execution risk on complex, fixed-price development contracts. The company continues to secure major contracts, including a recent $900.5 million award for Javelin missile production and a $720 million contract for Joint Air-to-Ground Missiles (JAGM) and HELLFIRE missiles.
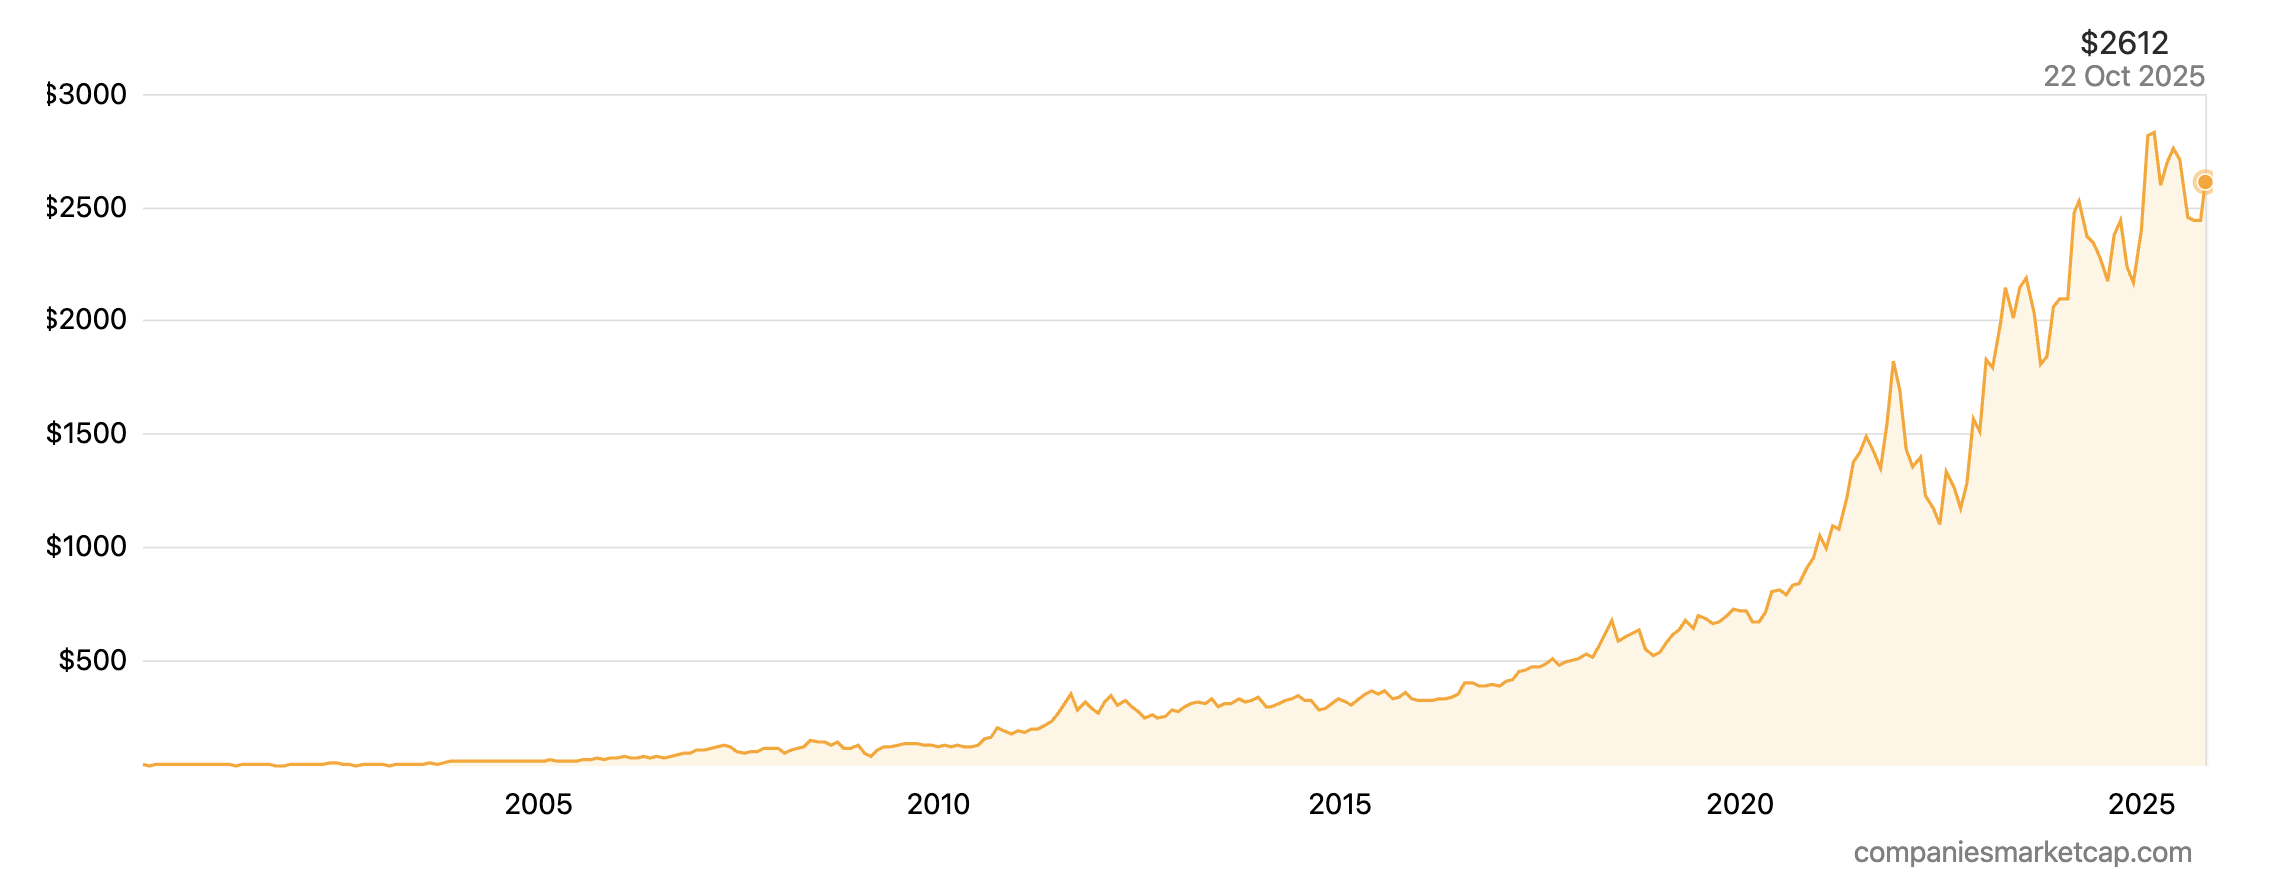
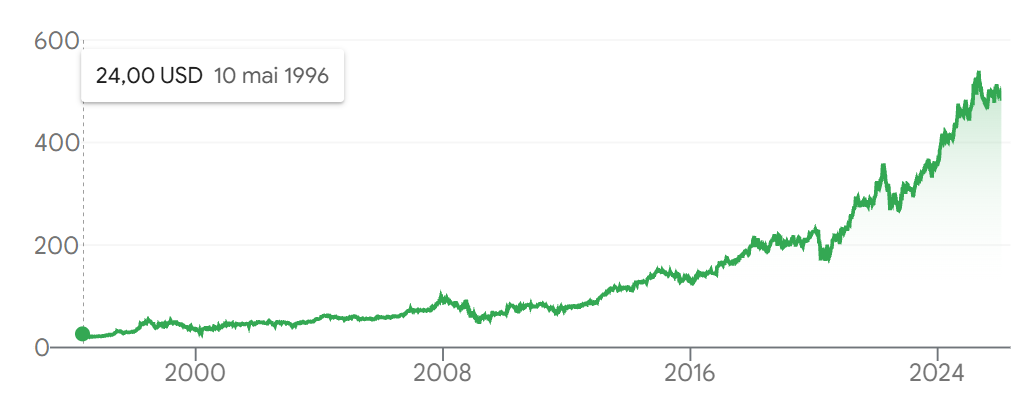
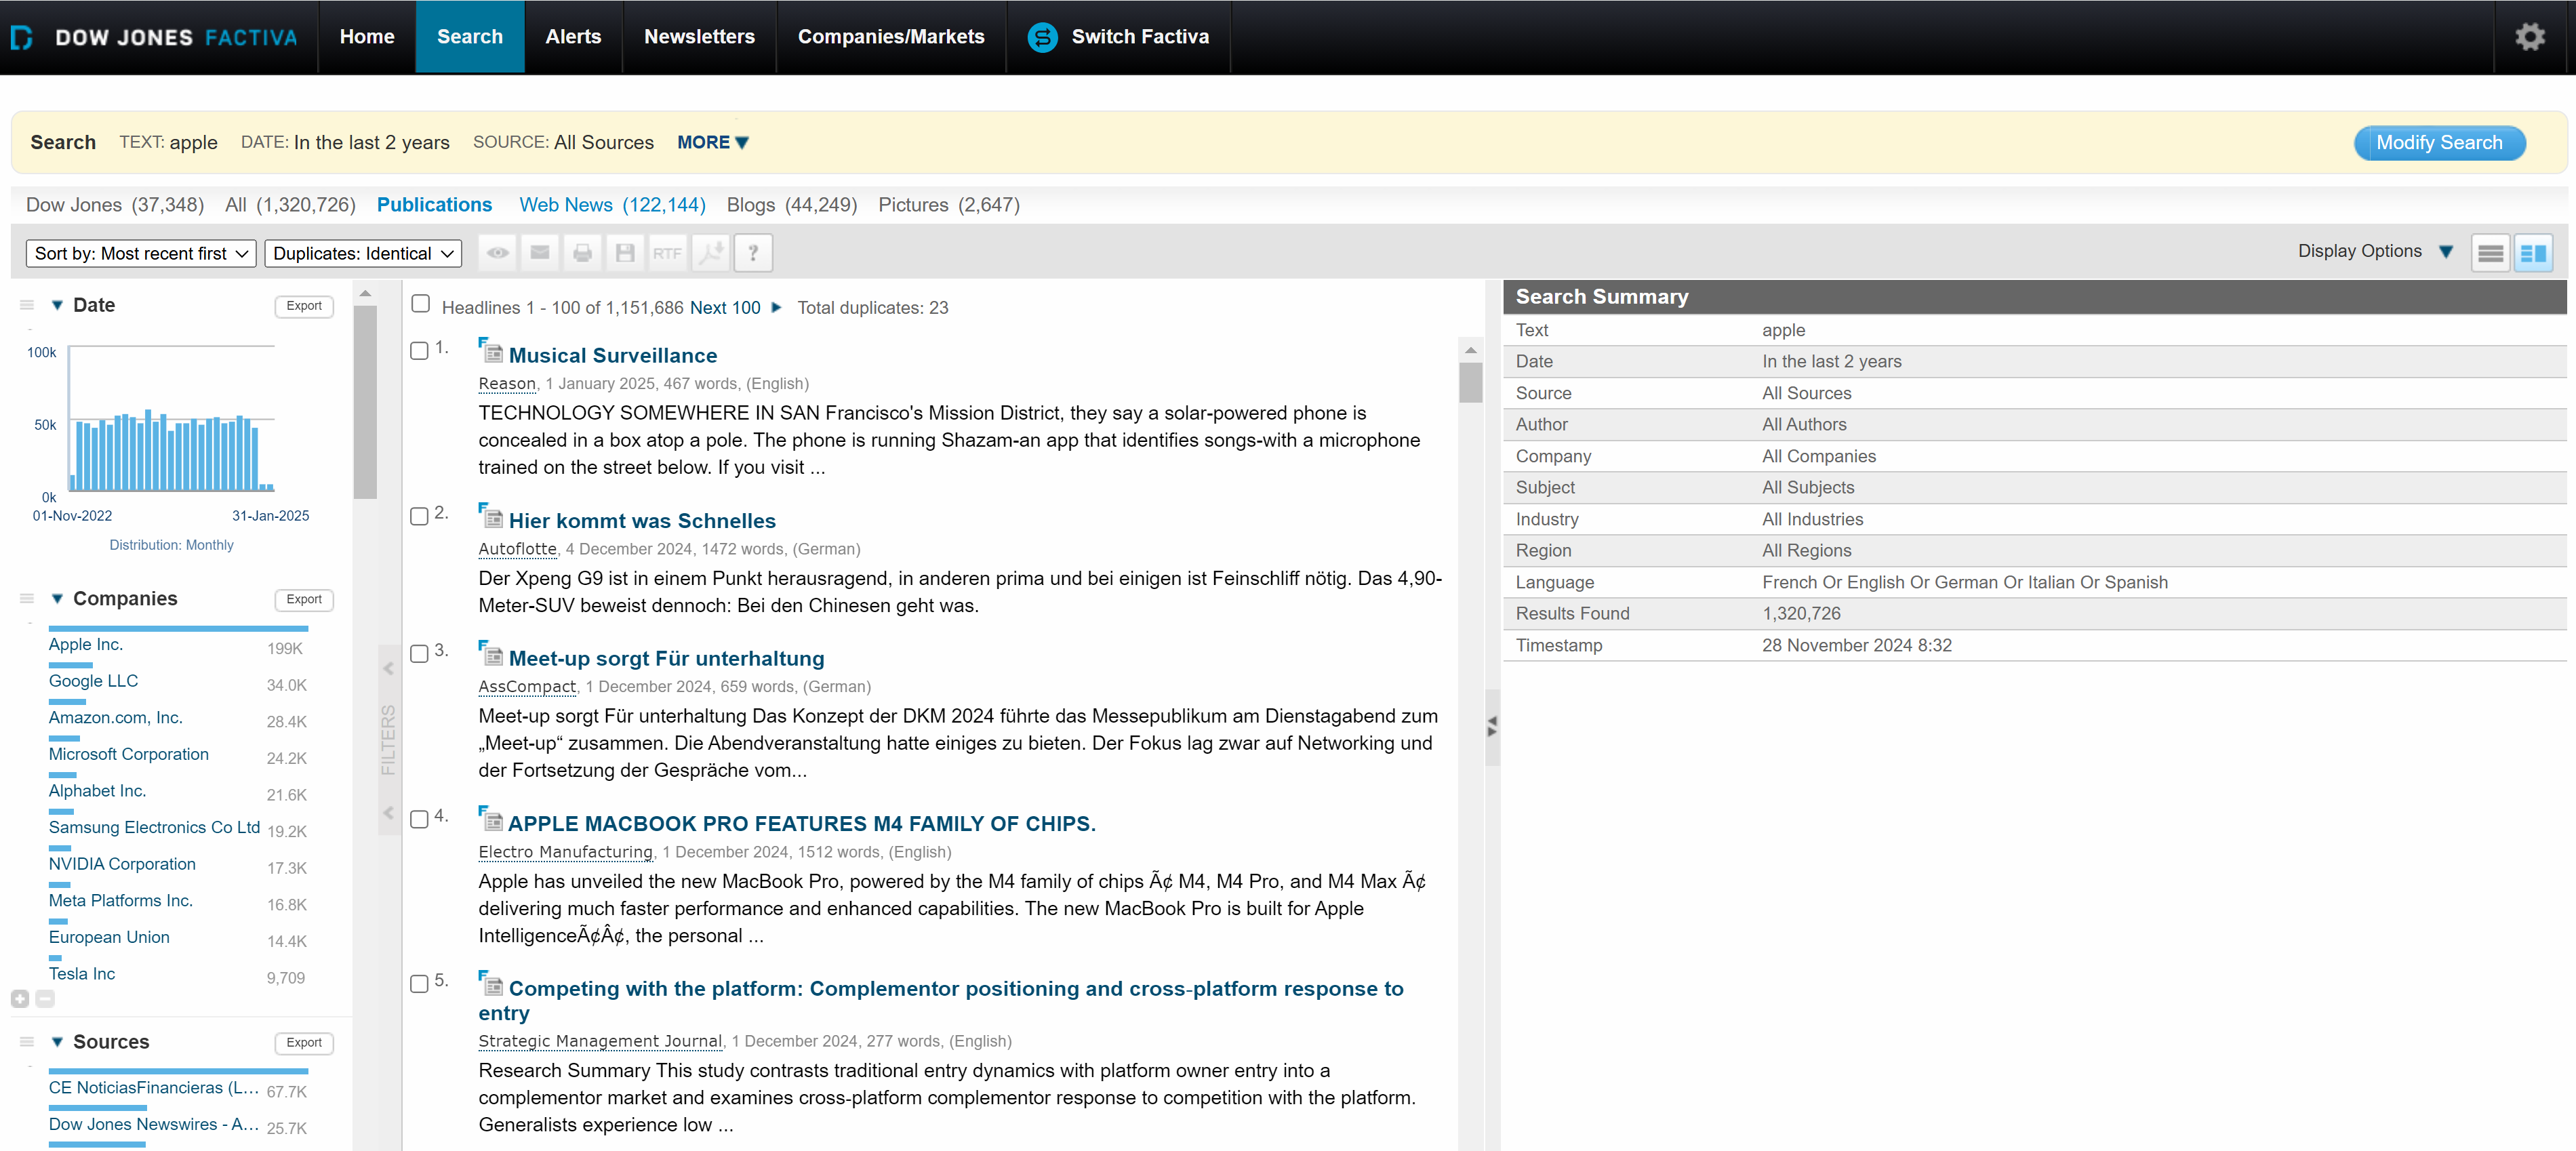
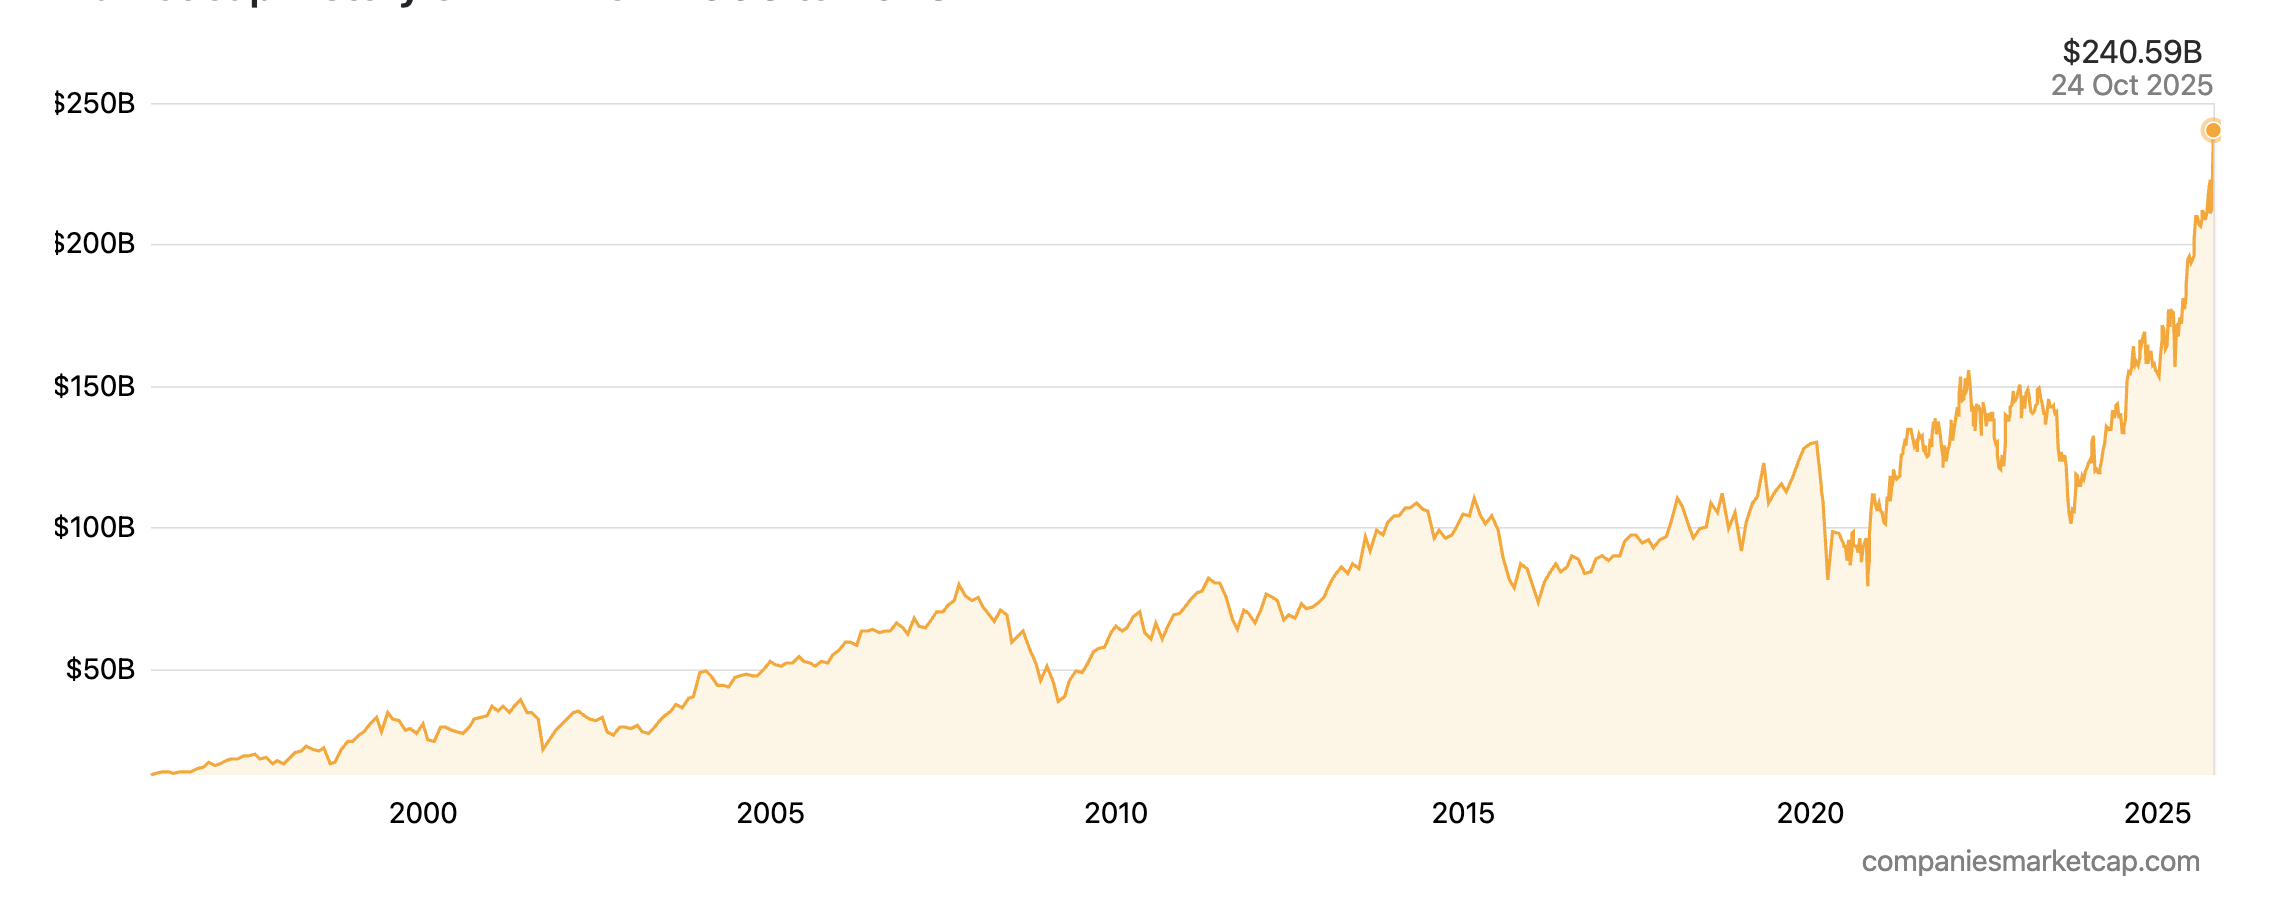
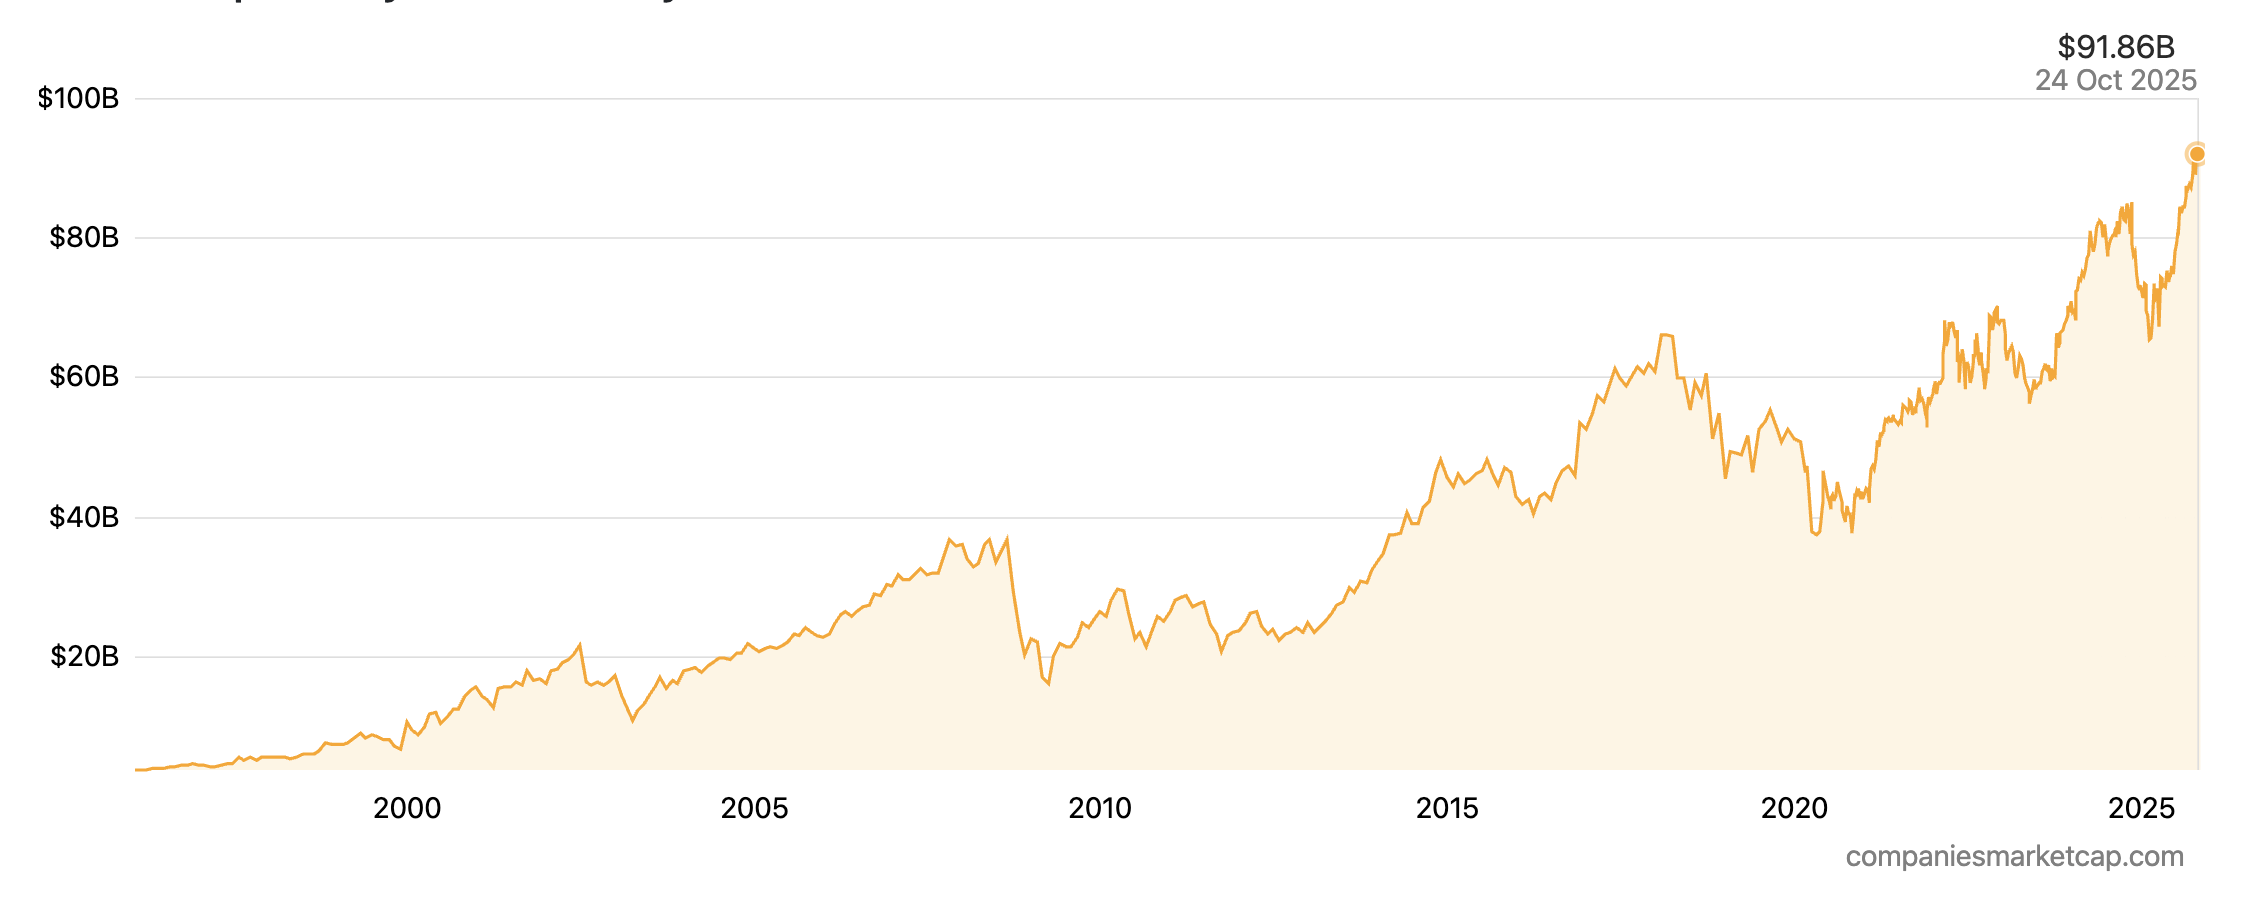
The picture below shows the market capitalization history of Lockheed Martin Corporation from 1996 to 2025.
Market cap history of Lockheed Martin Corporation from 1996 to 2025
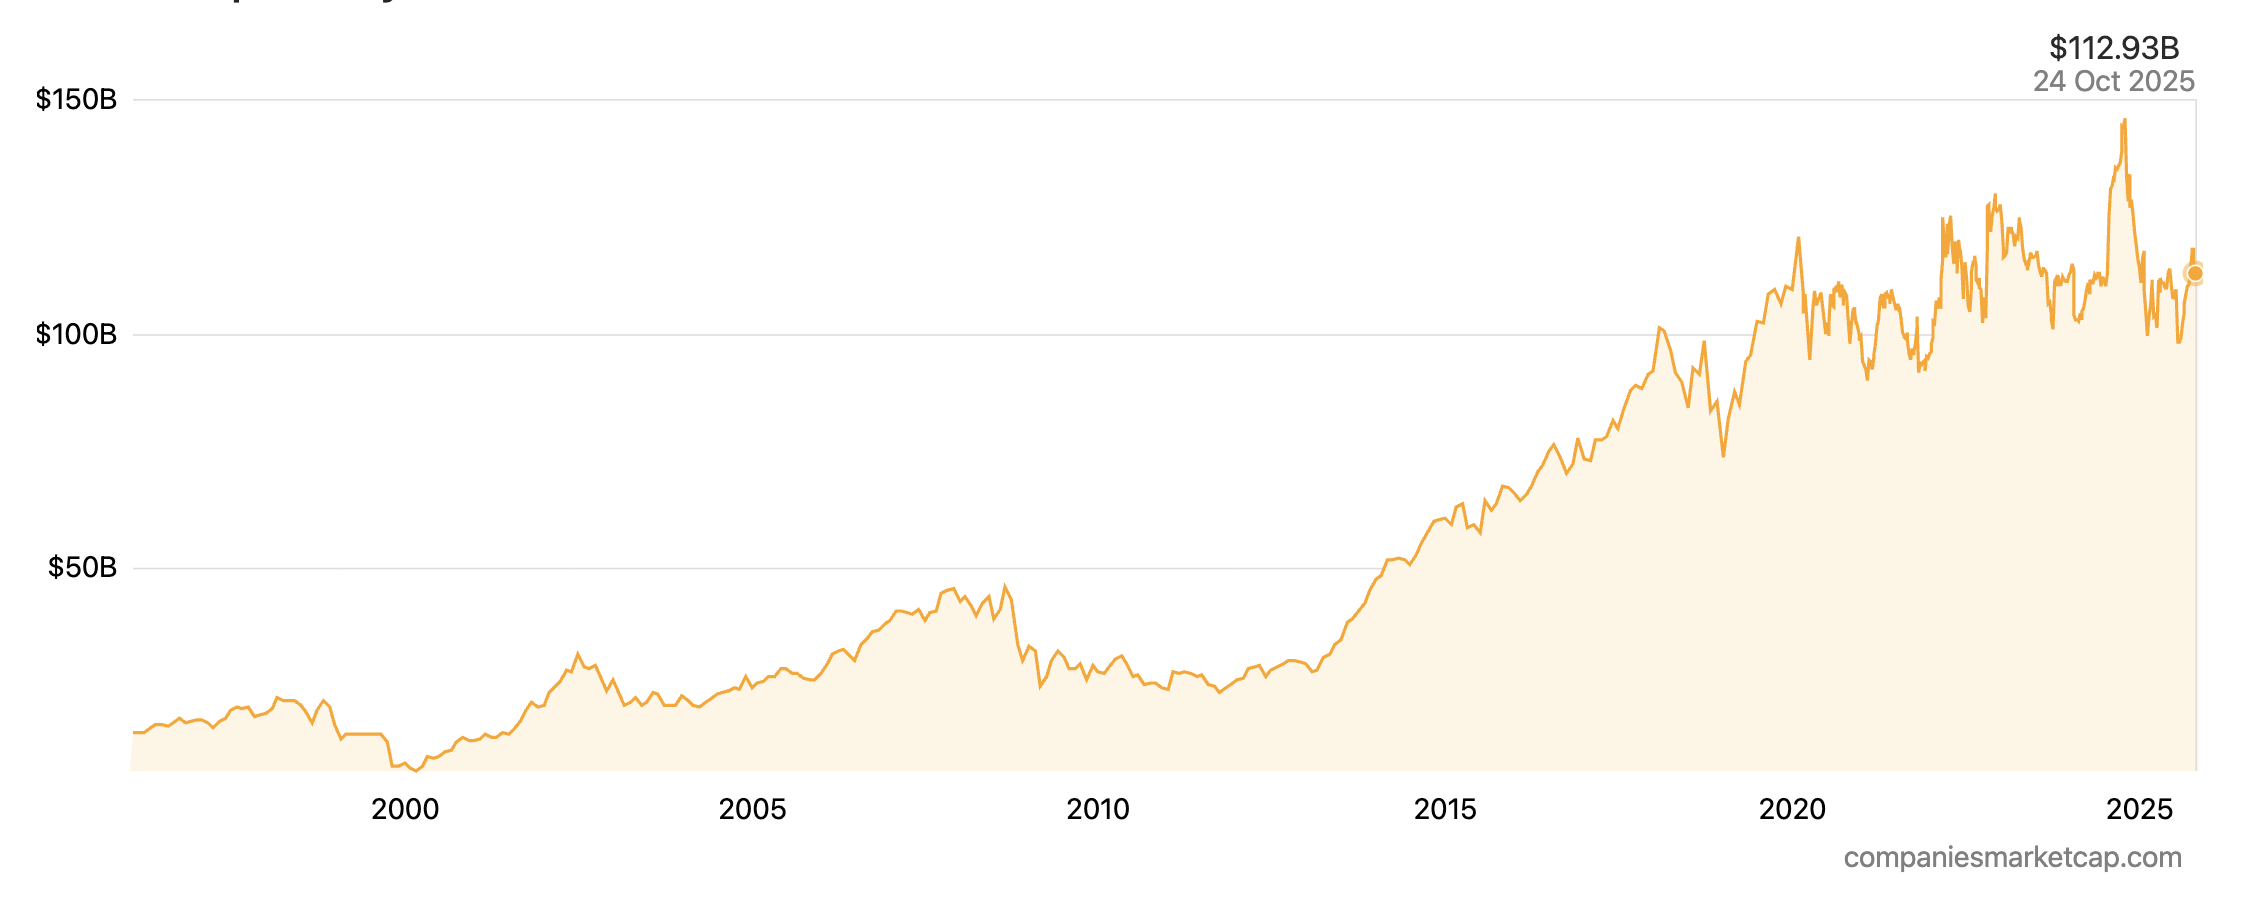
Source: Companies Market Cap.
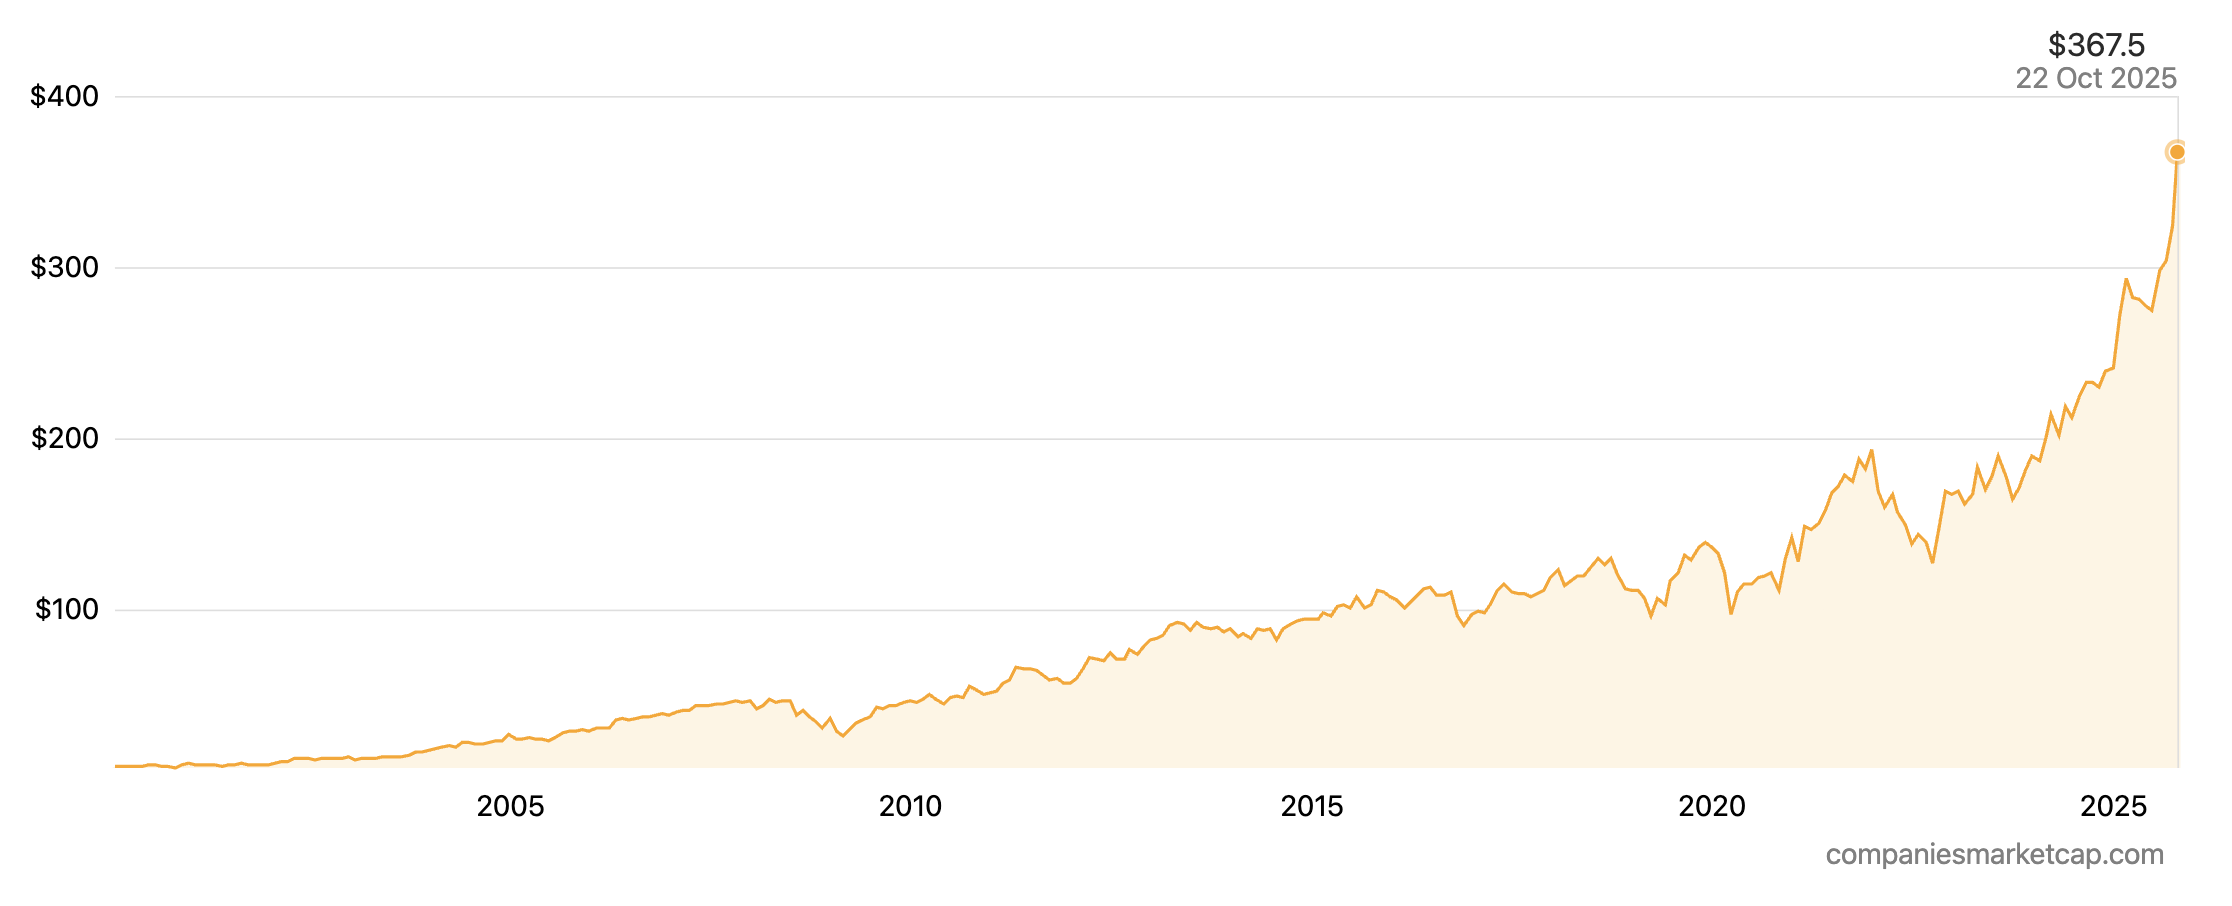
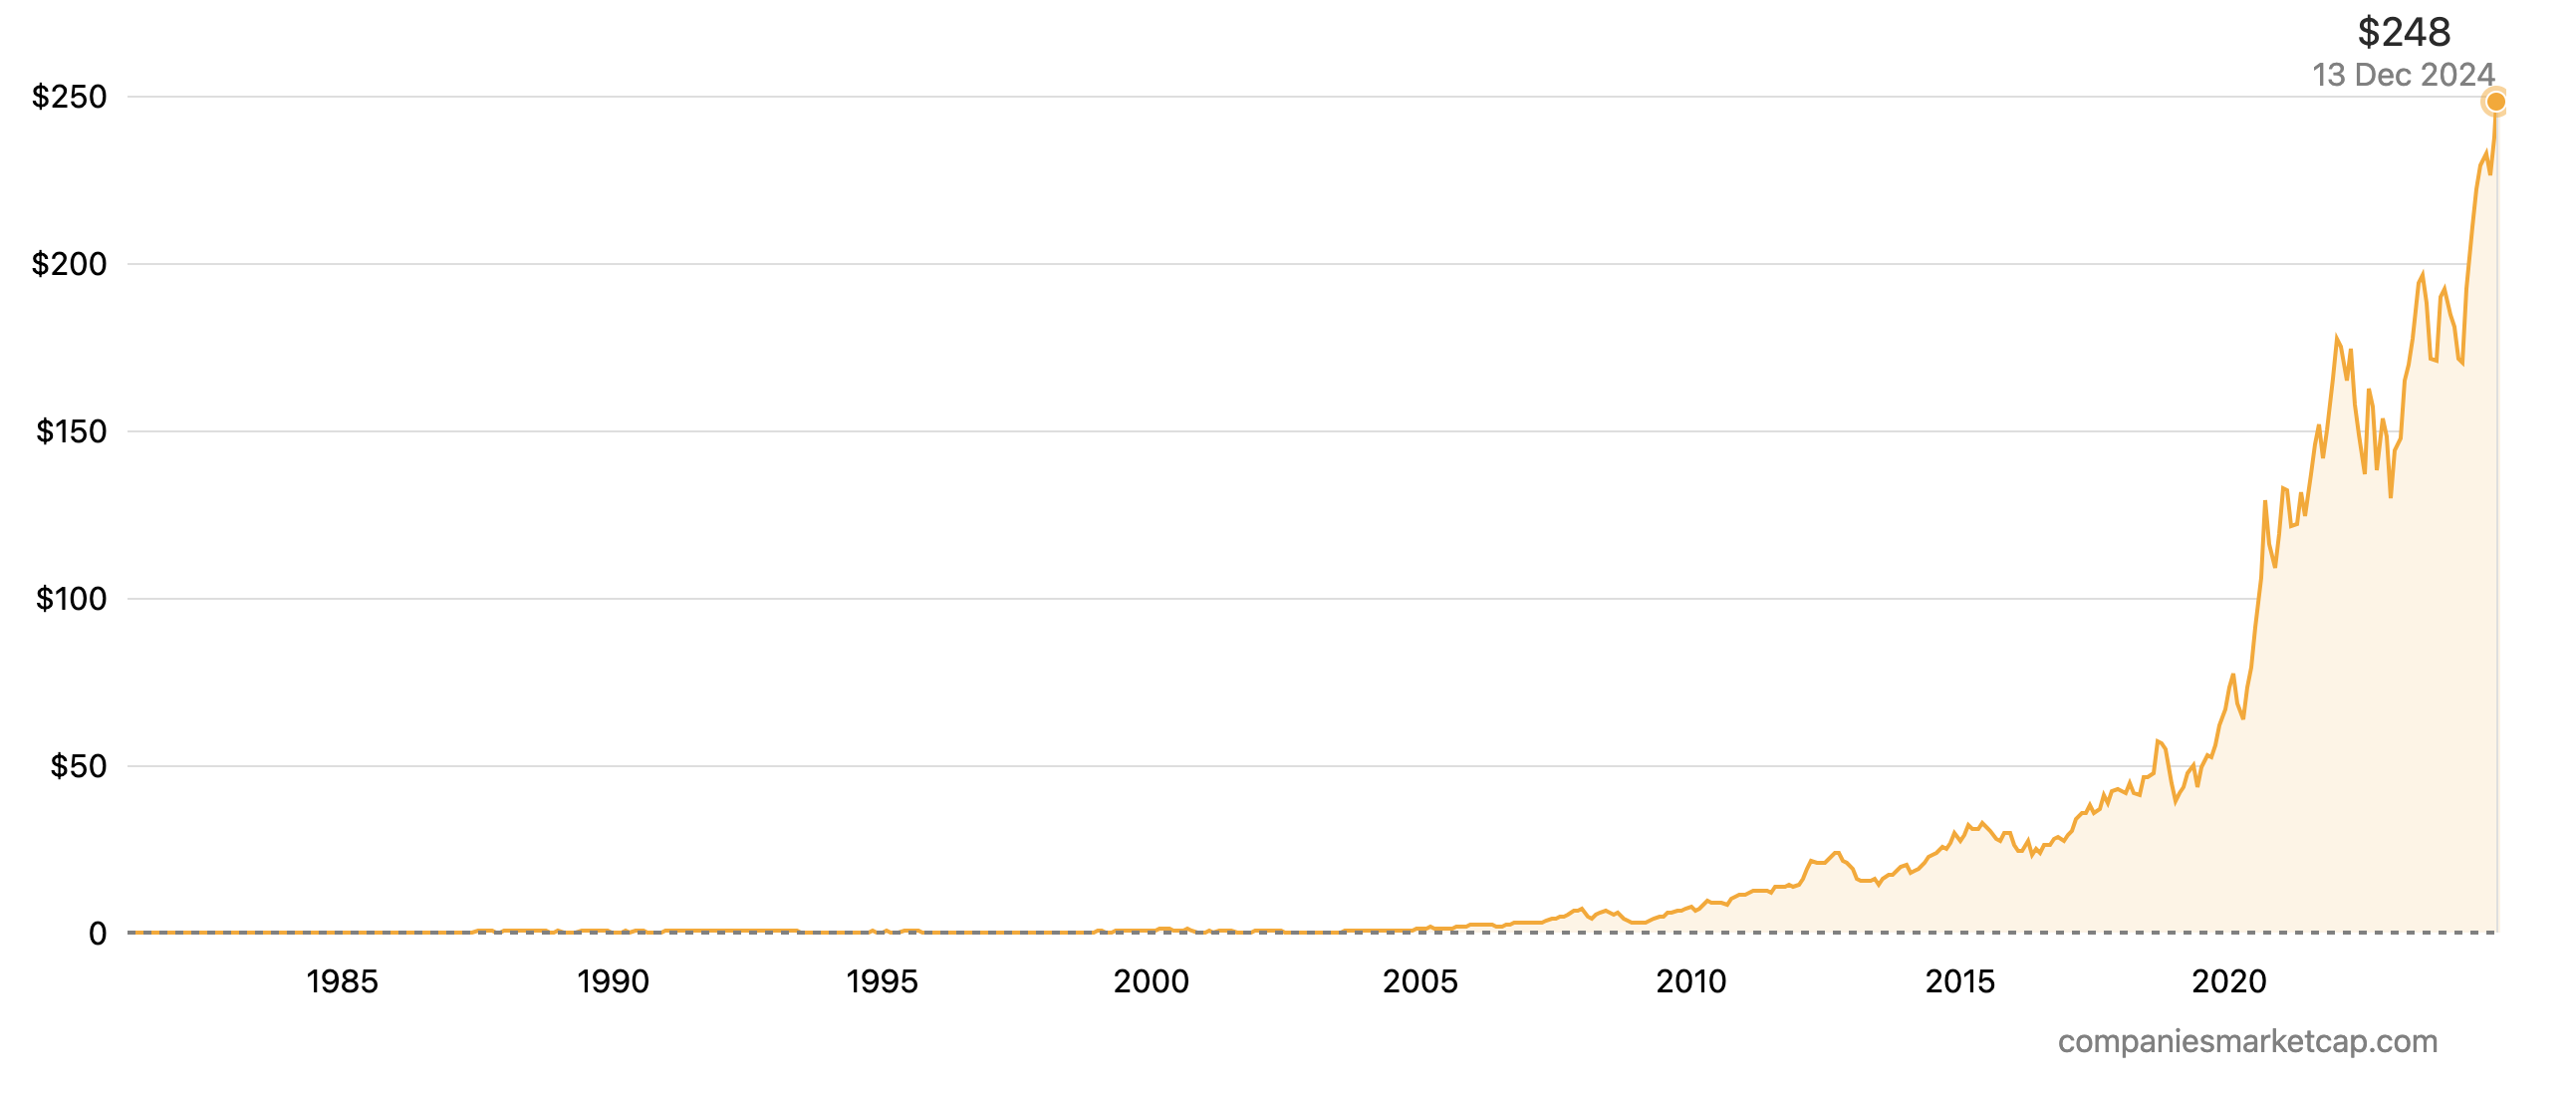
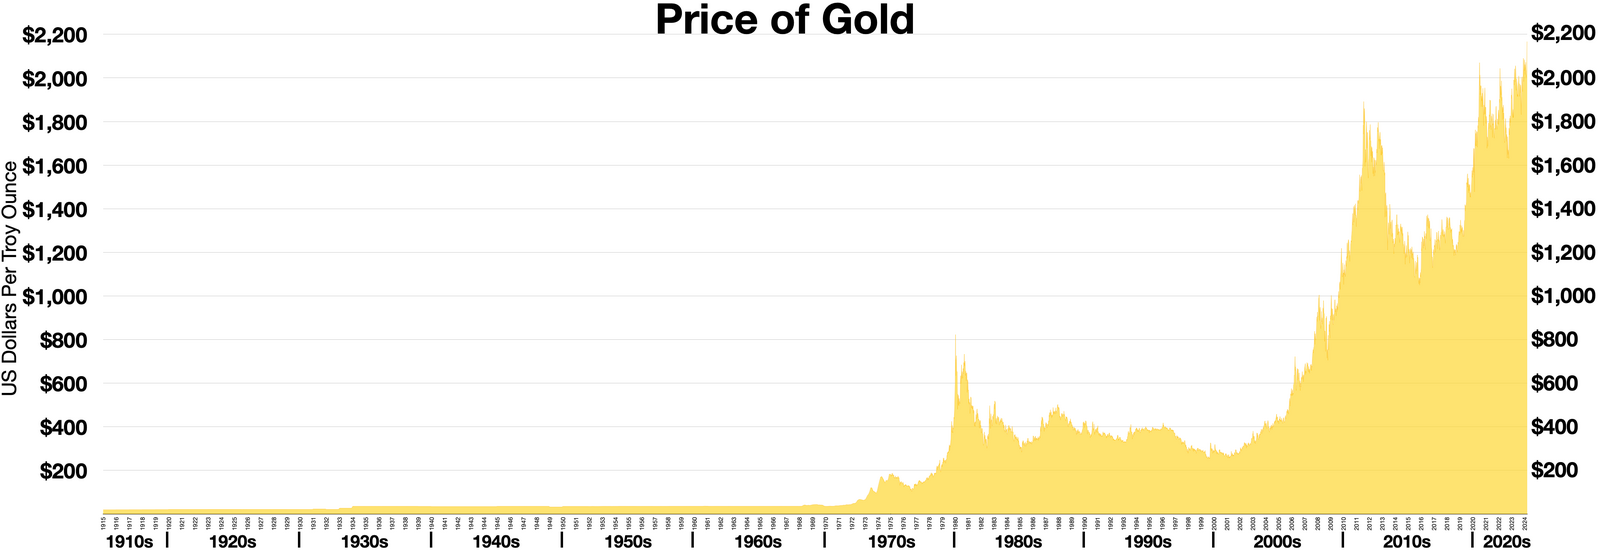
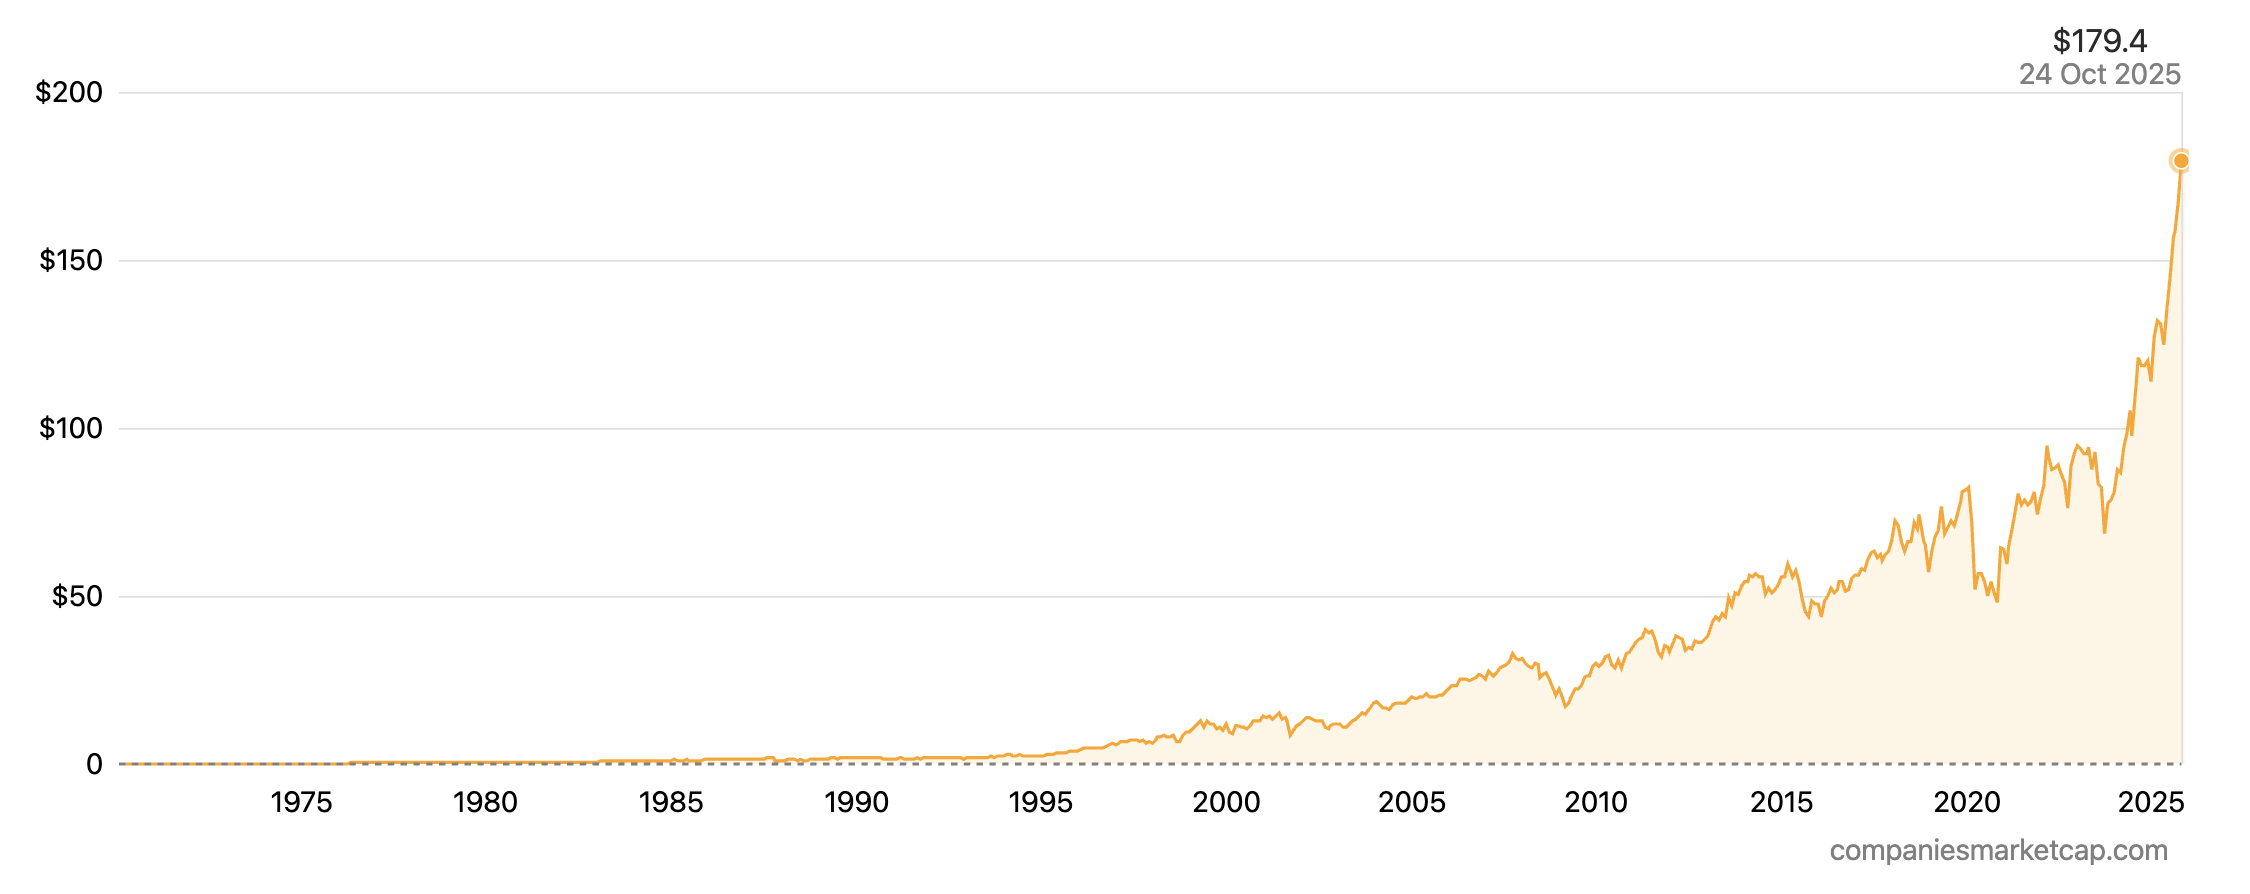
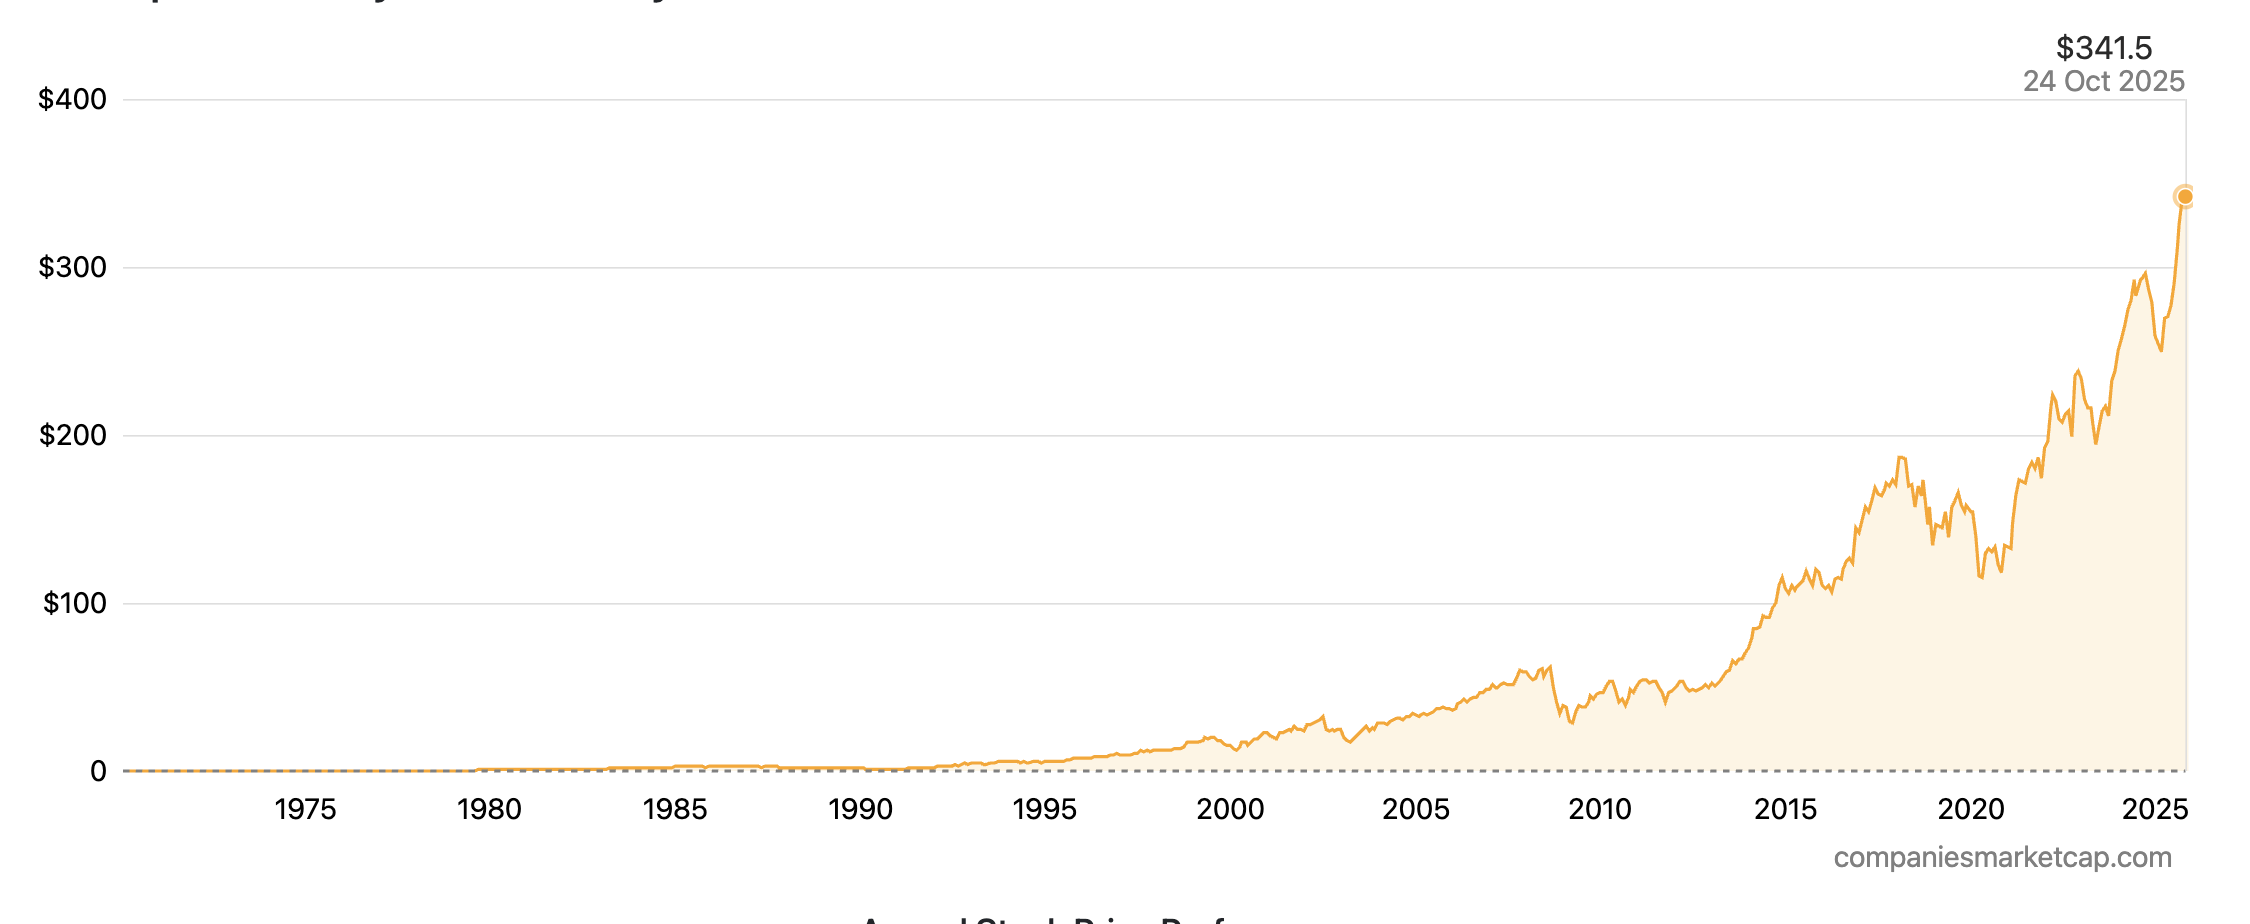
The picture below shows the stock price history of Lockheed Martin Corporation from 1970 to 2025.
Stock price history of Lockheed Martin Corporation from 1970 to 2025
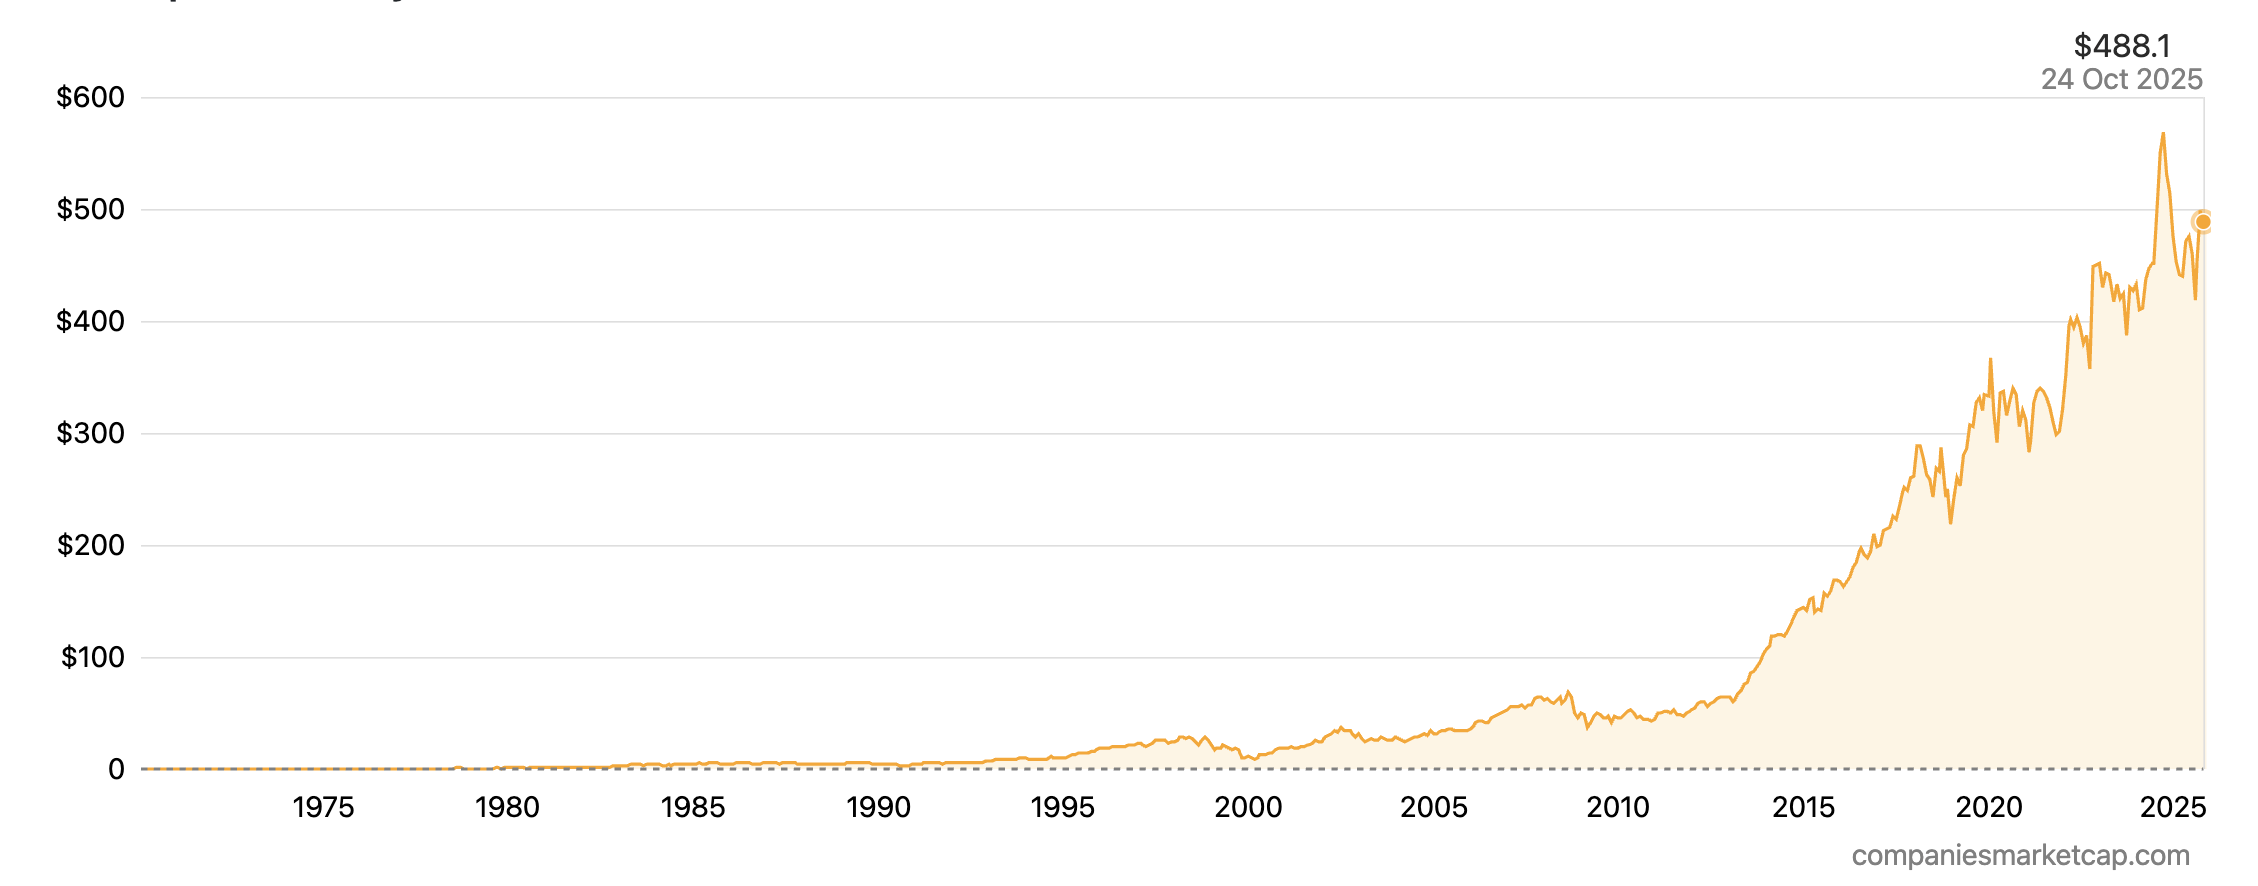
Source: Companies Market Cap.
Lockheed Martin’s strategy is centered on its “21st Century Security” vision, which prioritizes investment in high-growth areas critical to modern warfare, such as hypersonics, integrated air and missile defense, and Joint All-Domain Operations (JADO). The company is positioned to be a prime beneficiary of the DoD’s modernization priorities. Financial analysts currently hold a consensus “Hold” rating on the stock, with 12-month price targets ranging from approximately $425 to $590, reflecting both the company’s strong market position and concerns over recent program charges and execution risk.
RTX Corporation (RTX)
RTX Corporation was forged into its current form through the colossal 2020 merger of Raytheon Company, a leader in defense electronics and missiles, and United Technologies Corporation, a powerhouse in aerospace systems and engines. This transaction created a new type of defense prime: an integrated technology company with a balanced portfolio spanning both defense and commercial aerospace. The company, led by Chairman and CEO Christopher T. Calio, is a leader in developing and manufacturing some of the most advanced technology systems in the world.
RTX operates through three highly complementary business segments that provide a broad range of products and services : Collins Aerospace, Pratt & Whitney, and Raytheon
- Collins Aerospace: This segment is a top-tier supplier of technologically advanced aerospace and defense products. Its portfolio includes everything from aerostructures and avionics to mission systems and power controls for a vast array of commercial and military aircraft.
- Pratt & Whitney: One of the world’s foremost manufacturers of aircraft engines, Pratt & Whitney supplies propulsion systems for commercial airliners (including the Geared Turbofan™ engine for the Airbus A320neo family), military fighter jets (such as the F135 engine for the F-35), and business jets.
- Raytheon: This segment is the core of RTX’s defense offerings and a global leader in sensing, effects, and command and control solutions. It is the world’s largest producer of guided missiles and is renowned for its integrated air and missile defense systems, particularly the Patriot system, as well as advanced radars and precision weapons.
The strategic rationale of the merger is evident in this structure. The combination of Raytheon’s defense technologies with the aerospace systems of Collins and Pratt & Whitney allows RTX to offer more integrated solutions and benefit from technology synergies across its portfolio. The current geopolitical climate, with its emphasis on replenishing munitions and bolstering air and missile defense capabilities, has placed RTX’s Raytheon segment in an exceptionally strong position. Systems like the Patriot, AMRAAM, and Stinger missiles are in high demand globally, a direct consequence of the war in Ukraine and rising tensions elsewhere. Unlike long-cycle platforms such as aircraft carriers, these systems are being consumed in active conflicts and require rapid, high-volume replenishment. This creates a high-velocity, high-margin revenue cycle that the market has recognized, affording RTX a premium valuation relative to many of its peers.
Logo of RTX![]()
Source: the company.
RTX’s financial results demonstrate the strength of its balanced portfolio. In the second quarter of 2025, the company reported sales of $21.6 billion, an increase of 9% on an organic basis, with adjusted EPS rising 11% to $1.56. The performance was driven by strong growth in the commercial aftermarket as air travel continues to recover, alongside robust demand in the defense segments.
The company’s future is underpinned by the largest backlog in the industry, which stood at a staggering $236 billion at the end of Q2 2025. This backlog is well-balanced, comprising $144 billion in commercial aerospace orders and $92 billion in defense orders, providing multi-year revenue visibility. RTX continues to win significant contracts, including a landmark $50 billion, 20-year umbrella contract with the U.S. Defense Logistics Agency to provide a wide range of systems, spare parts, and support services across the DoD.
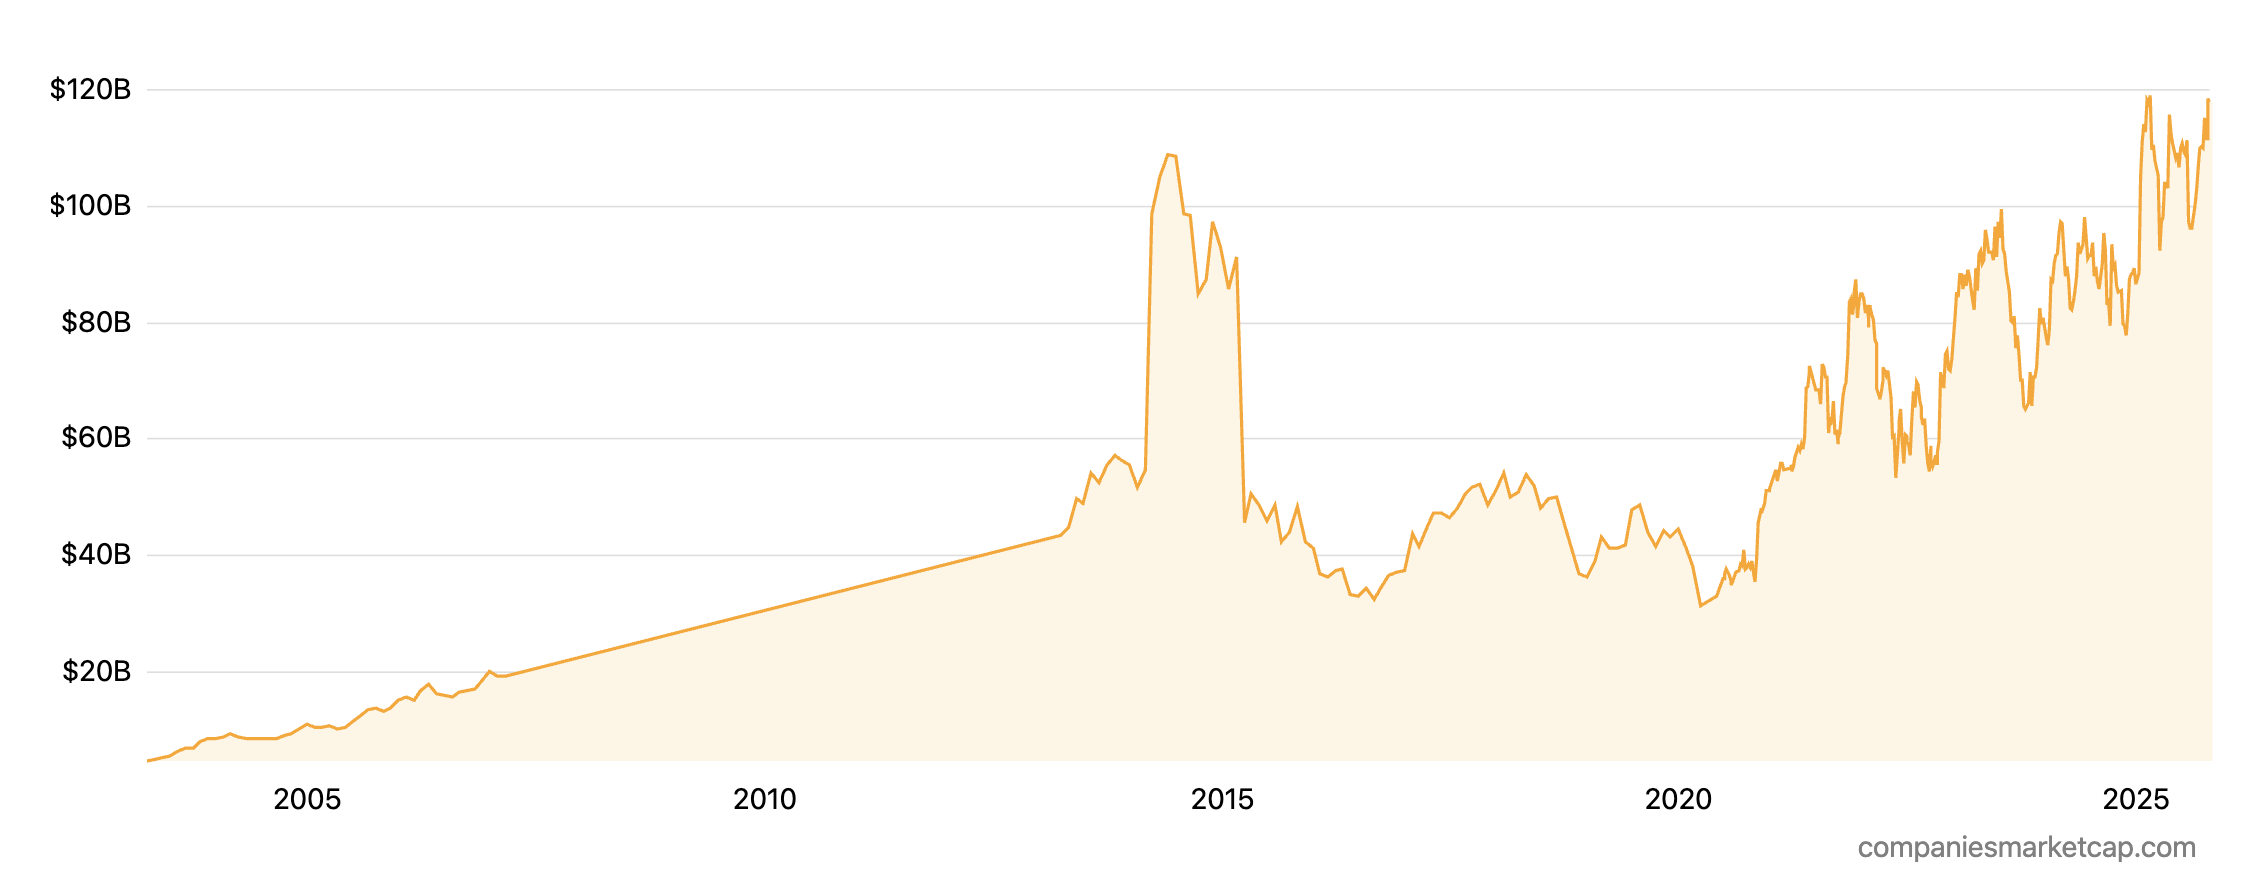
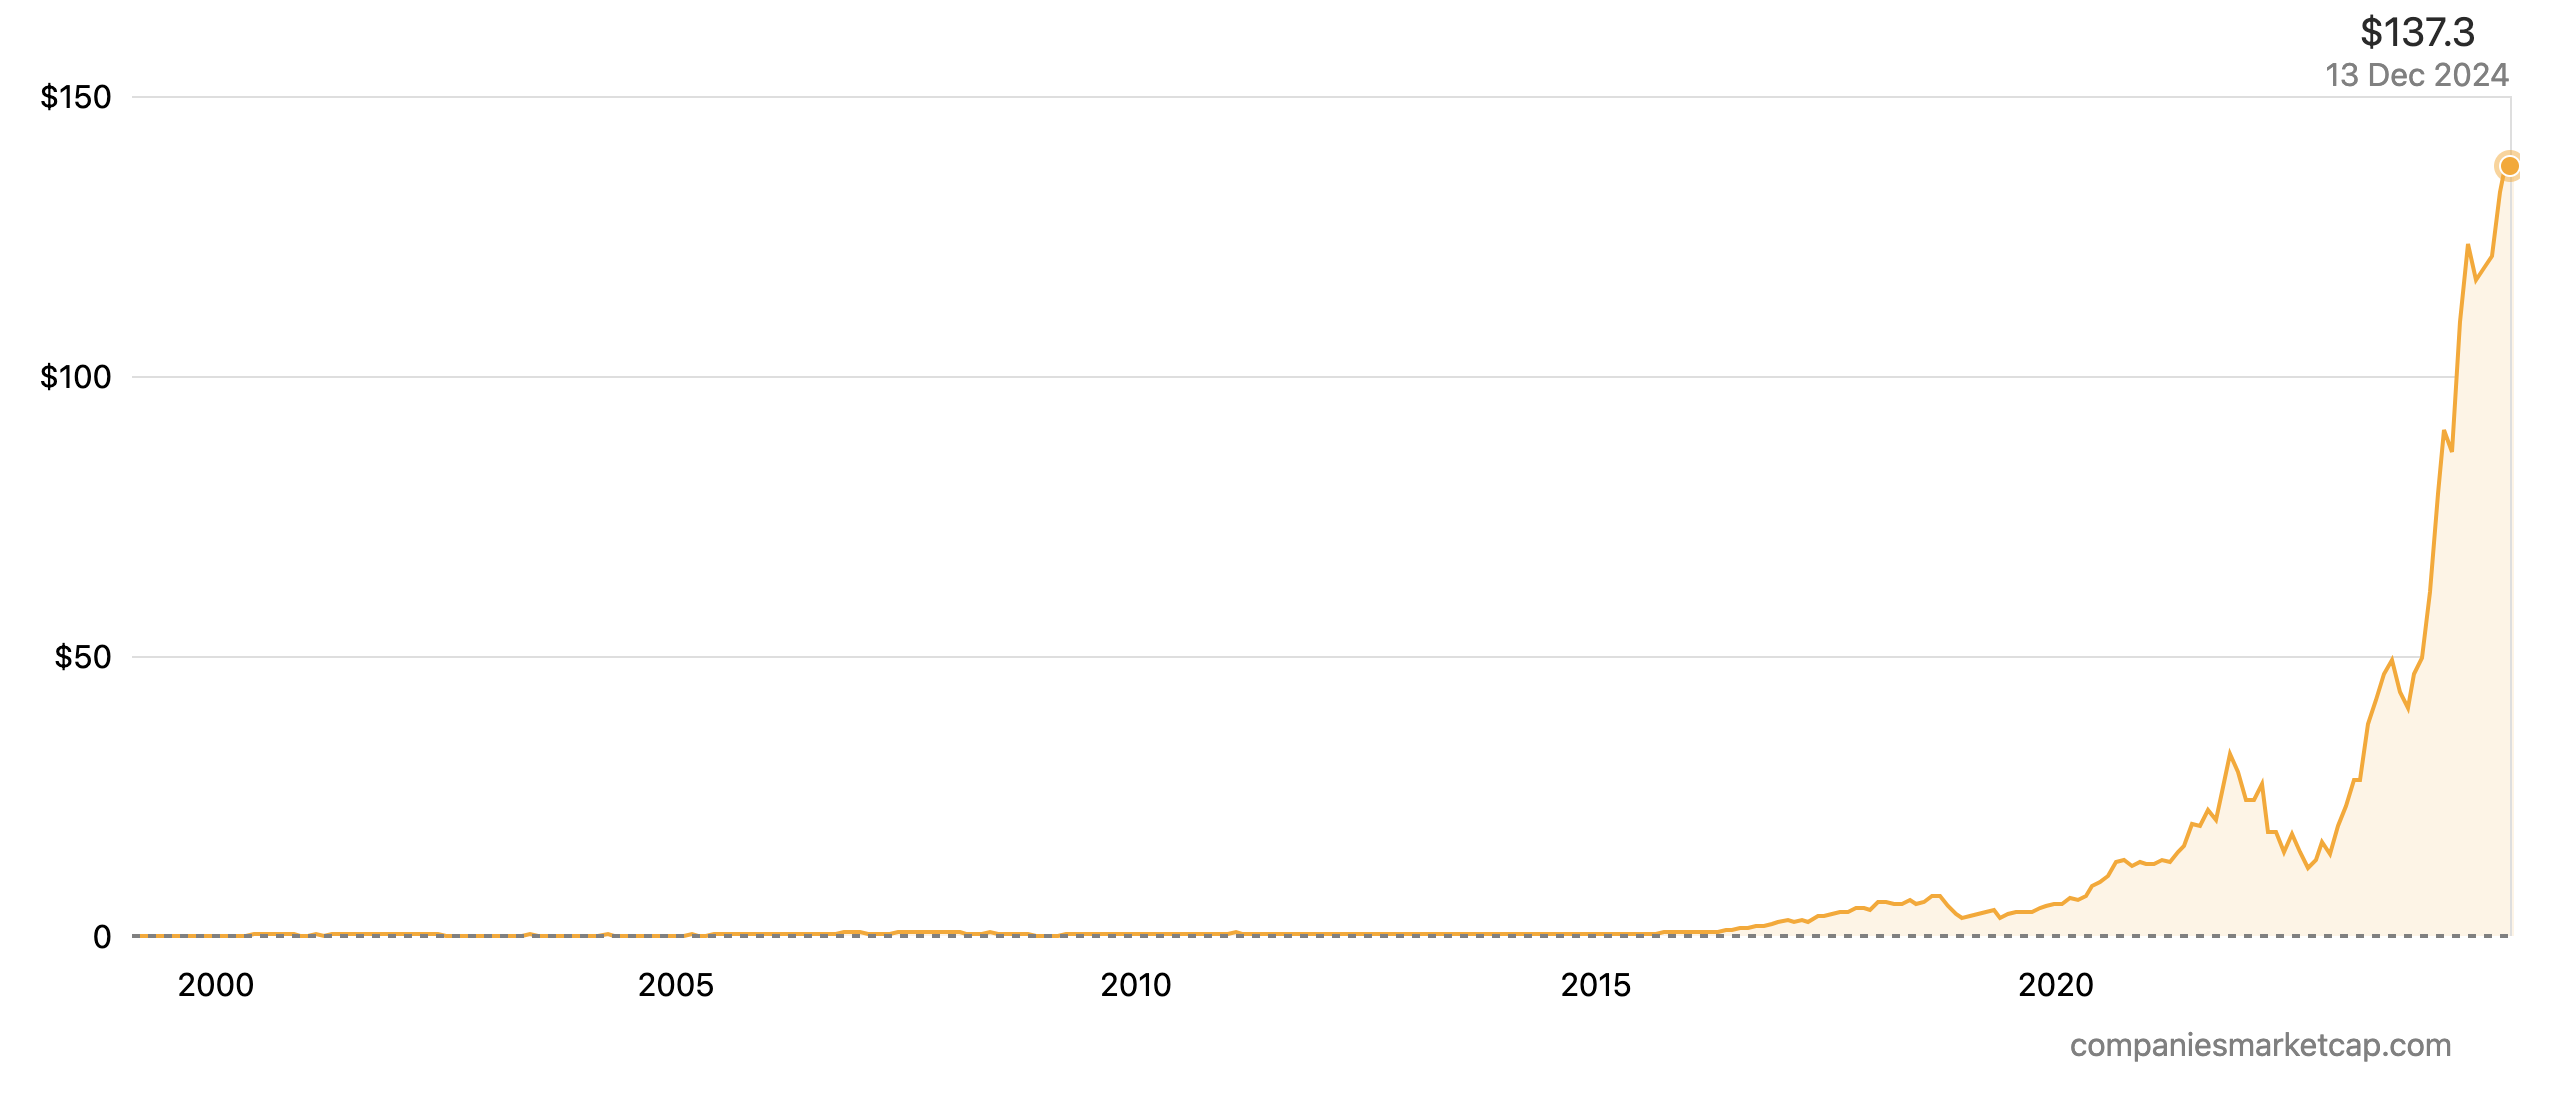
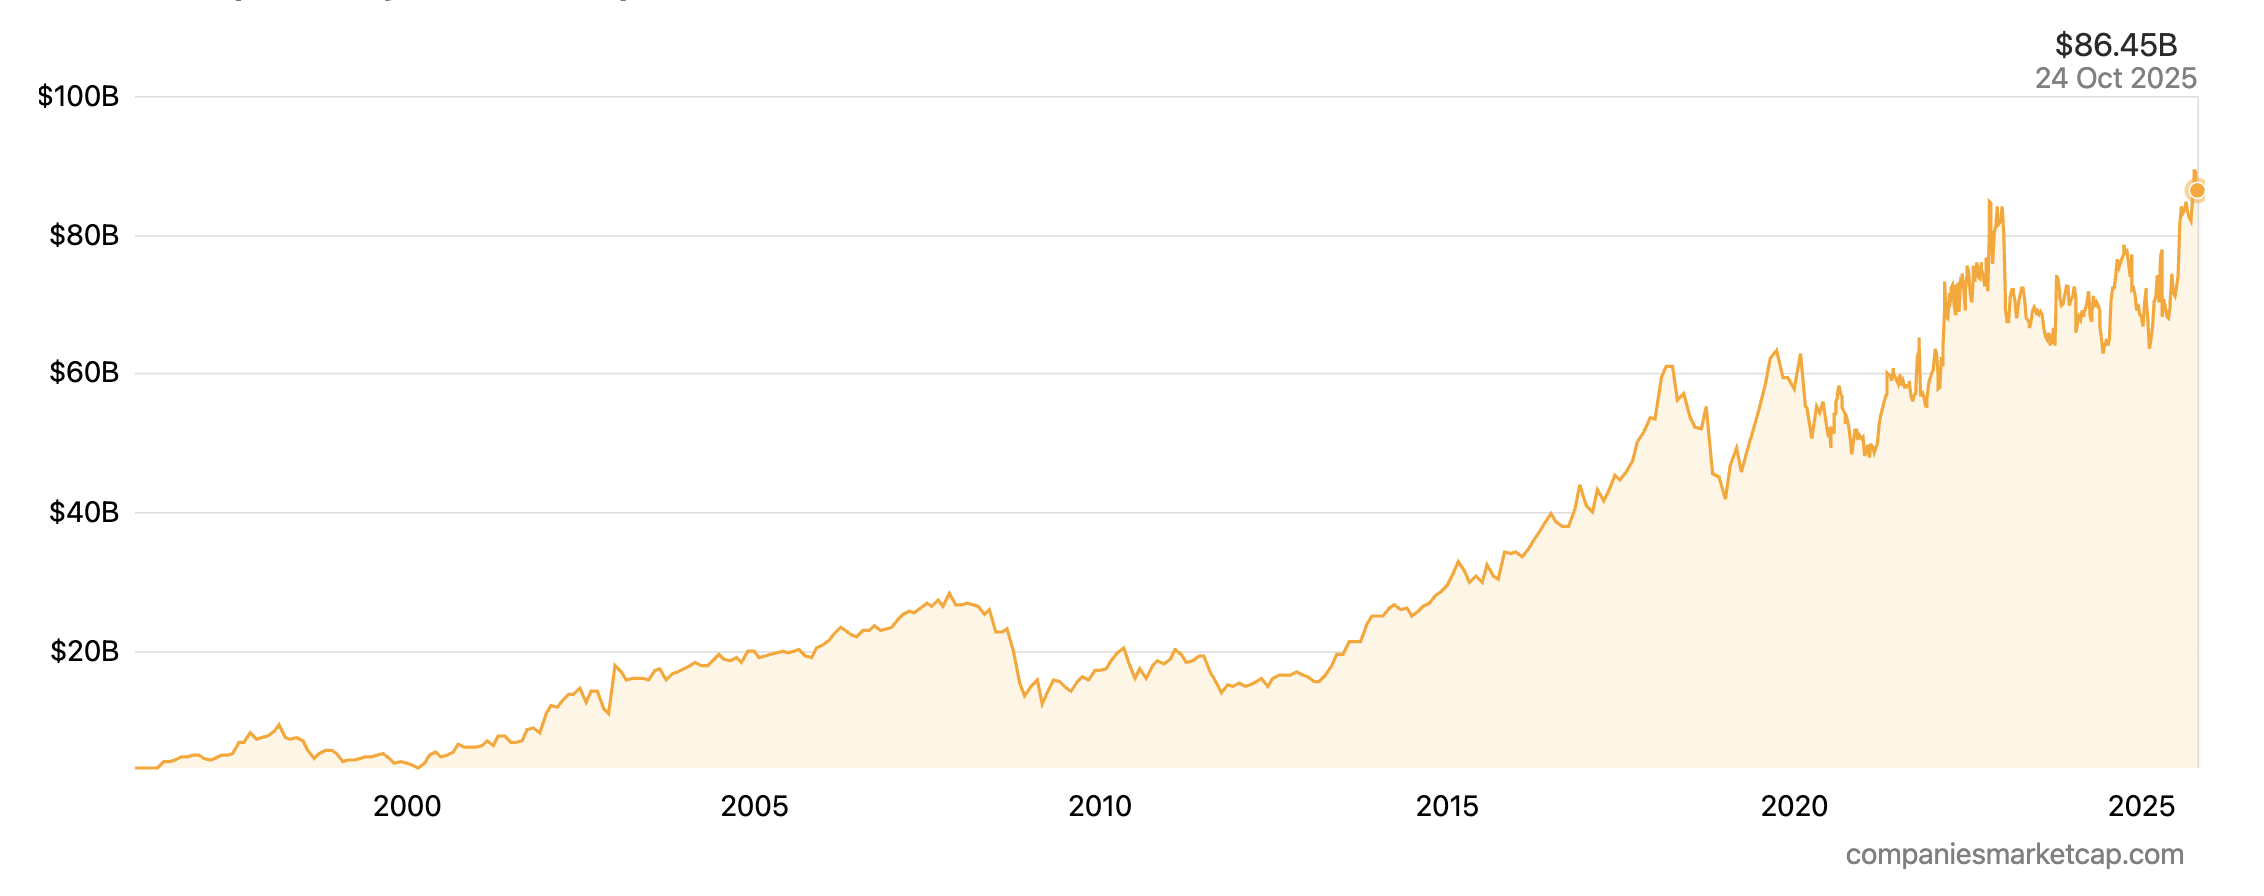
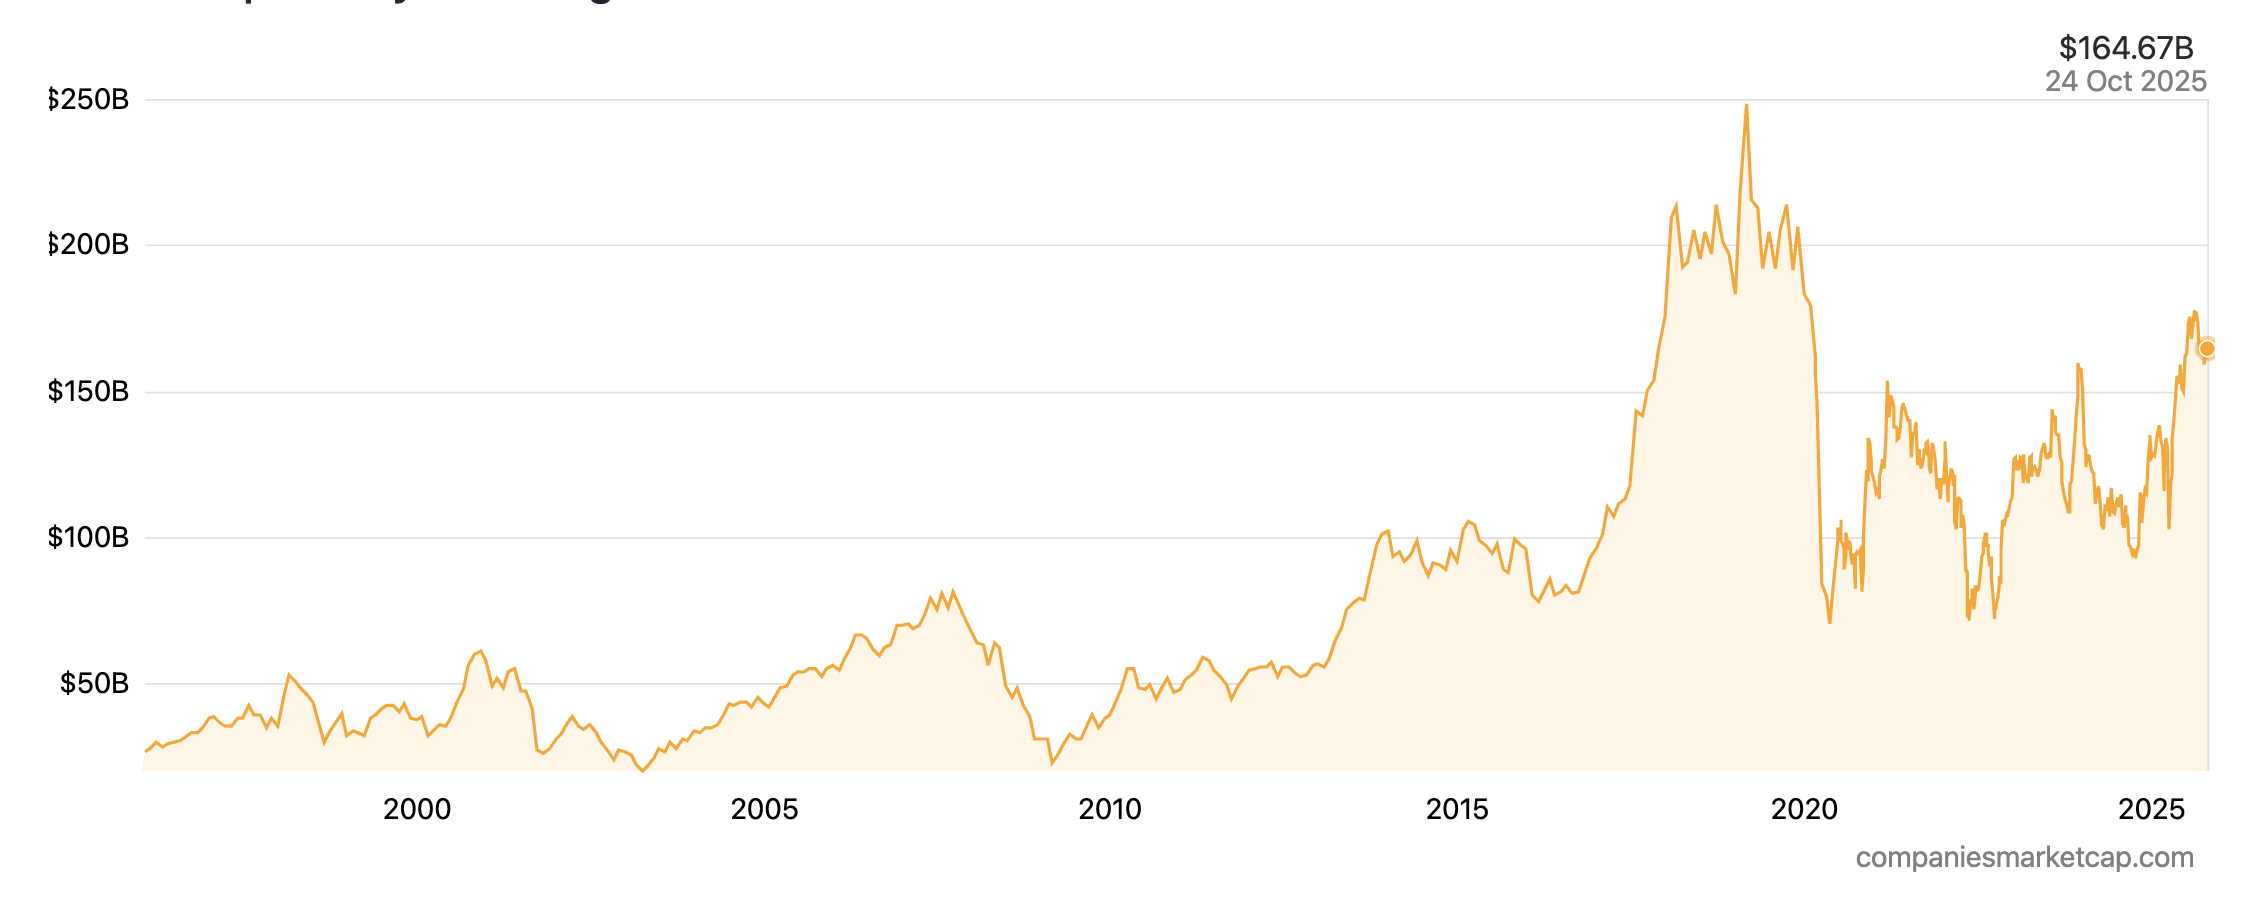
The picture below shows the market capitalization history of RTX Corporation from 1996 to 2025.
Market cap history of RTX Corporation from 1996 to 2025
Source: Companies Market Cap.
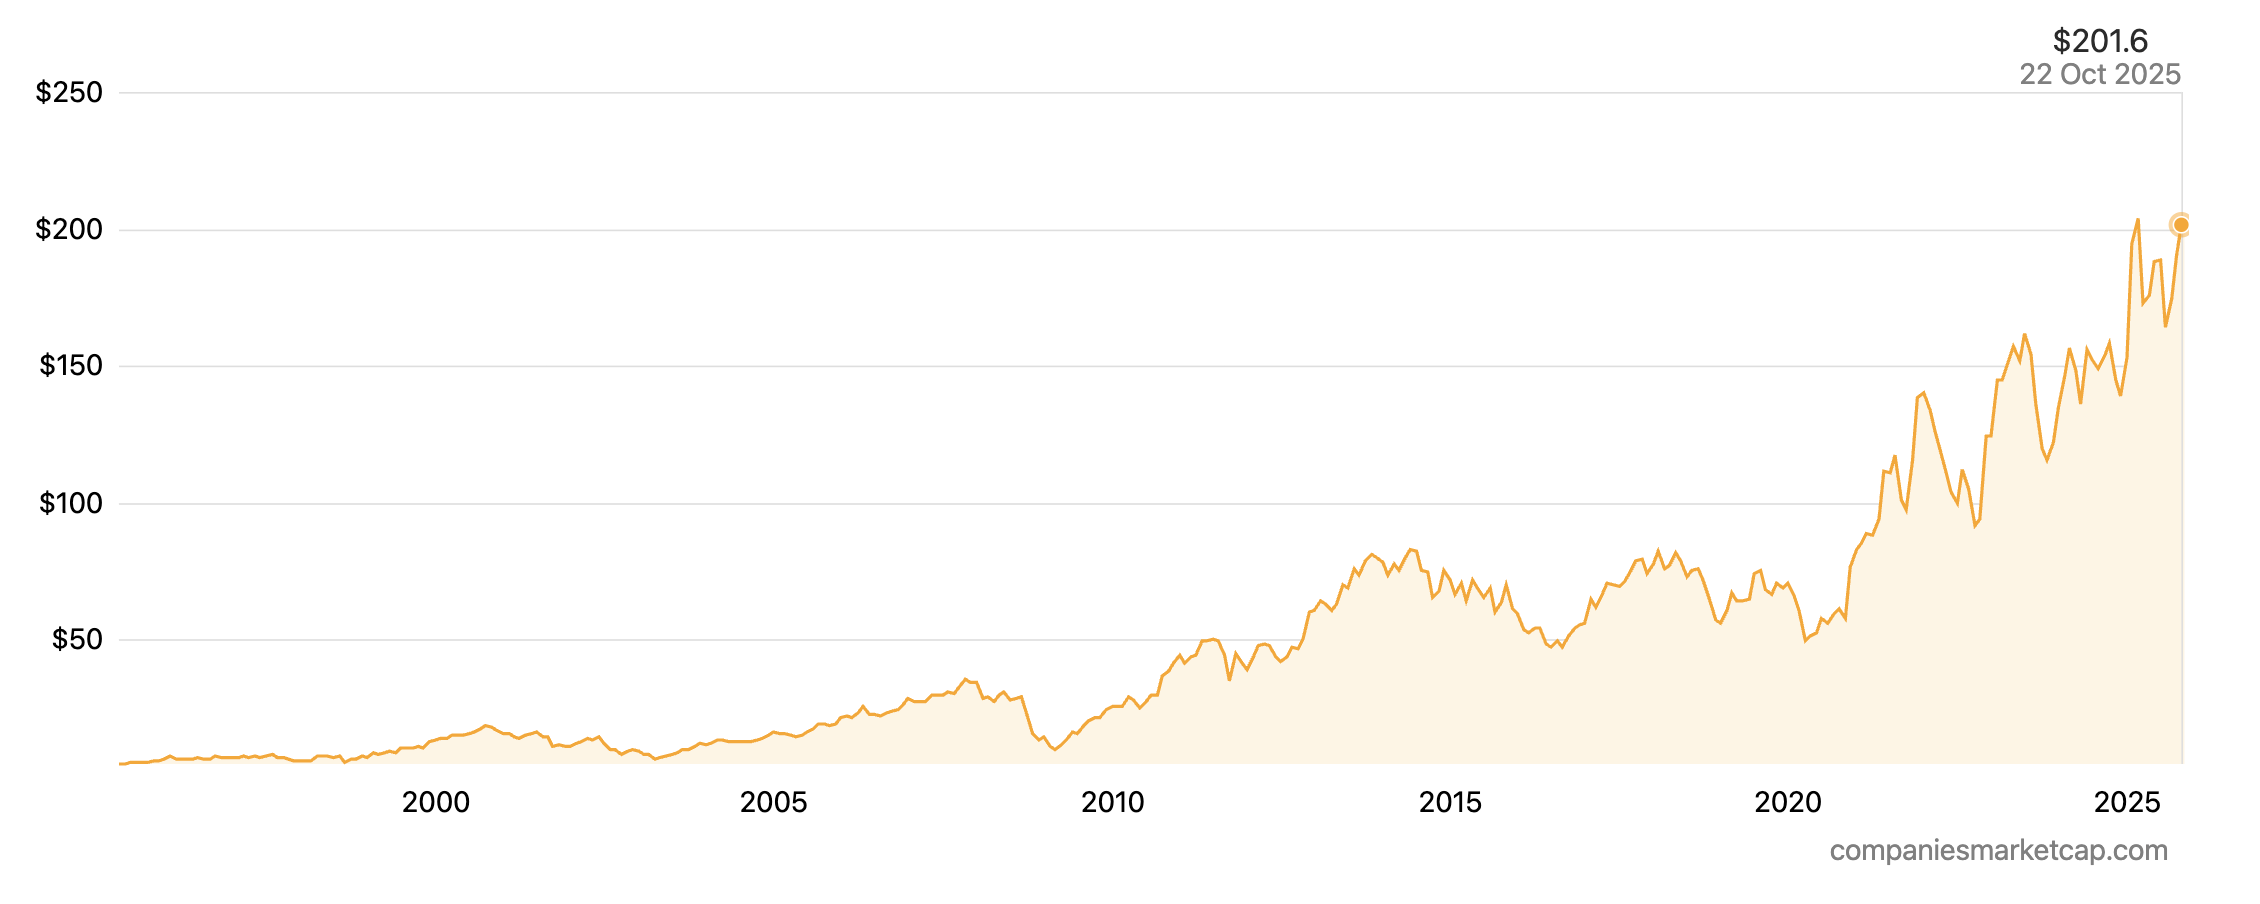
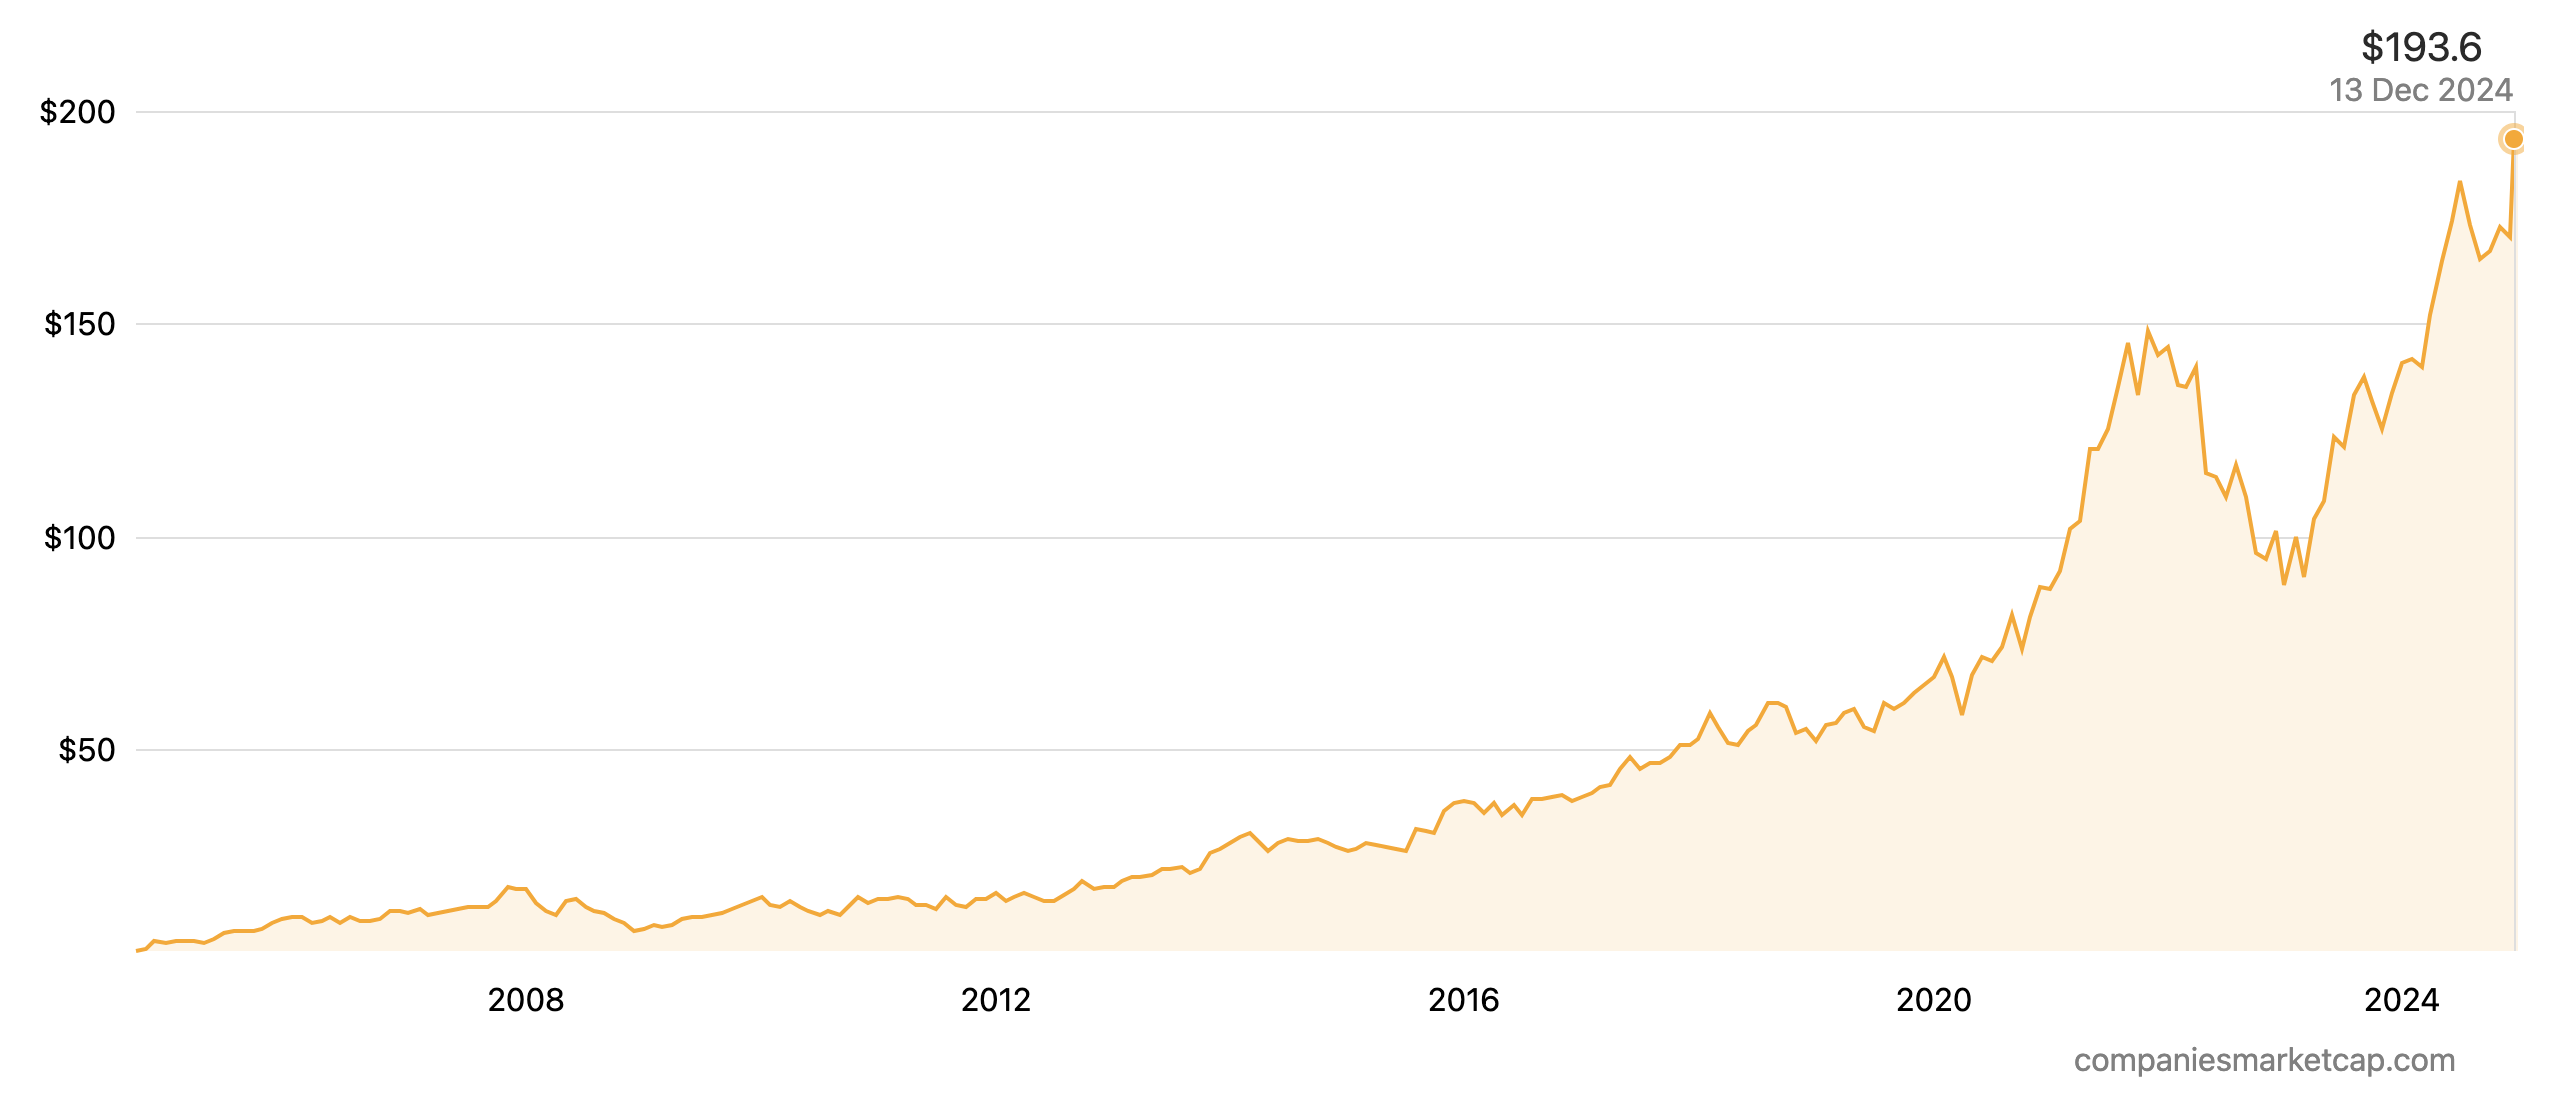
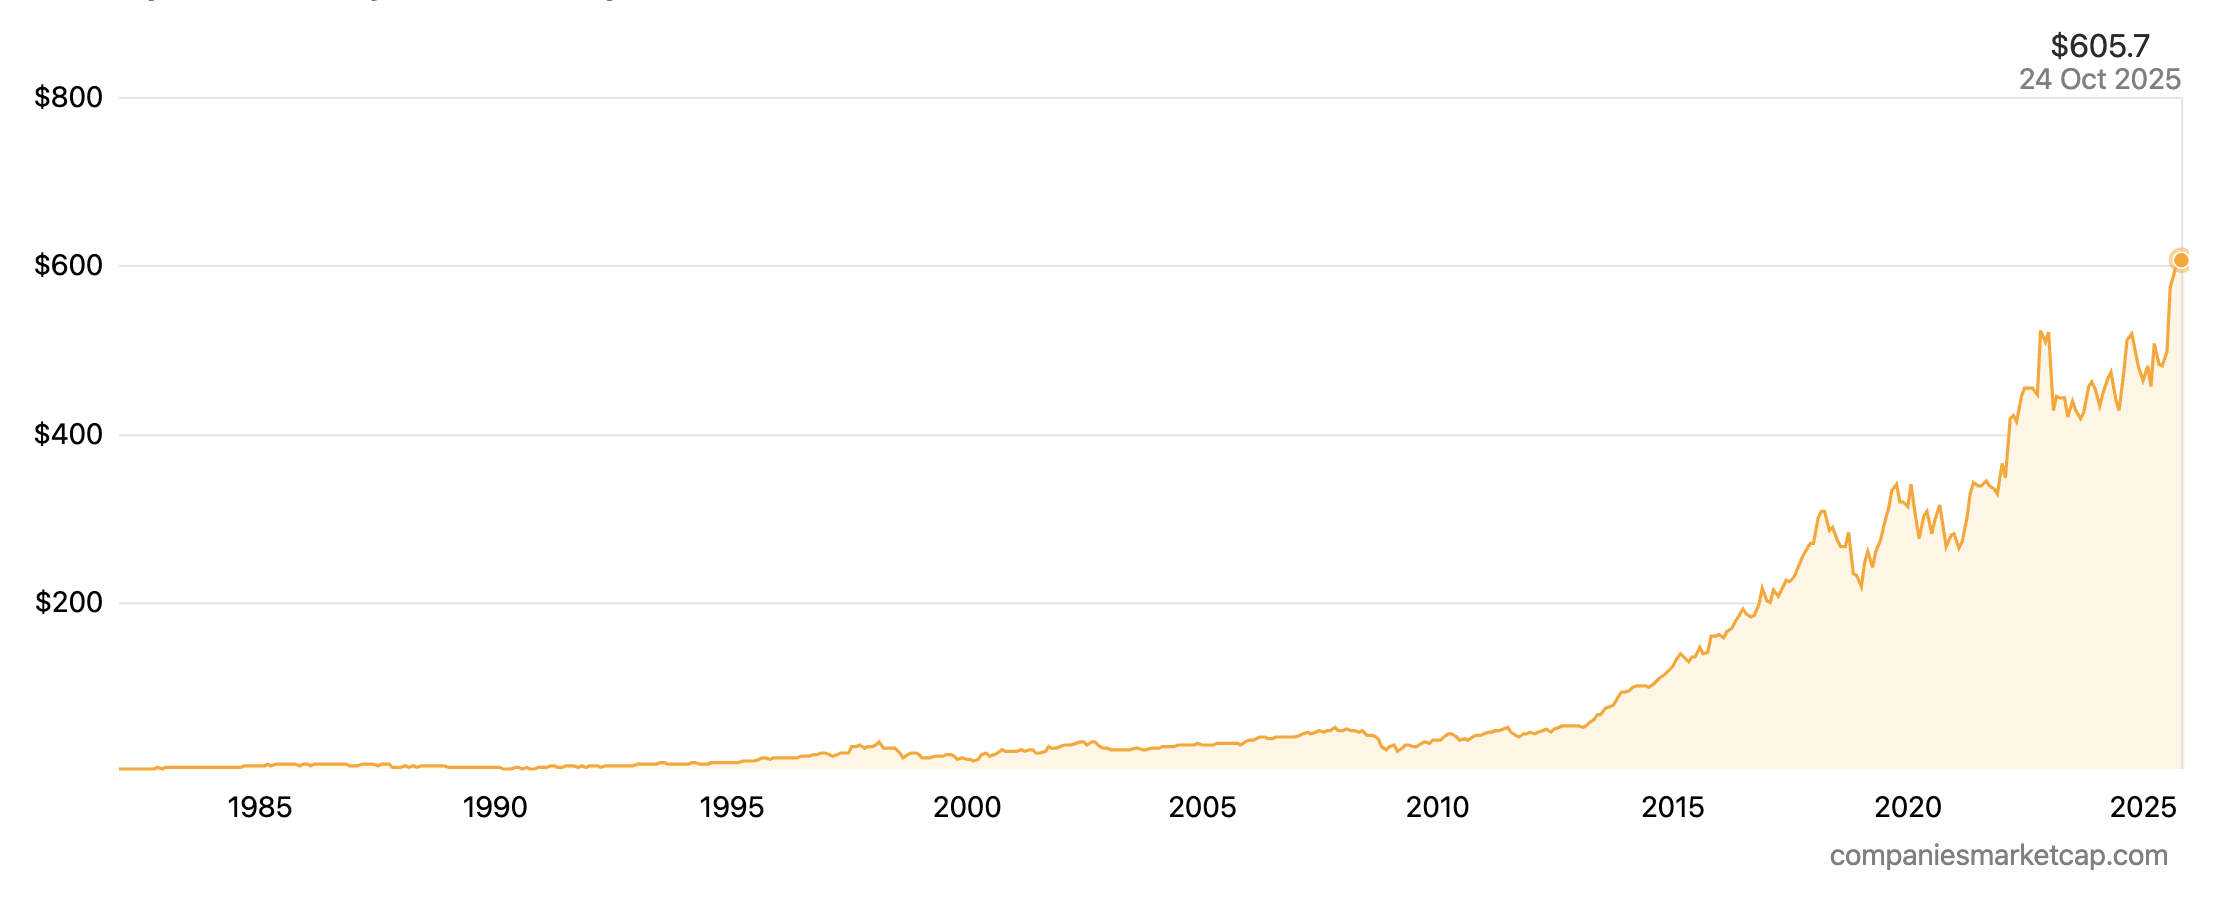
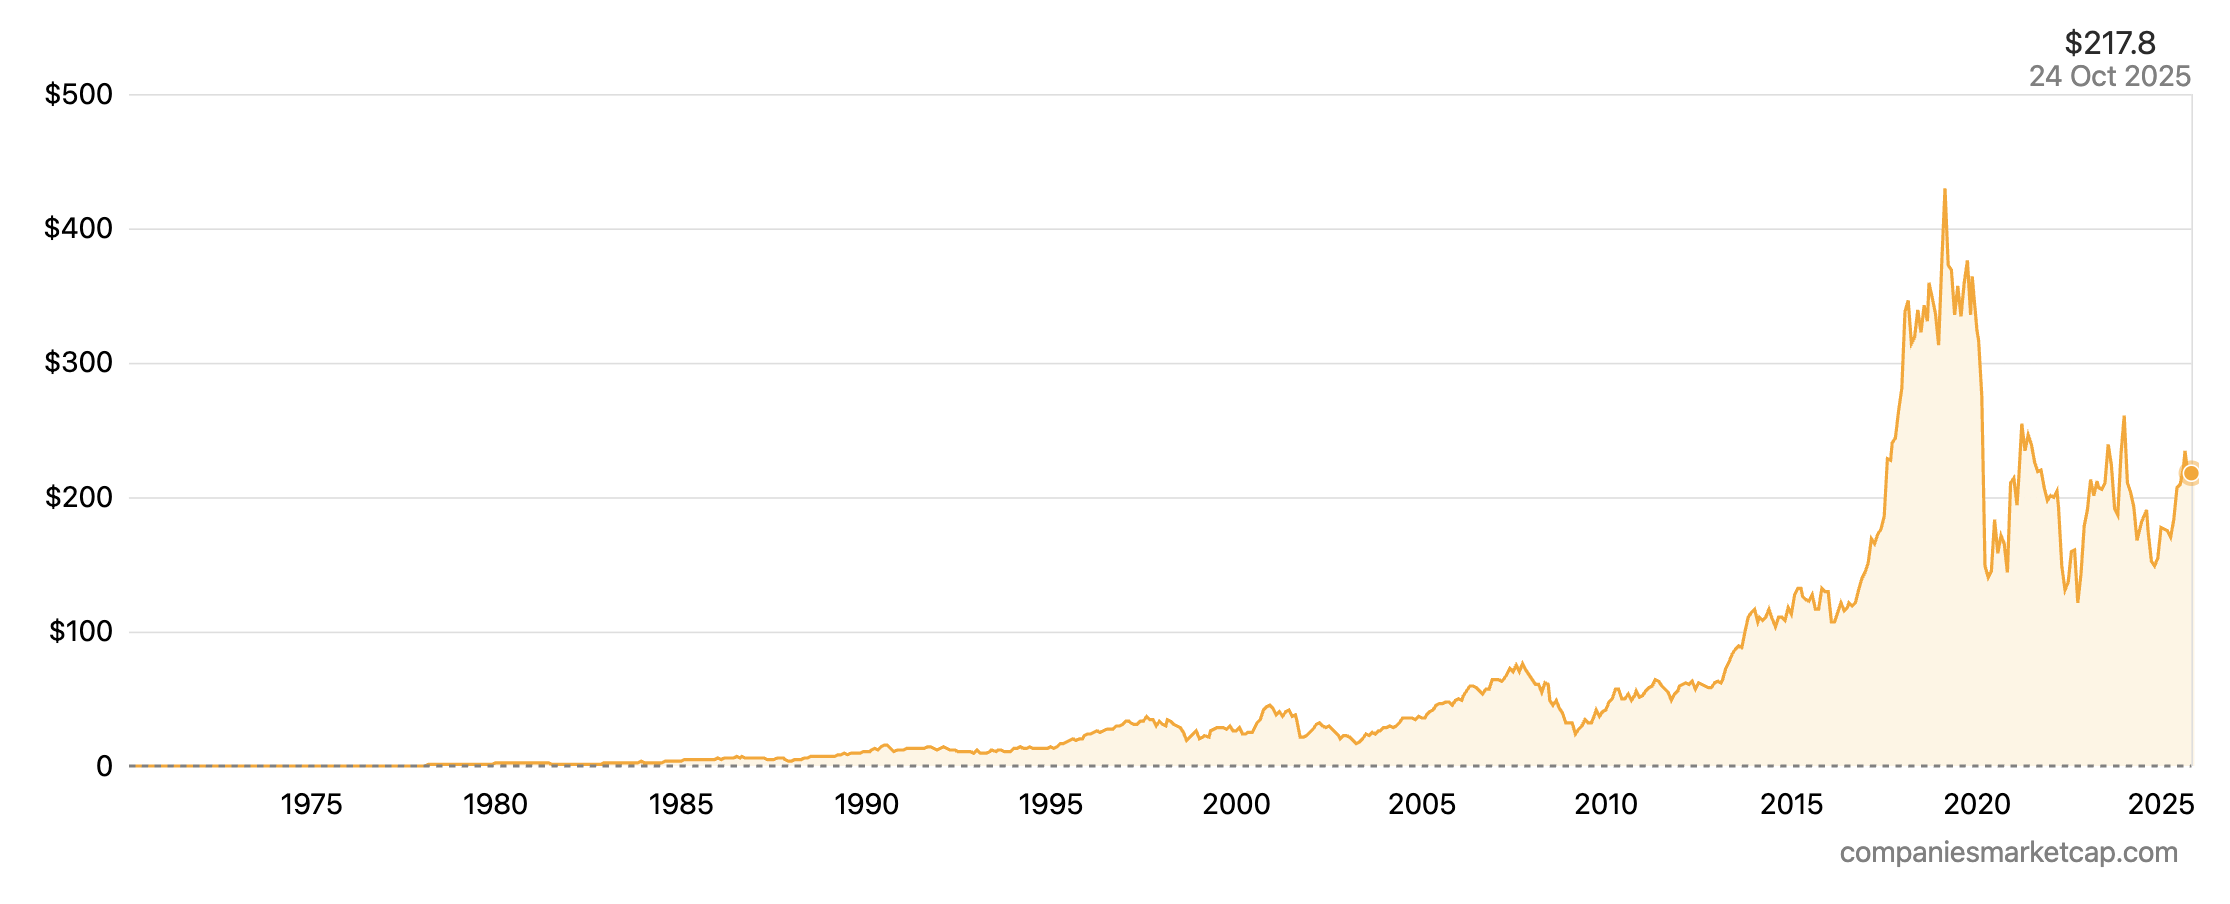
The picture below shows the Stock price history of RTX Corporation from 1970 to 2025.
Stock price history of RTX Corporation from 1970 to 2025
Source: Companies Market Cap.
RTX is uniquely positioned to capitalize on dual tailwinds: the long-term growth of global commercial aviation and the structural increase in global defense spending. The company’s strategy focuses on leveraging its vast technology portfolio to deliver innovative solutions in areas like connected battlespace and advanced propulsion. Wall Street analysts hold a consensus “Buy” rating for the stock, with 12-month price targets generally ranging from $150 to $200, reflecting confidence in the company’s strong market position and growth prospects.
Northrop Grumman Corporation (NOC)
Northrop Grumman Corporation has a storied history of pushing the boundaries of aerospace and defense technology, particularly in the realm of advanced aircraft and stealth capabilities. The modern company was formed in 1994 through the acquisition of Grumman Corporation by Northrop Corporation, bringing together the creators of the F-14 Tomcat and the B-2 Spirit stealth bomber. Under the leadership of Chair, CEO, and President Kathy Warden, Northrop Grumman has solidified its position as a technology-first company focused on delivering innovative systems for air, space, cyber, and sea domains.
Northrop Grumman’s business is organized into four technology-driven sectors : Aeronautics Systems, Space Systems, Mission Systems, and Defense Systems
- Aeronautics Systems: Generating $12.0 billion in revenue in fiscal year 2024, this segment is at the forefront of military aviation. Its flagship program is the B-21 Raider, the next-generation stealth bomber for the U.S. Air Force. It also produces autonomous systems like the Global Hawk surveillance drone and is a major subcontractor on the F-35 program.
- Space Systems: A major growth engine for the company, this segment ($11.7 billion in revenue) is a leading provider of satellites, launch vehicles, and missile defense systems. It is also the prime contractor for the Sentinel program, the replacement for the Minuteman III Intercontinental Ballistic Missile (ICBM) system.
- Mission Systems: With $11.4 billion in revenue, this segment is a leader in advanced radars, sensors, and cyber and electronic warfare systems. It provides the critical “eyes and ears” for a wide range of platforms.
- Defense Systems: This segment ($8.6 billion in revenue) focuses on battle management, command and control systems, and precision weapons, delivering integrated solutions to enhance mission readiness.
Northrop Grumman’s portfolio is uniquely concentrated in the most advanced, highest-priority, and often most secretive areas of U.S. defense strategy. The B-21 Raider and the Sentinel ICBM programs are the two cornerstones of the modernization of the U.S. nuclear triad, making them programs of paramount national importance that are highly insulated from budget pressures. This gives the company a powerful, often sole-source, position on franchises that will generate revenue for decades. However, this strategic focus on the technological frontier also carries significant execution risk. Developing unprecedented capabilities on fixed-price contracts, as seen with the recent loss provision on the B-21’s low-rate initial production (LRIP) phase, can lead to substantial financial charges. An investment in Northrop Grumman is therefore a bet on its unique technological supremacy and its ability to navigate the immense complexity and risk inherent in pioneering the future of defense.
Logo of Northrop Grumman![]()
Source: the company.
The company’s recent financial results reflect this dual reality of strong demand and program-specific challenges. In the second quarter of 2025, Northrop Grumman reported sales of $10.4 billion, a 1% increase year-over-year. However, net earnings were impacted by a significant loss provision on the B-21 program.
Despite this, demand for the company’s products remains exceptionally strong. Northrop Grumman ended the first quarter of 2025 with a record order backlog of $92.8 billion, driven by large awards for restricted programs in its space and aeronautics segments. Recent major contracts include an $801 million indefinite-delivery/indefinite-quantity (IDIQ) award for combat air forces distributed mission operations services and a $39 million contract for electronic warfare support.
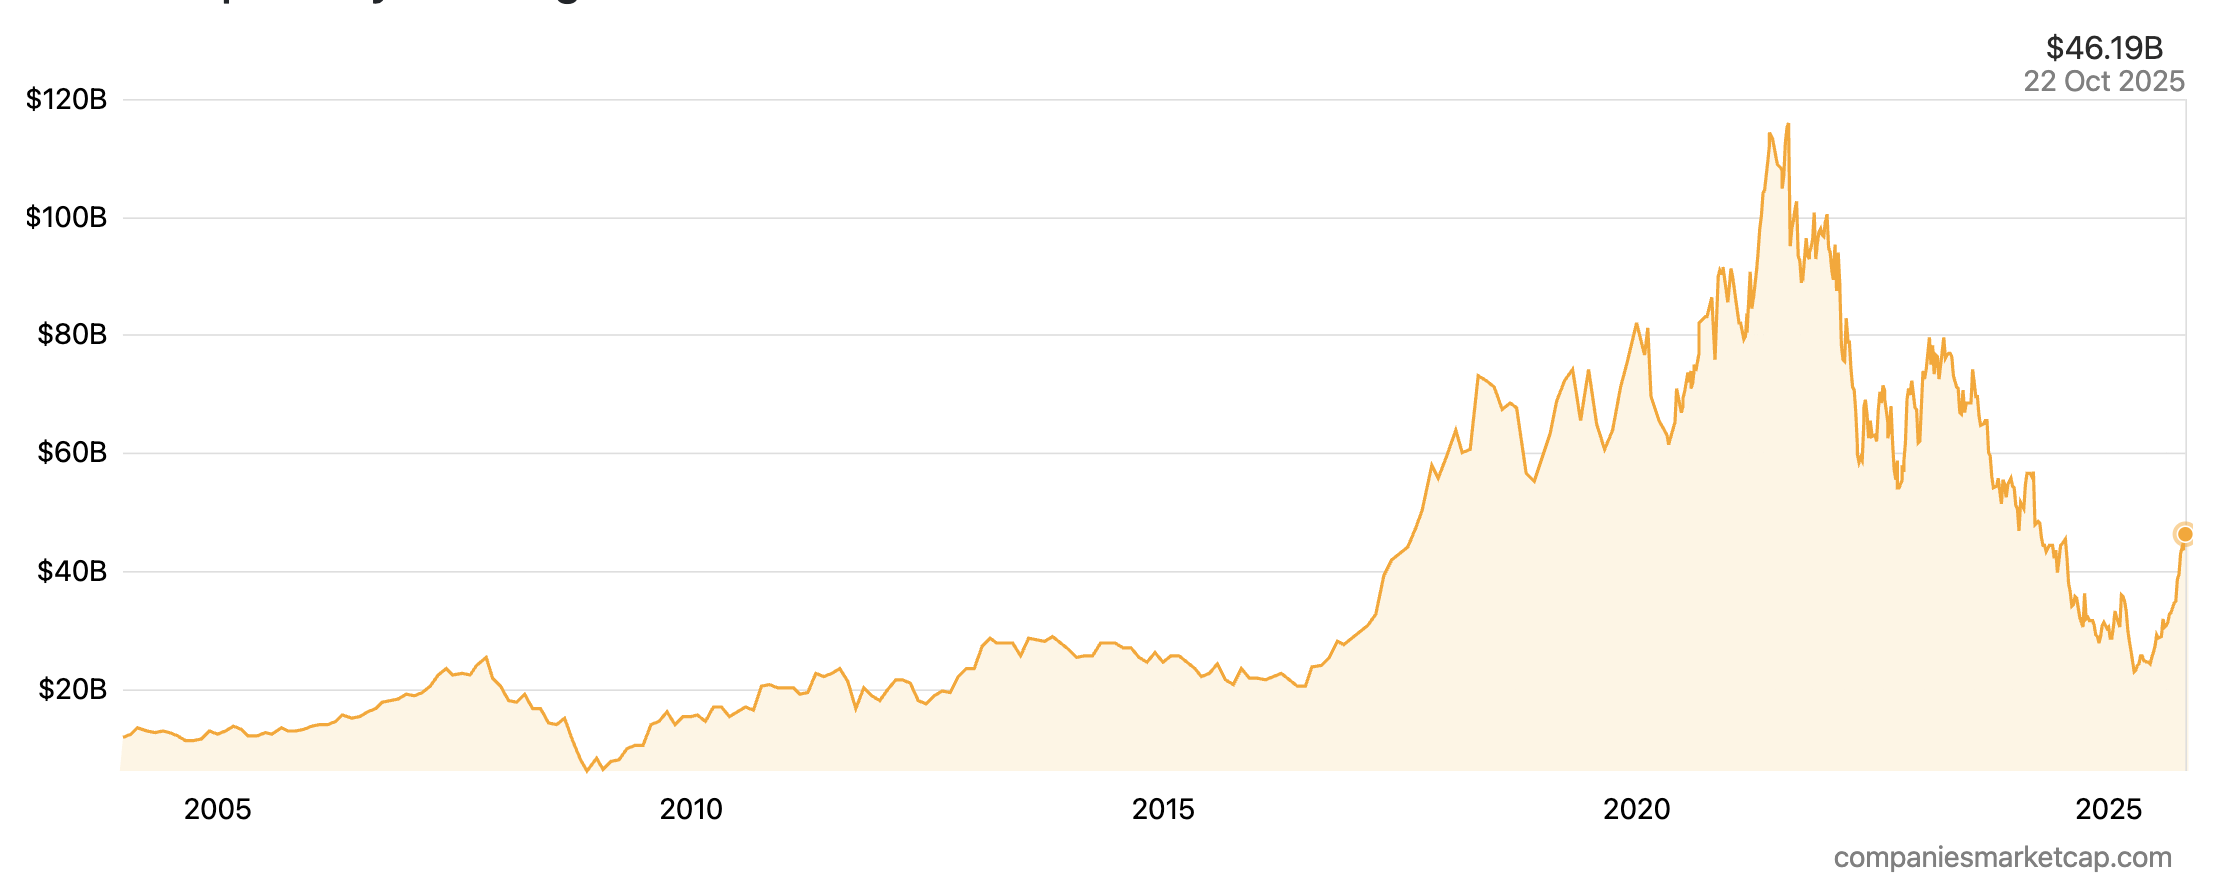
The picture below shows the market capitalization history of Northrop Grumman Corporation from 1996 to 2025.
Market cap history of Northrop Grumman Corporation from 1996 to 2025.
Source: Companies Market Cap.
The picture below shows the Stock price history of Northrop Grumman from 1981 to 2025.
Stock price history of Northrop Grumman from 1981 to 2025
Source: Companies Market Cap.
Northrop Grumman’s strategic future is inextricably linked to its successful execution of the nation’s most critical defense modernization programs. Its leadership in stealth, space, and strategic deterrence positions it at the heart of the Pentagon’s long-term investment strategy. The financial analyst community maintains a consensus “Buy” rating on the stock, with an average 12-month price target of approximately $613, indicating confidence in the long-term value of its unique portfolio despite near-term program risks.
General Dynamics Corporation (GD)
General Dynamics Corporation has one of the longest and most distinguished histories in the defense industry, with roots tracing back to the Holland Torpedo Boat Company in 1899, which built the U.S. Navy’s first modern submarines. Incorporated in its modern form in 1952, the company has evolved into a global aerospace and defense powerhouse with a uniquely diversified portfolio. Under the leadership of Chairman and CEO Phebe Novakovic, General Dynamics is renowned for its relentless focus on operational excellence and strong cash generation.
General Dynamics’ strength lies in its balanced portfolio of four distinct business groups, which includes a world-class commercial business alongside its core defense franchises : Aerospace, Marine Systems, Combat Systems, and Technologies.
- Aerospace: This segment is home to Gulfstream Aerospace, the undisputed leader in the large-cabin, long-range business jet market. Gulfstream aircraft are synonymous with performance, luxury, and technological innovation.
- Marine Systems: This segment is a cornerstone of the U.S. naval industrial base. Through its Electric Boat and Bath Iron Works shipyards, General Dynamics is the prime contractor for the nation’s most critical naval platforms, including Virginia-class attack submarines, the next-generation Columbia-class ballistic missile submarines, and Arleigh Burke-class destroyers.
- Combat Systems: A global leader in land combat vehicles, this segment produces the Abrams main battle tank, the Stryker family of wheeled combat vehicles, and a wide range of weapons systems and munitions.
- Technologies: This segment provides a broad array of mission-critical information technology (IT) services, C4ISR (Command, Control, Communications, Computers, Intelligence, Surveillance, and Reconnaissance) solutions, and mobile communication systems to defense, intelligence, and federal civilian customers.
This unique corporate structure, which pairs a top-tier commercial business with indispensable defense franchises, creates a remarkably resilient business model. The market for Gulfstream business jets is tied to corporate profitability and global wealth creation, while the defense segments are driven by government budgets and the geopolitical security environment. These cycles are not perfectly correlated, allowing the segments to provide a natural hedge for one another. This diversification provides a level of earnings stability that is unique among the top defense primes, smoothing out the cyclicality inherent in both markets.
Logo of General Dynamics![]()
Source: the company.
General Dynamics’ recent financial results highlight the strength of this diversified model. In the second quarter of 2025, the company reported strong earnings of $3.74 per share, beating analyst consensus estimates, with robust revenue growth driven by the Marine Systems segment.
The company’s future revenue is secured by a record-breaking order backlog, which surged to $103.7 billion at the end of Q2 2025, a 14% increase from the prior year. This growth was fueled by major, multi-year contracts for Virginia-class submarine construction. The company continues to win significant contracts across its portfolio, including a $5.57 billion contract for mission partner environment services and a $335 million award for submarine fire control systems.
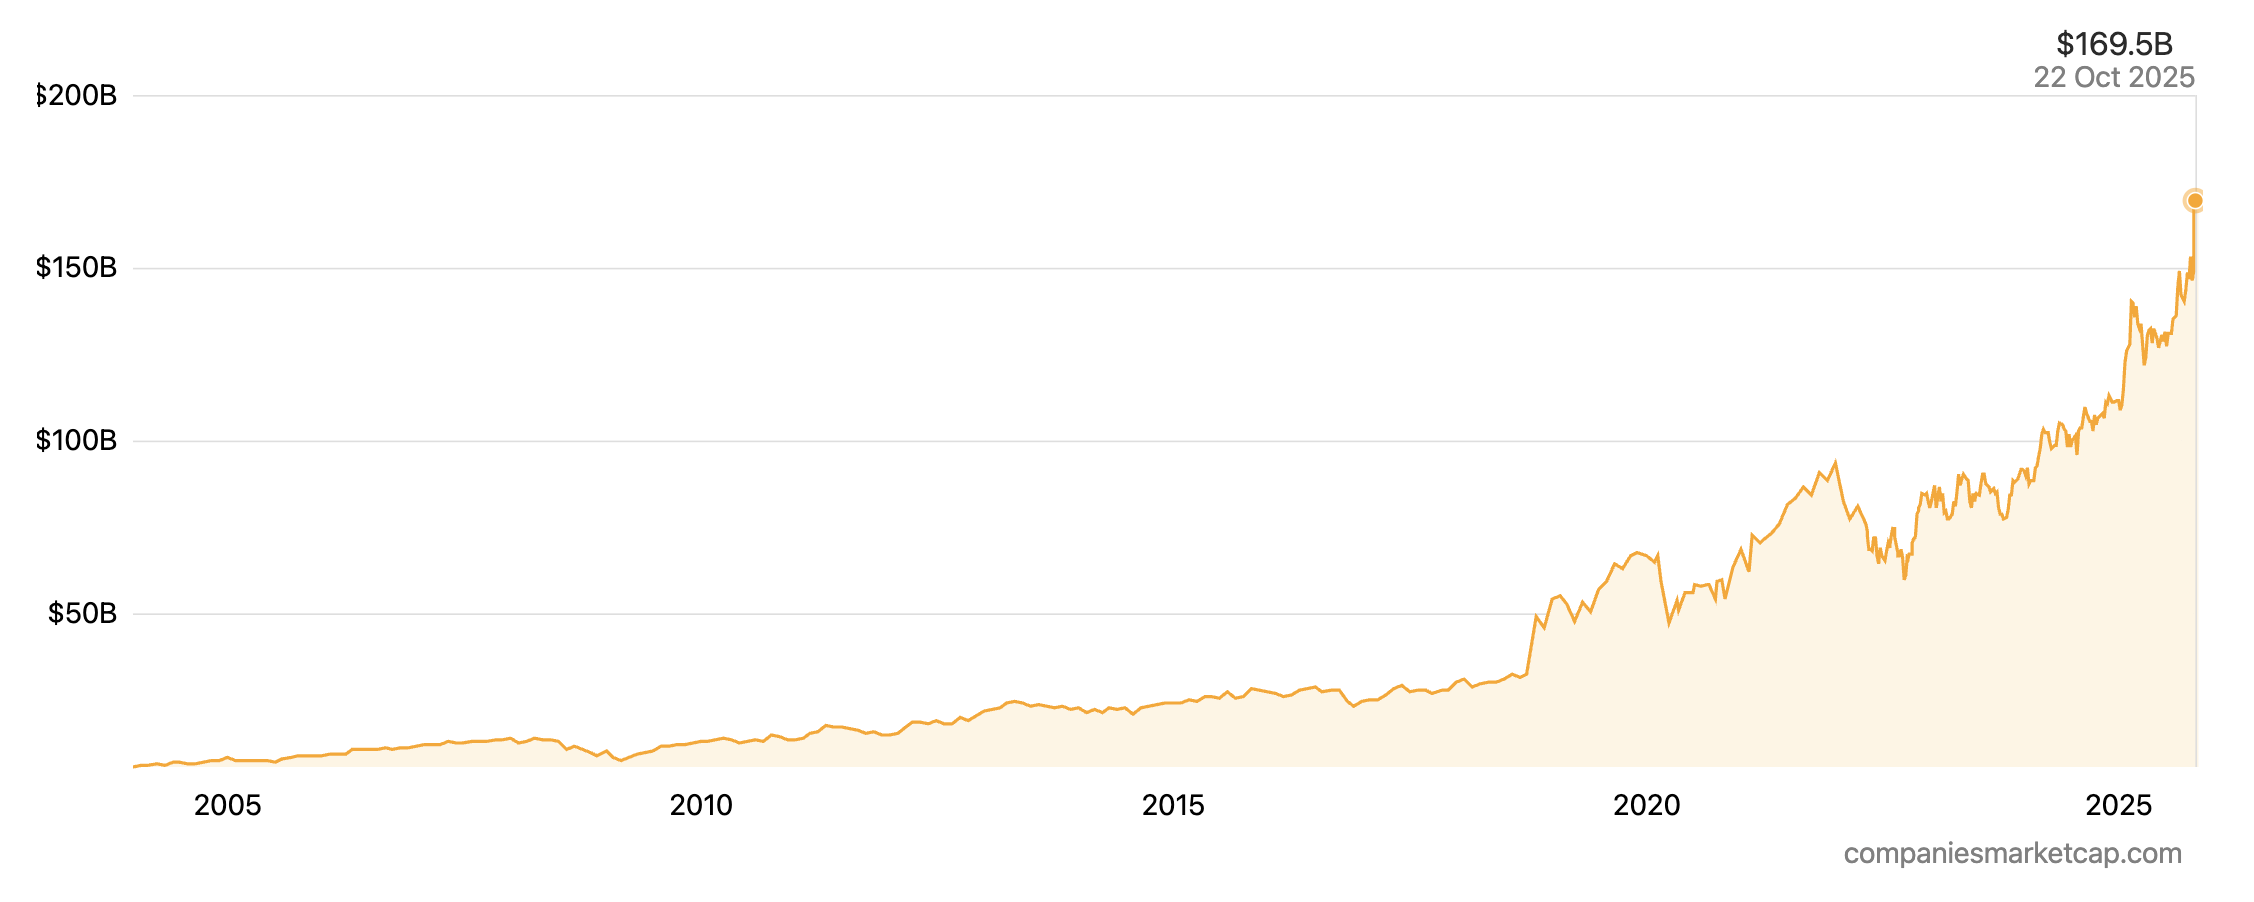
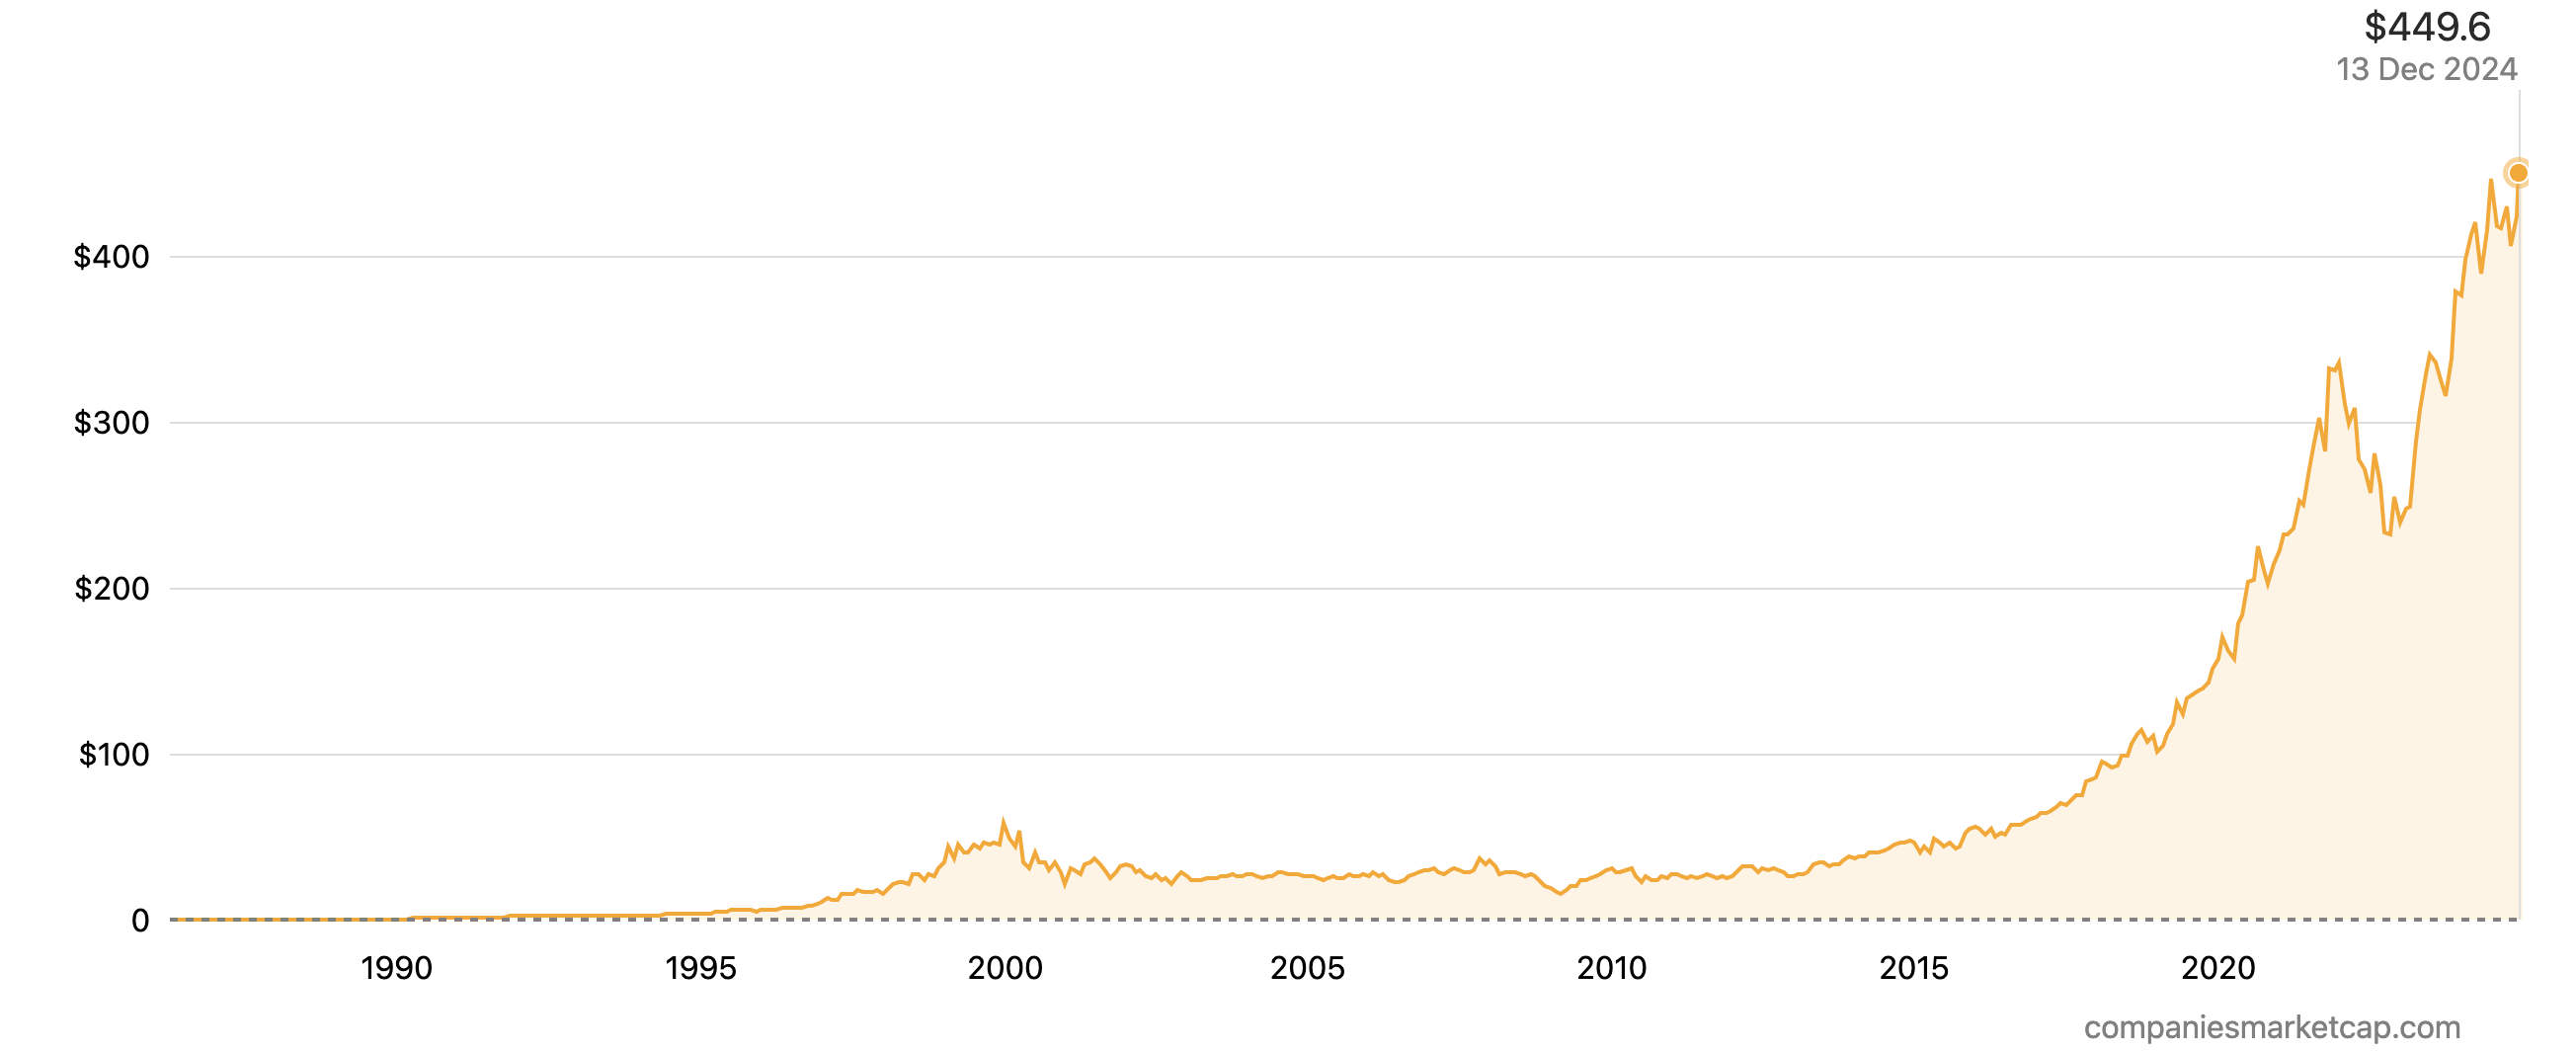
The picture below shows the market capitalization history of General Dynamics Corporation from 1996 to 2025.
Market cap history of General Dynamics Corporation from 1996 to 2025.
Source: Companies Market Cap.
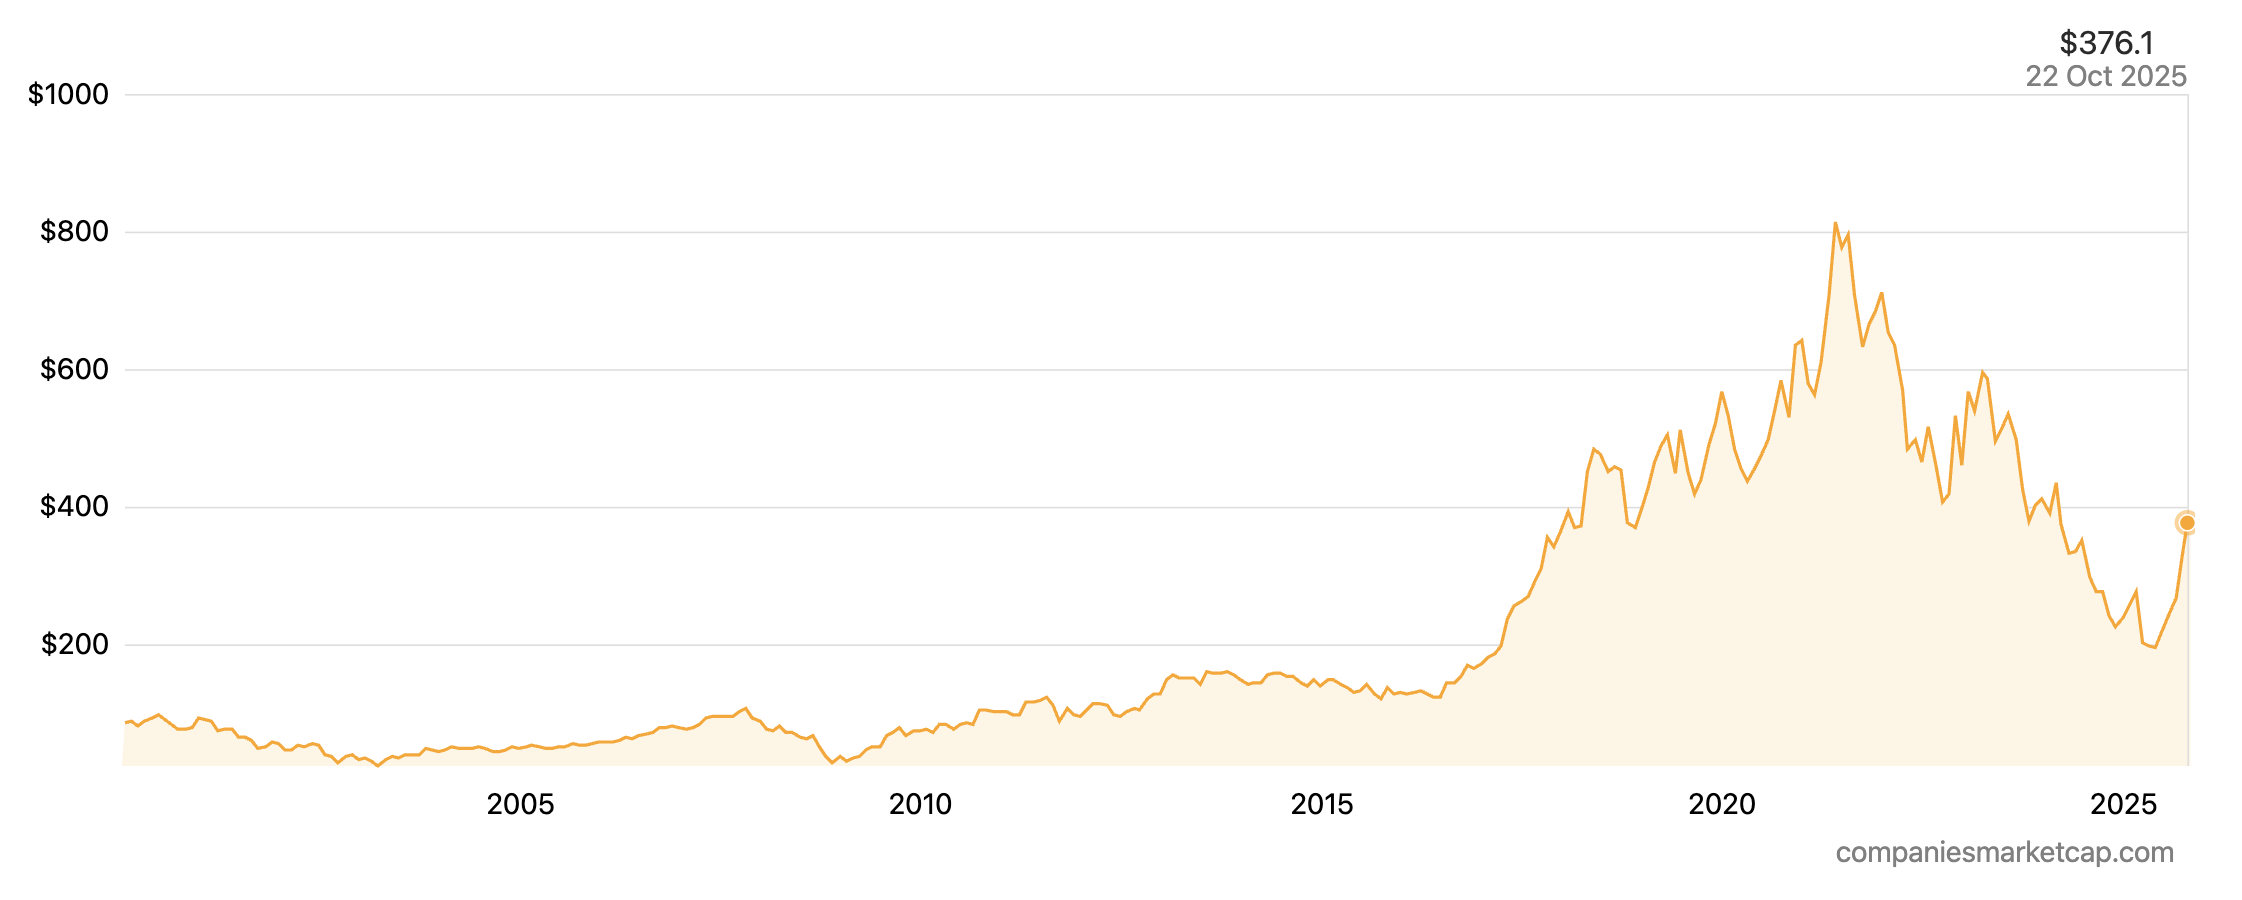
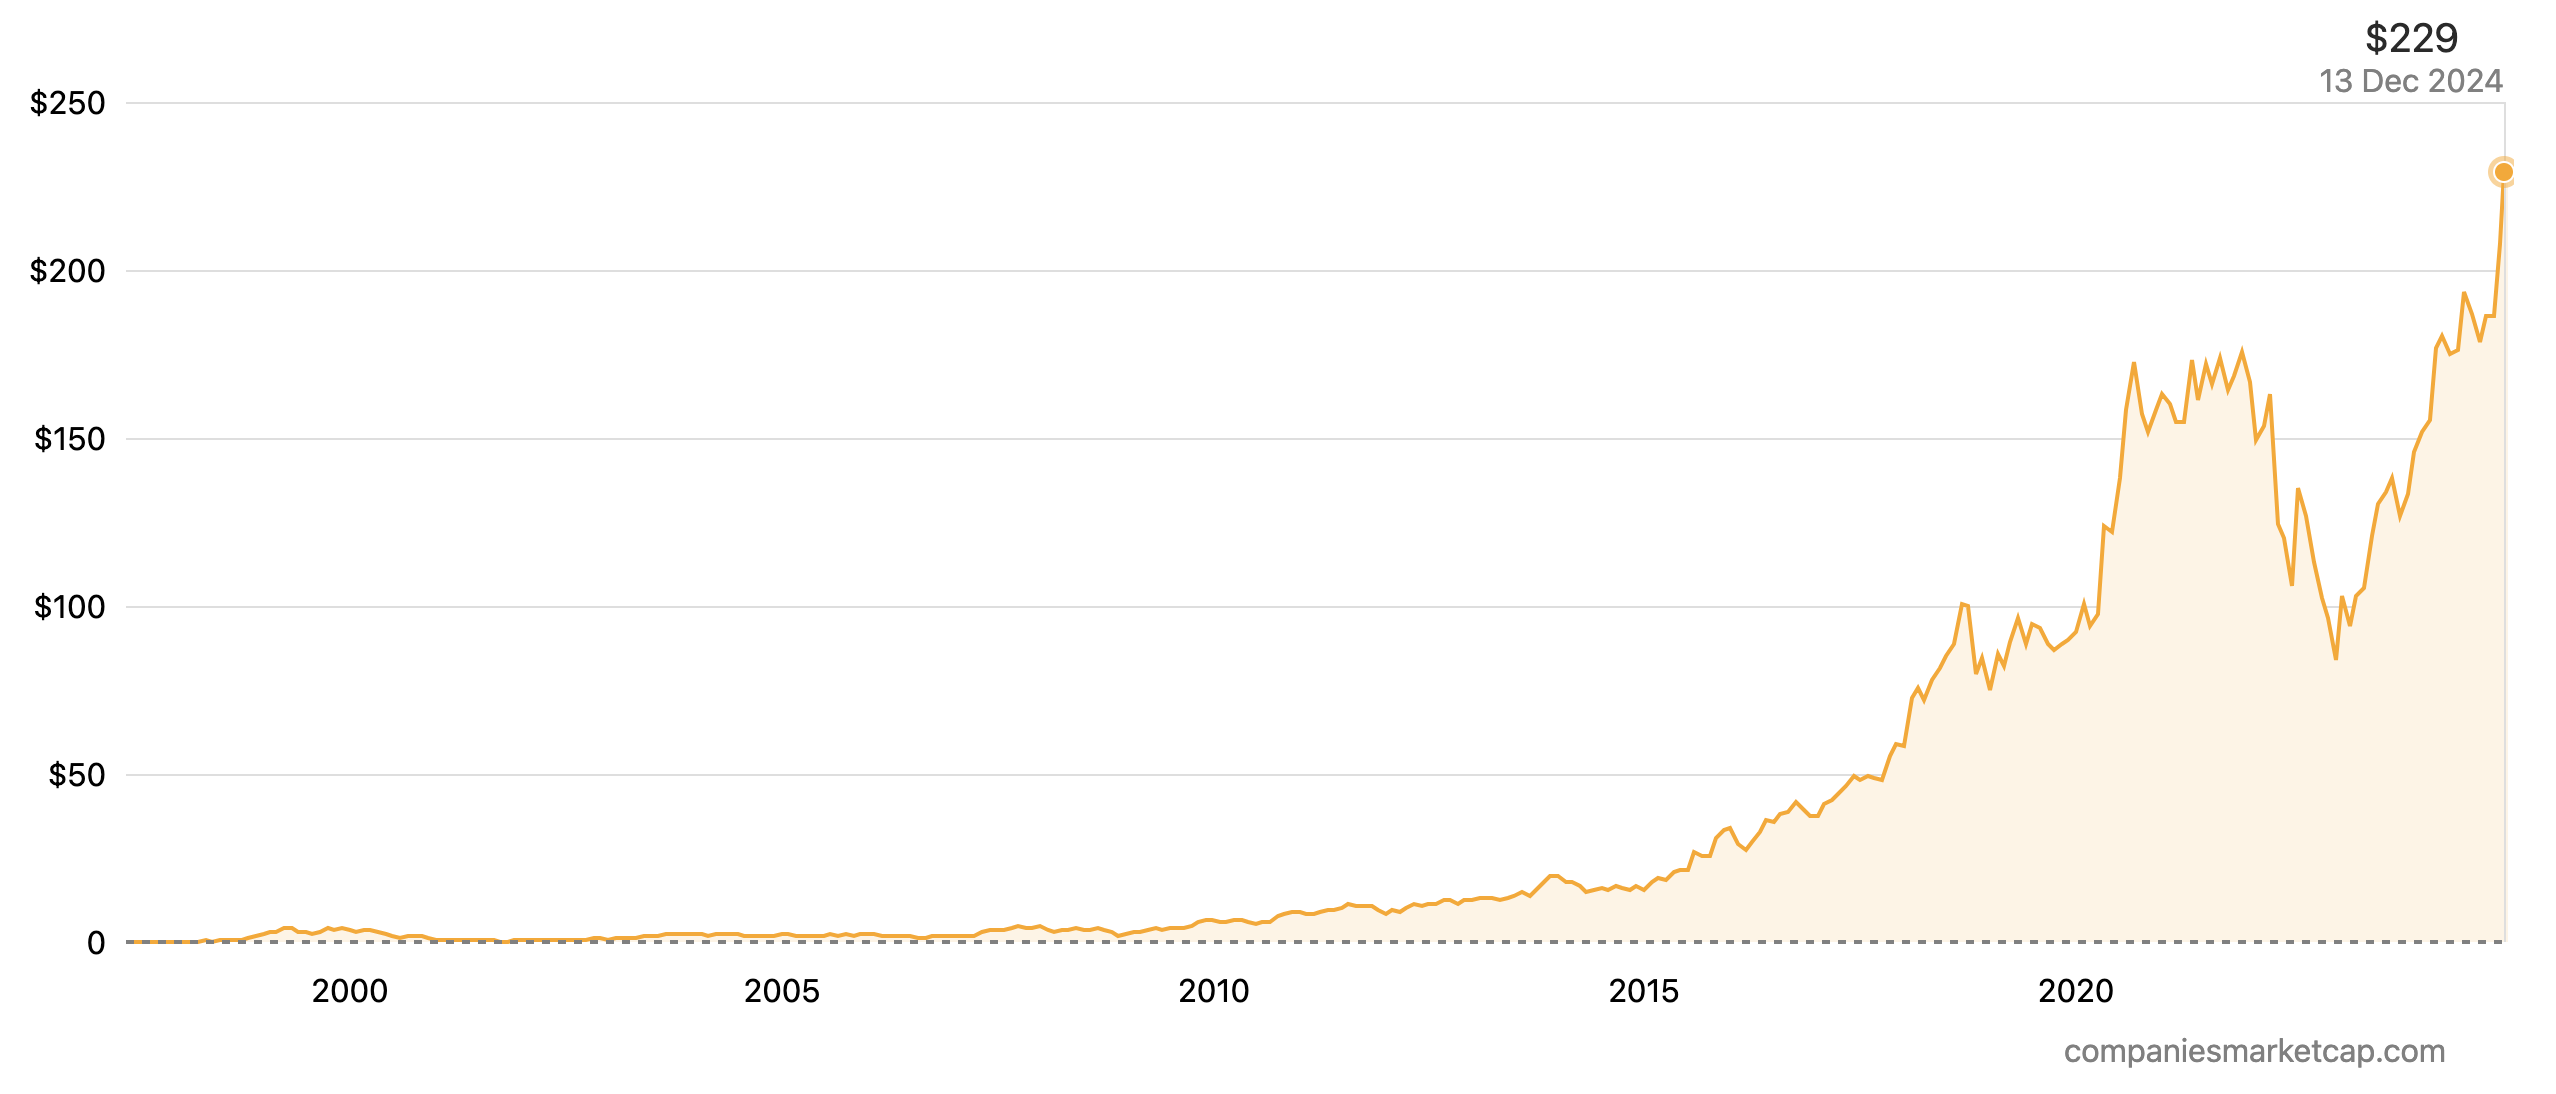
The picture below shows the Stock price history of General Dynamics from 1970 to 2025.
Stock price history of General Dynamics from 1970 to 2025
Source: Companies Market Cap.
General Dynamics’ strategy is focused on operational execution and disciplined capital deployment. The company is making significant capital investments in its shipyards to support the U.S. Navy’s multi-decade shipbuilding plan while simultaneously investing in the development of the next generation of Gulfstream aircraft. Analysts hold a consensus “Buy” rating on the stock, with an average 12-month price target of approximately $325, reflecting confidence in the company’s strong execution, massive backlog, and balanced business model.
The Boeing Company – Defense, Space & Security (BDS)
The Boeing Company, founded by William Boeing in 1916, is one of the most iconic names in aerospace history. While best known for its commercial airliners, its Defense, Space & Security (BDS) unit is a formidable global enterprise in its own right. BDS is a leading developer and manufacturer of military aircraft, satellites, weapons, and space exploration systems, serving as a critical partner to the U.S. government and international allies.
The BDS portfolio is vast and covers nearly every aspect of military aerospace and space operations : Military Aircraft, Space and Launch, and Weapons and Systems.
- Military Aircraft: BDS produces a wide range of combat, transport, and special mission aircraft. Key platforms include the F/A-18 Super Hornet and F-15EX Eagle II fighter jets, the P-8 Poseidon maritime patrol aircraft, the KC-46 Pegasus aerial refueling tanker, and the AH-64 Apache attack helicopter.
- Space and Launch: This division is responsible for government and commercial satellites, the Space Launch System (SLS) rocket that powers NASA’s Artemis missions, and the CST-100 Starliner commercial crew vehicle.
- Weapons and Systems: BDS also develops and produces a variety of munitions and integrated systems, contributing to missile defense and other critical capabilities.
In the context of the broader Boeing enterprise, the Defense, Space & Security segment plays a crucial role as a stabilizing force. While the much larger Commercial Airplanes division has faced significant operational turmoil and financial volatility in recent years, BDS provides a steady and predictable stream of revenue and cash flow backed by long-term government contracts. While the BDS backlog of approximately $62 billion is dwarfed by the commercial backlog, its profitability is more consistent and less susceptible to the extreme cyclicality of the airline industry. This makes BDS a critical, though often overlooked, pillar of the overall Boeing investment case, providing a financial buffer that allows the commercial side to navigate its ongoing recover.
Logo of Boeing![]()
Source: the company.
Boeing’s overall financial results have been on an improving trajectory. For the second quarter of 2025, the parent company reported a 35% year-over-year increase in revenue to $22.75 billion, although it still posted a net loss. The BDS segment contributed $6.61 billion in revenue for the quarter.
The total company backlog is a massive $619 billion, overwhelmingly dominated by orders for commercial aircraft. The BDS backlog stood at $61.57 billion at the end of the first quarter of 2025, providing solid near-term revenue visibility. BDS continues to secure important contracts, such as a recent $2.39 billion award for 15 KC-46A tanker aircraft for the U.S. Air Force.
The picture below shows the market capitalization history of Boeing from 1996 to 2025.
Market cap history of Boeing from 1996 to 2025
Source: Companies Market Cap.
The picture below shows the stock price history of Boeing from 1970 to 2025.
Stock price history of Boeing from 1970 to 2025
Source: Companies Market Cap.
The primary strategic challenge for Boeing is to stabilize its production systems, improve quality control, and restore confidence with its customers and regulators. The BDS segment is a key part of this recovery, providing a foundation of stable government work. The analyst community currently holds a consensus “Buy” rating on Boeing’s stock (BA), with an average 12-month price target of around $240. This optimism is largely predicated on the expected long-term recovery of the commercial aviation market, supported by the steady performance of the defense and services businesses.
Conclusion
The global defense sector is in the midst of a historic upcycle, driven by a return to great power competition and the urgent need for technological modernization. The five contractors at the apex of this industry—Lockheed Martin, RTX, Northrop Grumman, General Dynamics, and Boeing—are uniquely positioned to benefit from this long-term trend, each leveraging a distinct set of capabilities and strategic advantages..
Why should I be interested in this post?
Finance students should delve into the defense industry and its leading contractors to understand unique financial dynamics shaped by government contracts, long-term program cycles, and significant geopolitical influences. Studying this sector provides valuable insights into valuing companies with substantial order backlogs, analyzing industries with high barriers to entry and concentrated customer bases, assessing the financial implications of large-scale R&D investments, and understanding how global security trends directly impact corporate performance and sector stability.
Related posts on the SimTrade blog
▶ Nithisha CHALLA Top 5 companies by market capitalization in the US
▶ Nithisha CHALLA Market Capitalization
▶ Nithisha CHALLA The NASDAQ index
Useful resources
Defense News Top 100 Top 100 | Defense News
SIPRI Trends in World Military Expenditure, 2024 | SIPRI
Lockheed Martin Investor Relations Investor Overview | Lockheed Martin Corp.
RTX Investor Relations Investors :: RTX
Northrop Grumman Investor Relations Investor Home – Northrop Grumman
General Dynamics Investor Relations Investor Relations – General Dynamics
About the author
The article was written in October 2025 by Nithisha CHALLA (ESSEC Business School, Grande Ecole Program – Master in Management (MiM), 2021-2024).
▶ Read all posts written by Nithisha CHALLA