
Statista

In this article, Nithisha CHALLA (ESSEC Business School, Grande Ecole Program – Master in Management (MiM), 2021-2024) explores Statista, its origin, features, applications, and its value as a go-to resource for data and insights.
Introduction
Statista is a leading provider of market and consumer data, presenting information in an intuitive, visually appealing format. Known for its user-friendly interface and comprehensive coverage, Statista aggregates data from over 22,500 trusted sources, making it a one-stop shop for global statistics, market trends, and industry reports.
Moreover, familiarity with Statista demonstrates to employers a capacity for leveraging data to inform decisions—a skill highly sought after in finance, consulting, and analytics roles. By mastering Statista, students not only enhance their academic experience but also gain a competitive edge in their professional journey.
The History of Statista
Founded in 2007 in Hamburg, Germany, Statista was created to simplify access to data and transform complex information into actionable insights. The platform initially focused on German-speaking markets but quickly expanded to serve a global audience. Over the years, Statista has grown into one of the largest statistics portals worldwide, providing data in fields ranging from technology and finance to healthcare and consumer behavior.
Logo of Statista
![]()
Source: the company.
Statista’s innovative approach to presenting data visually has set it apart. By combining academic rigor with business-friendly accessibility, the platform has become indispensable for decision-makers across industries.
Key Features of Statista
Certain key features of Statista make it very useful as a database such as its Extensive Data Coverage, Interactive Visualizations, Comprehensive Reports, Global Consumer Survey, and Ease of Access
As an example, the picture below presents the Statista website Interface.
Statista website interface
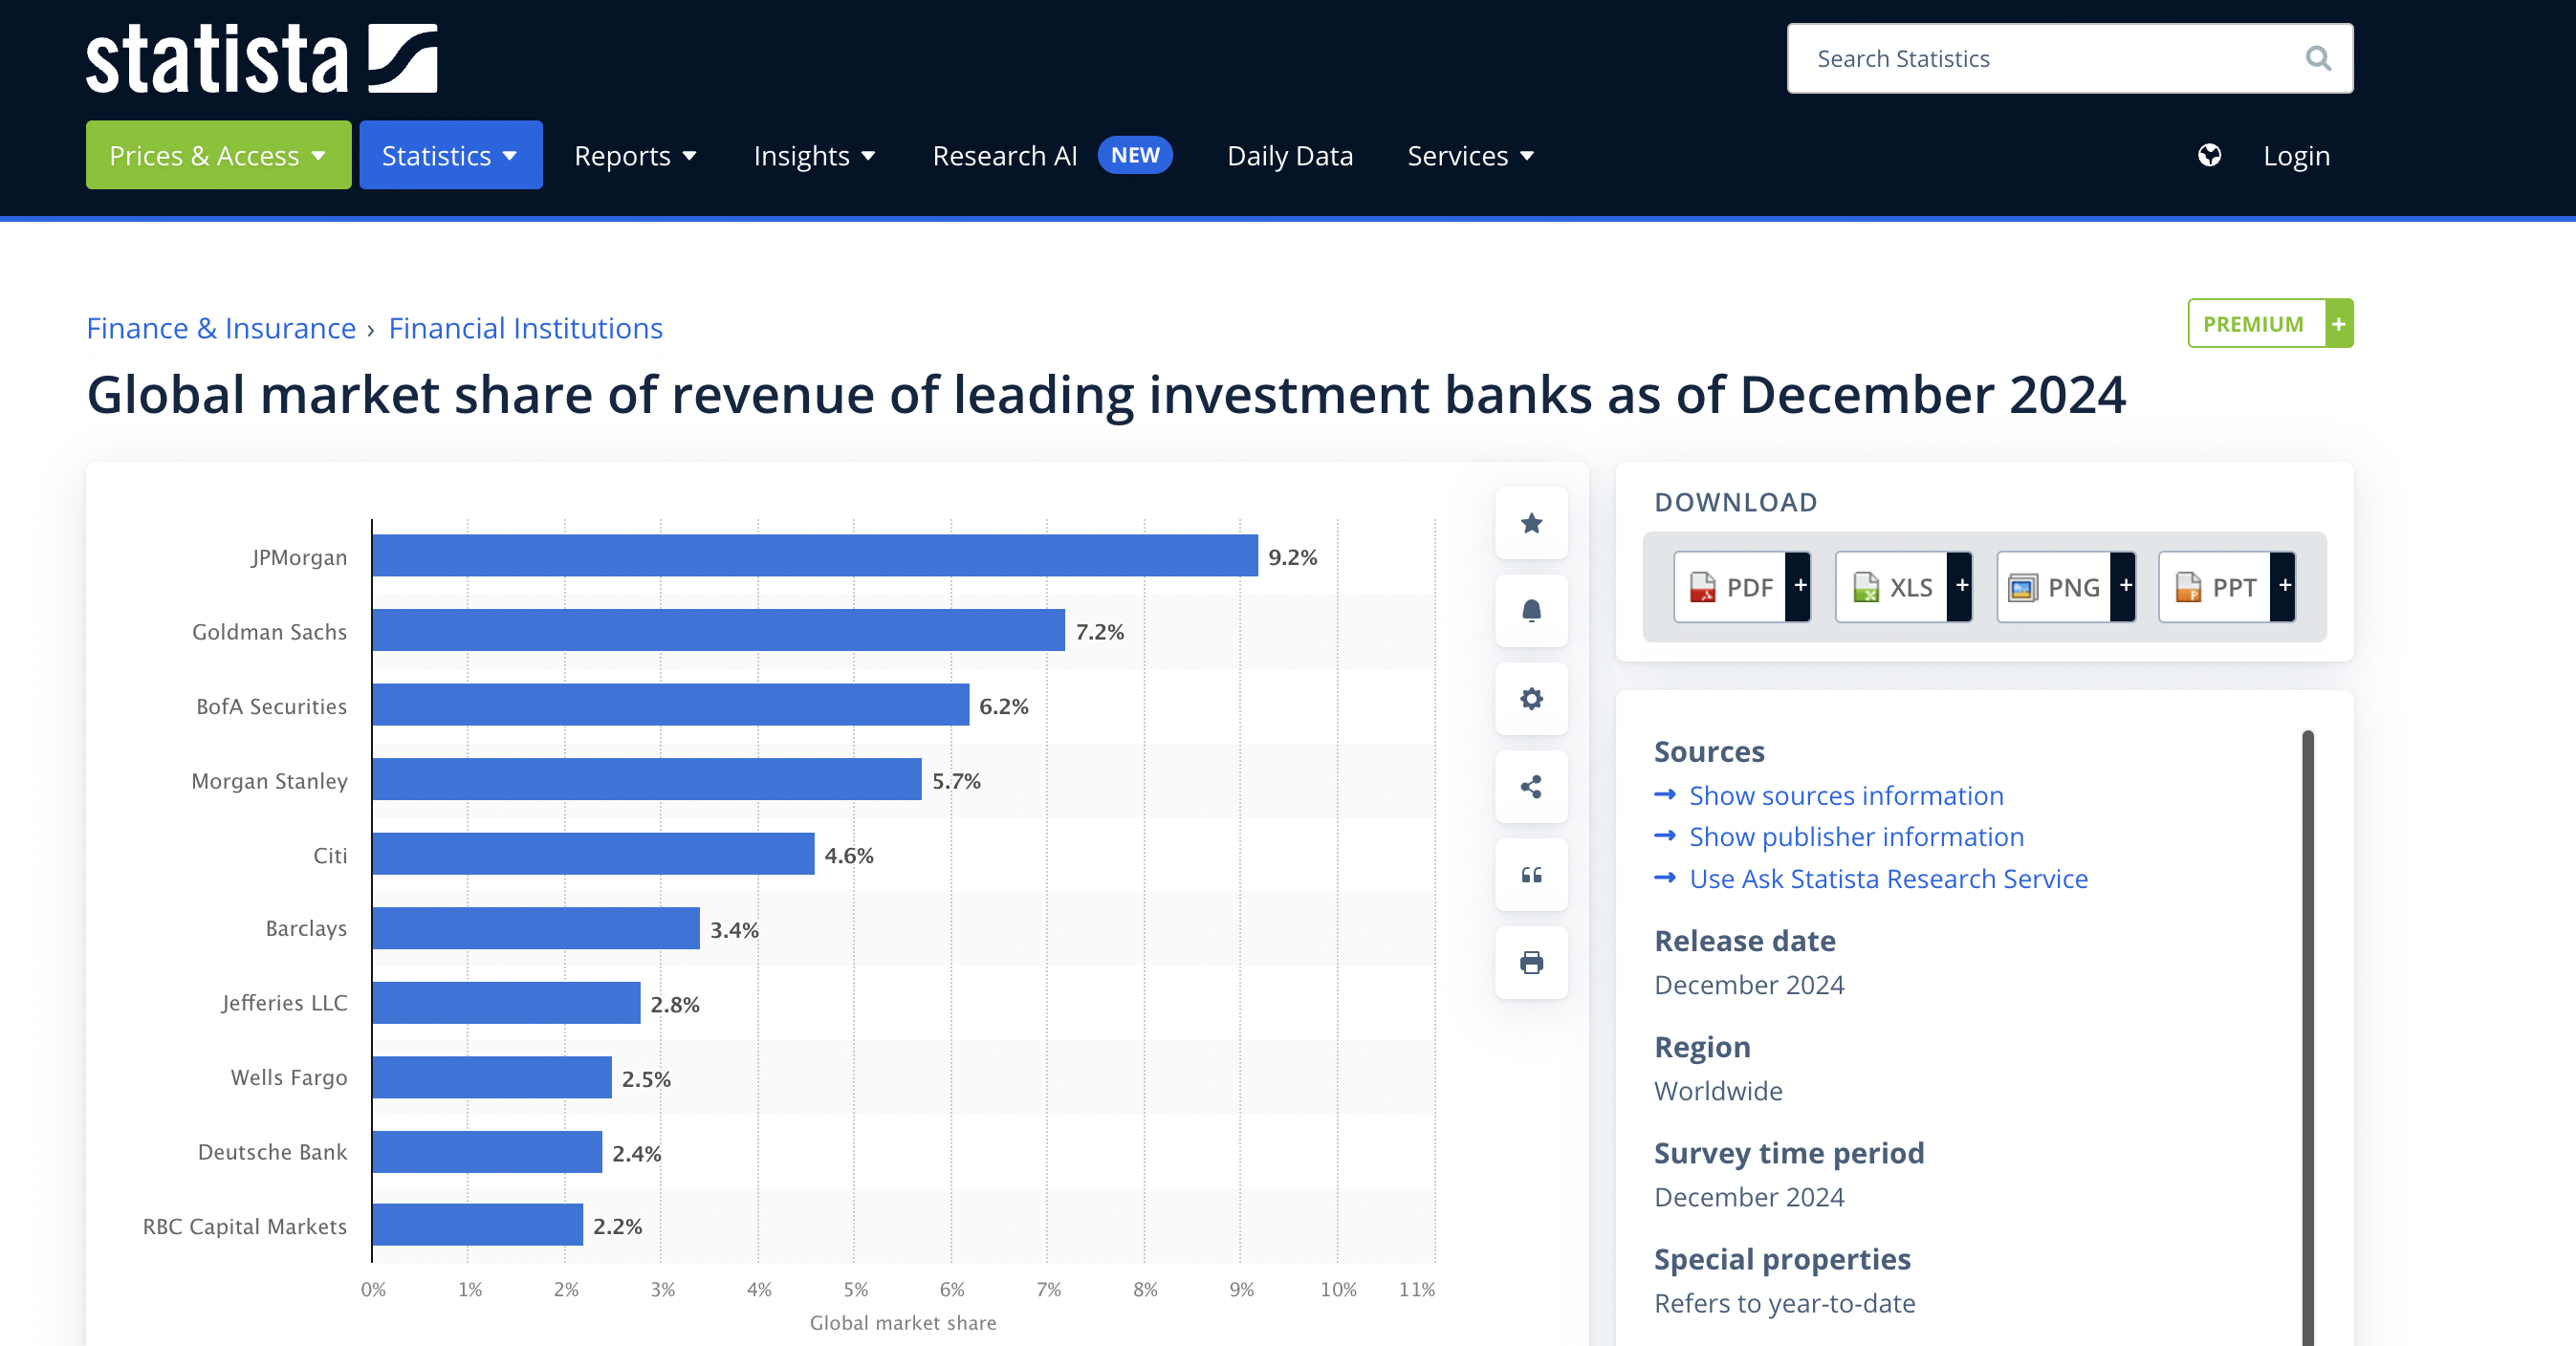
Source: the company.
Extensive Financial Data
Statista, a renowned online statistics and market research platform offers a treasure trove of data for professionals, researchers, and students alike. Statista offers over 1.5 million statistics across 170 industries and 150+ countries. It includes data on demographics, consumer behavior, market trends, and economic indicators.
Interactive Visualizations
Statista provides charts, infographics, and dashboards to make data interpretation easier. Its users can customize visualizations to suit their needs.
Comprehensive Reports
In Statista, industry reports, market forecasts, and trend analyses are available. There are also special reports that focus on emerging topics like digitalization, sustainability, and AI.
Global Consumer Survey
Statista has a unique feature that offers insights into consumer attitudes and preferences across regions and industries.
Ease of Accessibility to data
Statista supports export in multiple formats, including PDF, Excel, and PowerPoint, for seamless integration into presentations and reports. And it features a powerful search engine and intuitive navigation tools.
Applications in Finance and Business with Statista
There are several applications of Statista in finance and business such as Market Research, Strategic Planning, academic research, and Public Policy, and Advocacy
As an example, the picture below presents the news about the monthly variation of the harmonized consumer price index (HICP) in France from January 2021 to April 2024.
Statista news on harmonized consumer price index(HICP)
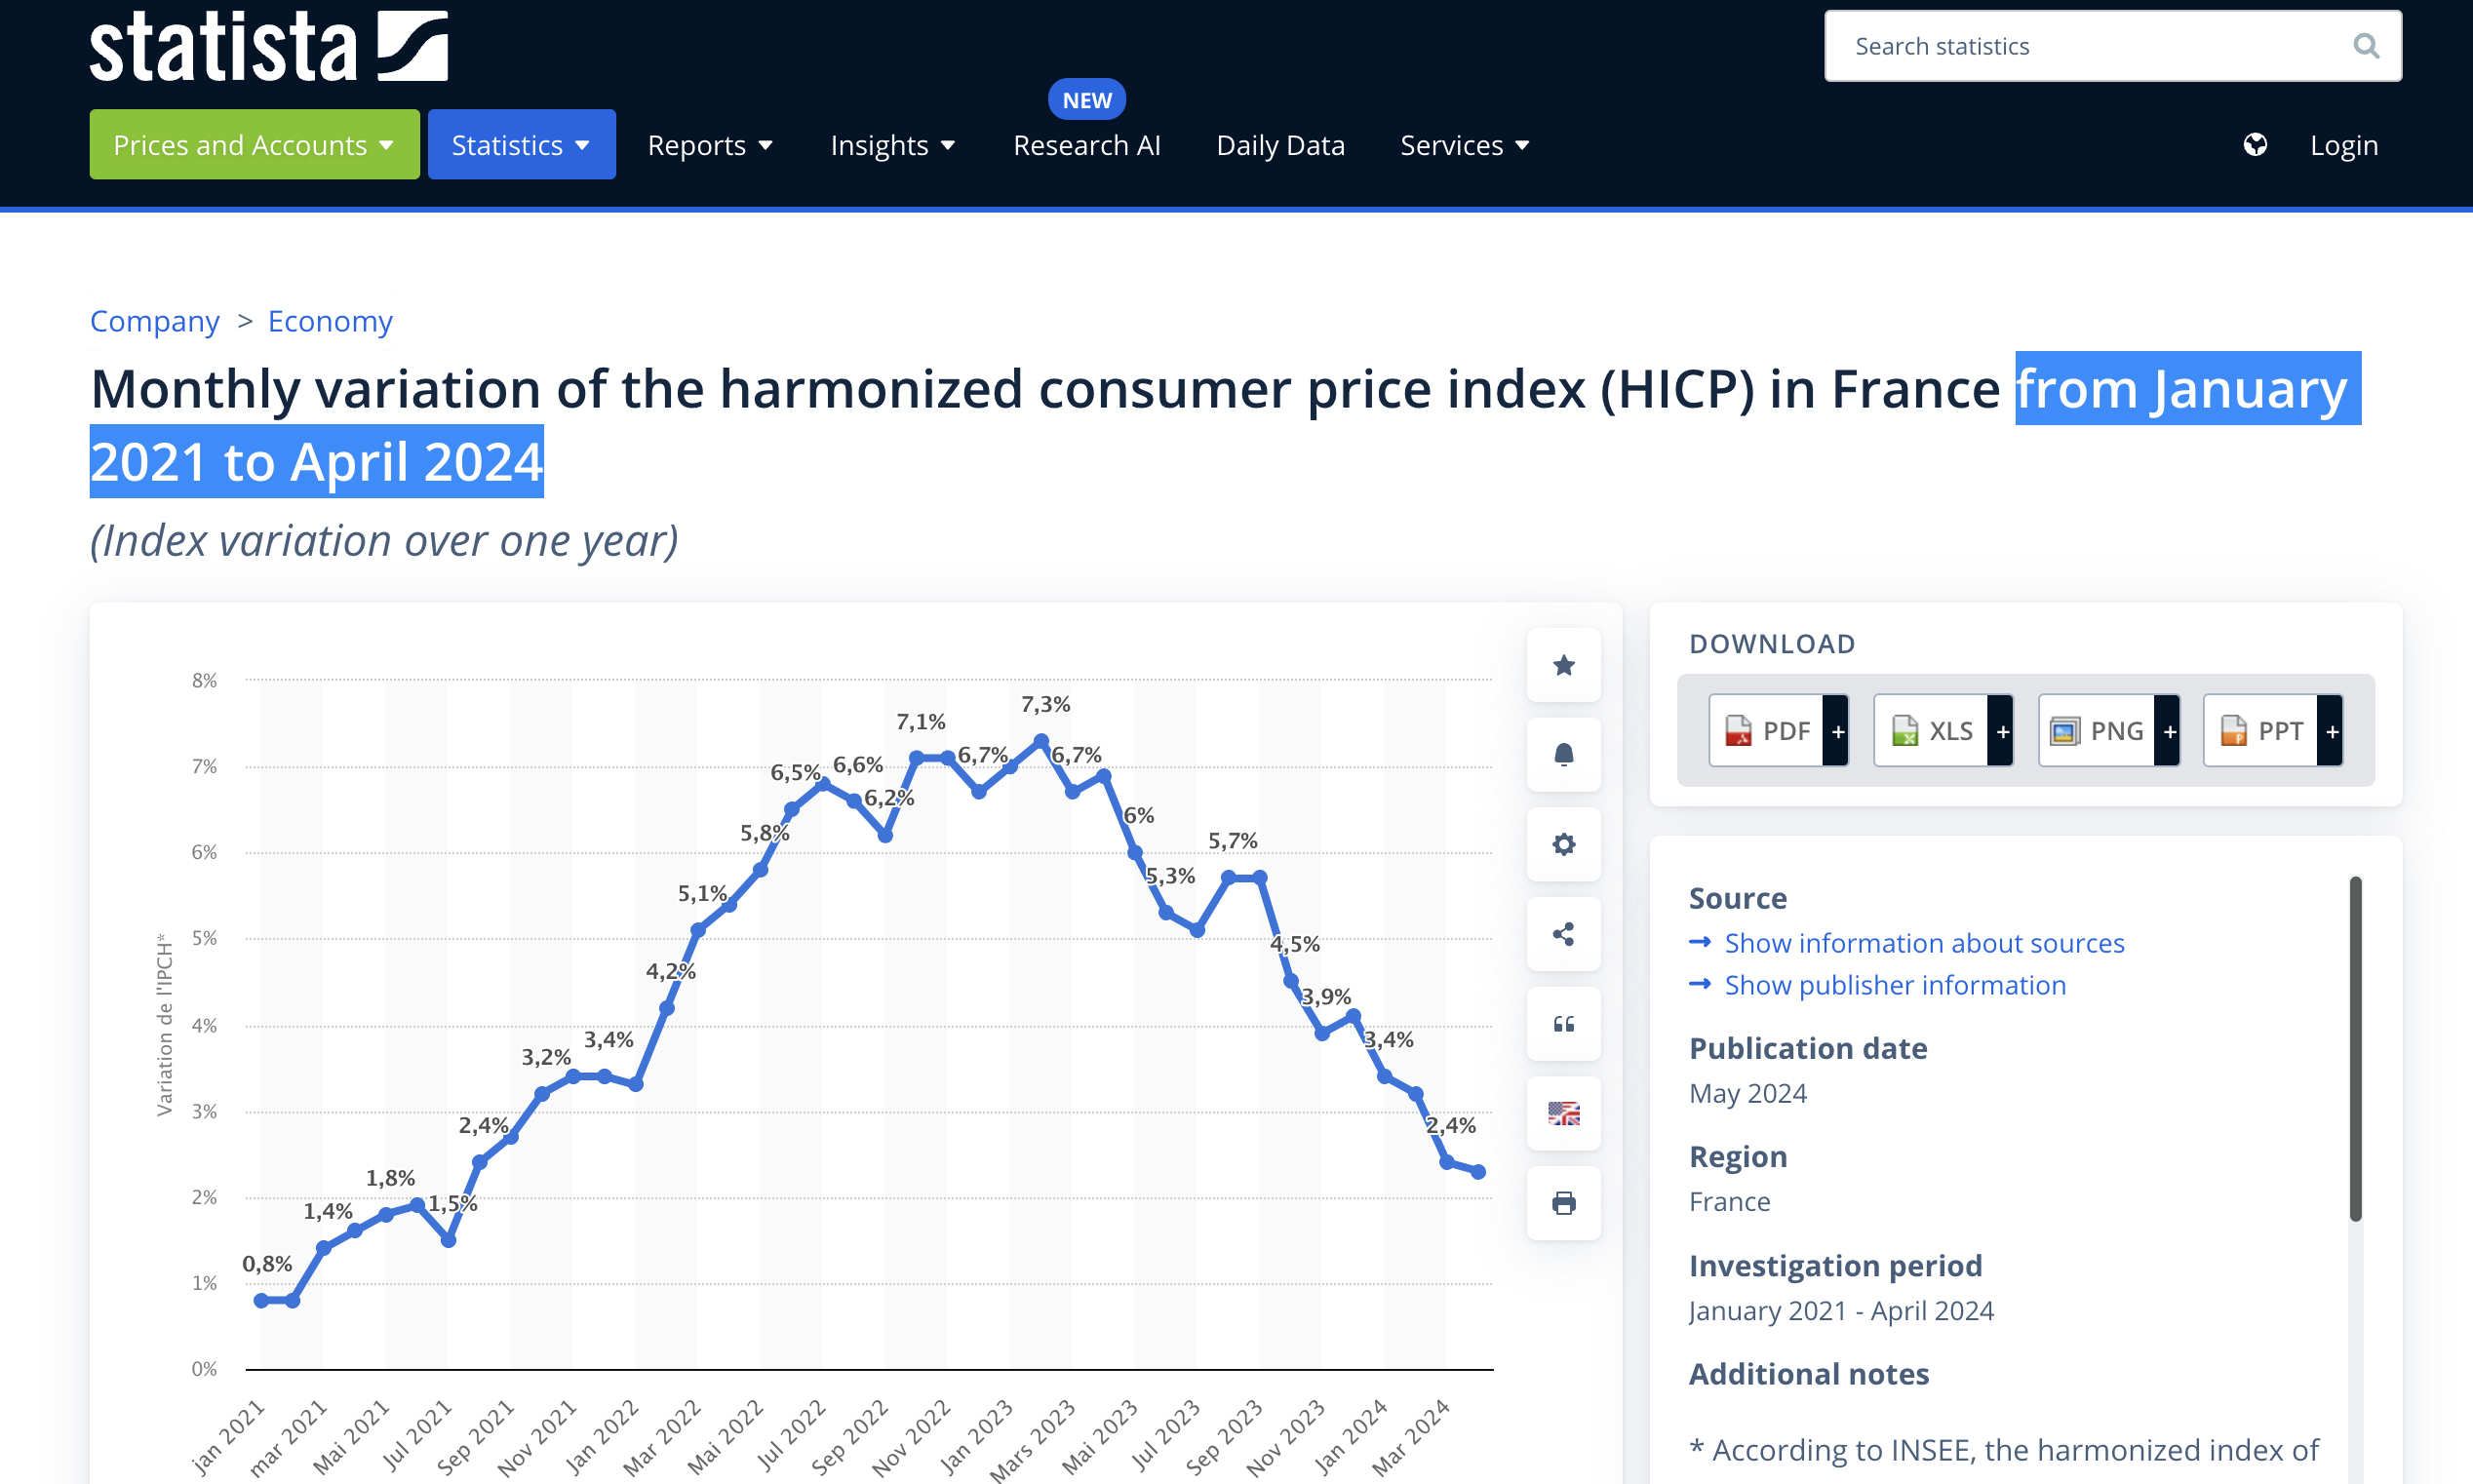
Source: the company.
- Market Research: Businesses use Statista to understand market dynamics, consumer preferences, and industry trends.
- Strategic Planning: Statista’s insights help organizations make informed decisions about investments, product launches, and expansions.
- Academic Research: Students and researchers rely on Statista for data-driven studies in fields like economics, business, and social sciences.
- Public Policy and Advocacy: Policymakers use Statista to analyze economic indicators and societal trends, aiding in policy formulation and advocacy efforts.
Advantages and Limitations of Statista
Though there are multiple advantages of using this database there are also certain limitations that we have to consider:
Advantages of Statista
- Broad Scope: Covers a wide range of topics, industries, and geographies.
- User-Friendly: Simplifies complex data with visual tools and intuitive navigation.
- Trusted Sources: Aggregates data from reputable organizations, ensuring reliability.
Challenges and Limitations
- Subscription Costs: Comprehensive access requires a paid subscription, which might be prohibitive for some users.
- Limited Raw Data: Focuses more on aggregated and processed data rather than raw datasets.
- Depth vs. Breadth: While broad, some topics may lack the depth found in specialized databases.
Why Statista Matters in 2024
In 2024, as data becomes the backbone of strategic decision-making, Statista’s role is more vital than ever. Its ability to present real-time insights and long-term trends in a visually engaging manner caters to the increasing demand for actionable intelligence. With industries navigating challenges like digital transformation and global economic shifts, Statista serves as a reliable ally in staying informed and competitive.
Conclusion
Statista has revolutionized how data is accessed and utilized. Its blend of breadth, reliability, and user-friendly design makes it a versatile tool for anyone needing data-driven insights. Whether you’re exploring new markets, conducting academic research, or shaping public policy, Statista equips you with the knowledge needed to succeed in a complex world.
Why should I be interested in this post?
For finance students, Statista offers a wealth of resources to support academic projects, case studies, and career preparation. The platform provides access to financial metrics, market trends, and consumer insights that are invaluable for coursework and internships.
Related posts on the SimTrade blog
▶ Nithisha CHALLA Datastream
▶ Nithisha CHALLA Factiva
▶ Nithisha CHALLA CRSP
▶ Nithisha CHALLA Compustat
Useful resources
Statista Empowering people with data
Statista Global stories vividly visualized
Wikipedia Statista
European University Institute (EUI) Statista
About the author
The article was written in December 2024 by Nithisha CHALLA (ESSEC Business School, Grande Ecole Program – Master in Management (MiM), 2021-2024).