MSCI Factor Indexes

Youssef_Louraoui

In this article, Youssef LOURAOUI (ESSEC Business School, Global Bachelor of Business Administration, 2017-2021) presents the MSCI Factor Indexes. MSCI is one of the most prominent actors in the indexing business, with approximately 236 billion dollars in assets benchmarked to the MSCI factor indexes.

The structure of this post is as follows: we begin by introducing MSCI Factor Indexes and the evolution of portfolio performance. We then delve deeper by describing the MSCI Factor Classification Standards (FaCS). We finish by analyzing factor returns over the last two decades.

Definition

Factor

A factor is any component that helps to explain the long-term risk and return performance of a financial asset. Factors have been extensively used in portfolio risk models and in quantitative investment strategies, and documented in academic research. Active fund managers use these characteristics while selecting securities and constructing portfolios. Factor indexes are a quick and easy way to get exposure to several return drivers. Factor investing aims to obtain greater risk-adjusted returns by exposing investors to stock features in a systematic way. Factor investing isn’t a new concept; it’s been utilized in risk models and quantitative investment techniques for a long time. Factors can also explain a portion of fundamental active investors’ long-term portfolio success. MSCI Factor Indexes use transparent and rules-based techniques to reflect the performance characteristics of a variety of investment types and strategies (MSCI Factor Research, 2021).

Performance analysis

Understanding portfolio returns is crucial to determining how to evaluate portfolio performance. It may be traced back to Harry Markowitz’s pioneering work and breakthrough research on portfolio design and the role of diversification in improving portfolio performance. Investors did not discriminate between the sources of portfolio gains throughout the 1960s and 1970s. Long-term portfolio management was dominated by active investment. The popularity of passive investment as an alternative basis for implementation was bolstered by finance research in the 1980s. Through passive allocation, investors began to effectively capture market beta. Investors began to perceive factors as major determinants of long-term success in the 2000s (MSCI Factor Research, 2021). Figure 1 presents the evolution of portfolio performance analysis over time: until the 1960s, based on the CAPM model, returns were explain by one factor only: the market return. Then, the market model was used to assess active portfolio with the alpha measuring the extra performance of the fund manager. Later on in the 2000s, the first evaluation model based on the market factor was augmented with other factors (size, value, etc.).
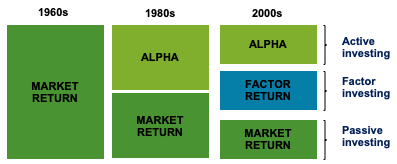
Figure 1. Evolution of portfolio performance analysis.
Evolution_portfolio_performance
Source: MSCI Research (2021).

MSCI Factor Index

MSCI Factor Classification Standards (FaCS) establishes a standard vocabulary and definitions for factors so that they may be understood by a wider audience. MSCI FaCS is comprised of 6 Factor Groups and 14 factors and is based on MSCI’s Barra Global Equity Factor Model (MSCI Factor Research, 2021) as shown in Table 1.
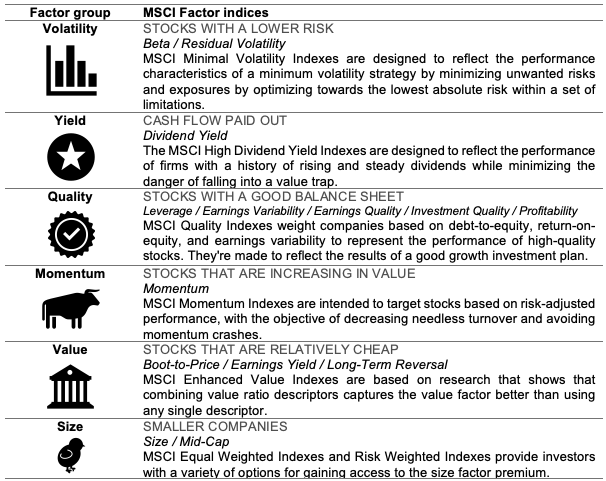
Table 1 Factor decomposition of the different factor strategies.
MSCI_FaCS
Source: MSCI Research (2021).

The MSCI Factor Indexes are based on well-researched academic studies. The MSCI Factor Indexes were identified and developed based on academic results, creating a unified language to describe risk and return via the perspective of factors (MSCI Factor Research, 2021).

Performance of factors over time

Figure 2 compares the MSCI factor indexes’ performance from 1999 to May 2020. All indexes are rebalanced on a 100-point scale to ensure consistency in performance and to facilitate factor comparisons. Over a two-decade period, smart beta factors have all outperformed the MSCI World index, with the MSCI World Minimum Volatility Index as the most profitable factor which has consistently provided excess profits over the long run while (MSCI Factor research, 2021).
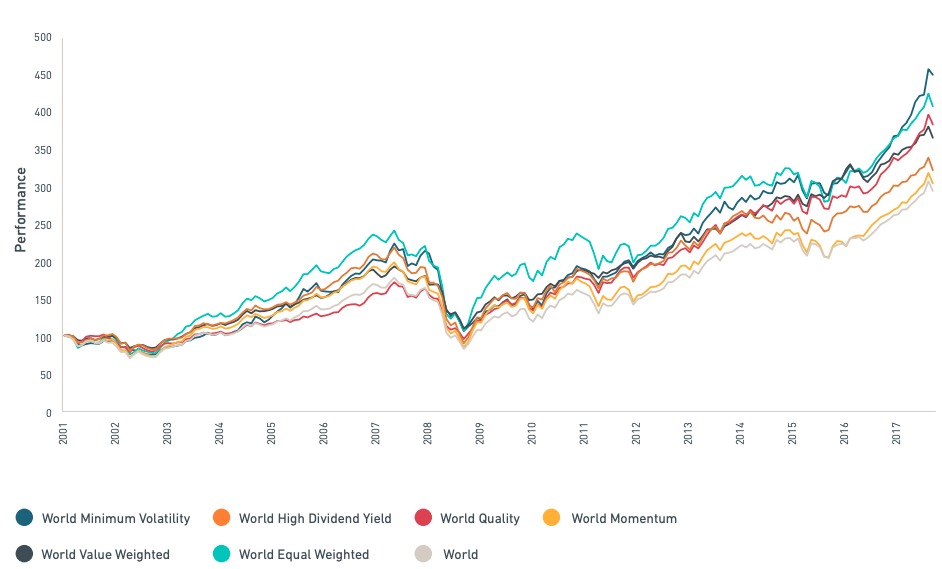
Figure 2. Performance of MSCI Factor Indexes during the period 1999-2017.
MSCI_performance
Source: MSCI Research (2021).

Individual factors have consistently outperformed the market over time. Figure 2 represents the performance of the MSCI Factor Indexes for the last two decades compared to the MSCI ACWI, which is MSCI’s flagship global equity index and is designed to represent the performance of large- and mid-cap stocks across 23 developed and 27 emerging markets.

It is possible to make some conclusions regarding the performance of the investment factor over the previous two decades by dissecting the performance of the various factorial strategies. The value factor was the one that drove performance in the first decade of the 2000s. This outperformance is characterized by a movement towards more conservative investment in a growing market environment. The dotcom bubble crash resulted in a bear market, with the minimal volatility approach helping to absorb market shocks in 2002. When it comes to the minimal volatility approach, it is evident that it is highly beneficial during moments of high volatility, acting as a viable alternative to hedging one’s stock market exposure and moving into more safe-haven products. Several times of extreme volatility may be recognized, including the dotcom boom, the US subprime crisis, and the European debt crisis as shown in Figure 3.
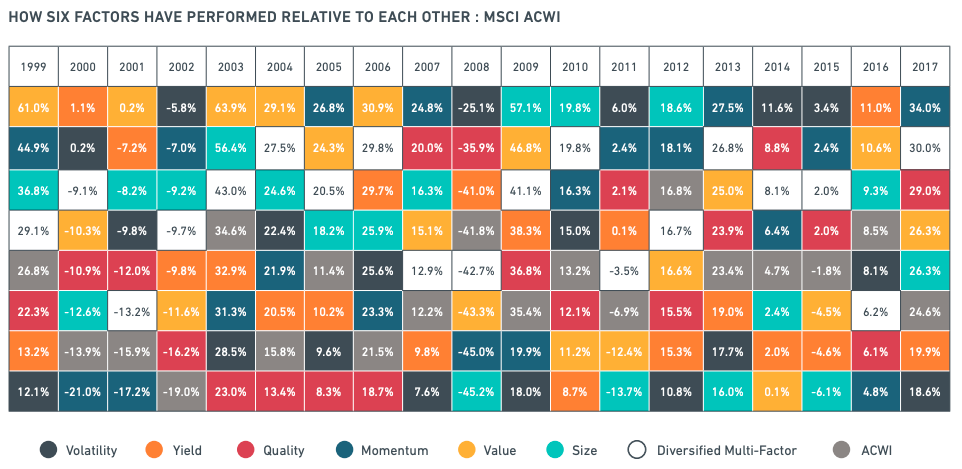
Figure 3. Table of performance of MSCI Factor Indexes from 1999-2017.
MSCI_historical_performance
Source: MSCI Research (2021).

Why should I be interested in this post?

If you are a business school or university undergraduate or graduate student, this content will help you in understanding the evolution of asset management throughout the last decades and in broadening your knowledge of finance.

Smart beta funds have become a trending topic among investors in recent years. Smart beta is a game-changing invention that addresses an unmet need among investors: a higher return for lower risk, net of transaction and administrative costs. In a way, these investment strategies create a new market. As a result, smart beta is gaining traction and influencing the asset management industry.

Related posts on the SimTrade blog

Factor investing

   ▶ Youssef LOURAOUI Factor Investing

   ▶ Youssef LOURAOUI Origin of factor investing

   ▶ Youssef LOURAOUI Smart beta 1.0

   ▶ Youssef LOURAOUI Smart beta 2.0

Factors

   ▶ Youssef LOURAOUI Size Factor

   ▶ Youssef LOURAOUI Value Factor

   ▶ Youssef LOURAOUI Yield Factor

   ▶ Youssef LOURAOUI Momentum Factor

   ▶ Youssef LOURAOUI Quality Factor

   ▶ Youssef LOURAOUI Growth Factor

   ▶ Youssef LOURAOUI Minimum Volatility Factor

Useful resources

Business analysis

MSCI Factor Research, 2021.MSCI Factor Indexes

MSCI Factor Research, 2021. MSCI Factor Classification Standards (FaCS)

About the author

The article was written in October 2021 by Youssef LOURAOUI (ESSEC Business School, Global Bachelor of Business Administration, 2017-2021).

MSCI ESG Ratings

MSCI ESG Ratings

Anant Jain

In this article, Anant JAIN (ESSEC Business School, Grande Ecole Program – Master in Management, 2019-2022) talks about MSCI ESG Ratings.

Introduction

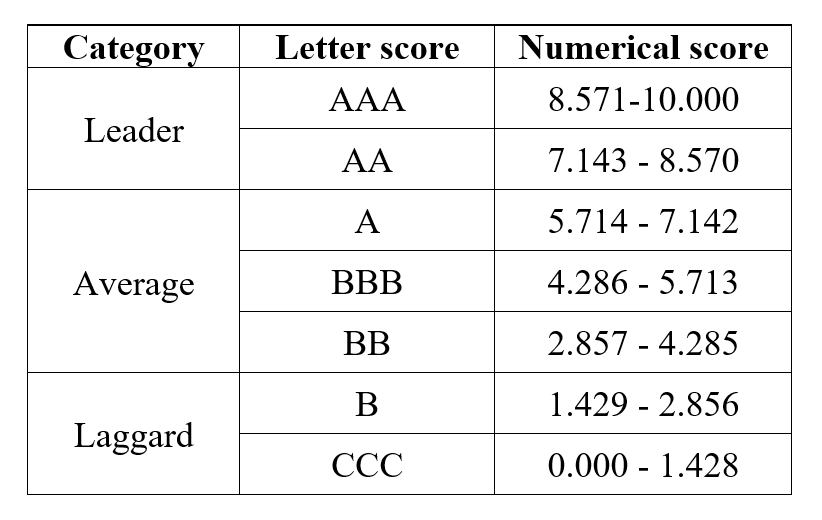
MSCI ESG Rating is a measure of a company’s commitment to environmental, social, and governance (ESG) criteria and socially responsible investments (SRI). The MSCI ESG rating focuses on a company’s exposure to financially relevant ESG risks. It applies a rule-based methodology to distinguish companies into industry leaders and laggards based on their exposure to ESG risks and their relative aptitude to manage those risks compared to their peers. The ESG Ratings are ranked from leader (AAA, AA) to average (A, BBB, BB) to laggard (B, CCC).

Rating companies on the basis of ESG dimensions enables socially conscious investors to screen potential investments according to their personal investment goals and values.

Environmental, social, and governance (ESG) criteria

ESG criteria constitute a framework that helps socially conscious investors screen potential investments that incorporate their personal values/agendas. The ESG criteria screen companies based on sound environmental practices, healthy social responsibilities and moral governance initiatives into their corporate policies and daily operations.

Socially responsible investing (SRI)

SRI is a type of investment that is categorized to be socially responsible due to the nature of the operation the company conducts. SRI is an investment that considers two aspects:1) social/environmental changes; 2) financial performance. In other words, socially responsible investors promote practices that they believe will lead to environmental benefits, consumer protection, racial/gender diversity, etc. Some socially responsible investors also do the opposite of investing by avoiding companies that negatively impact society, such as alcohol, tobacco, deforestation, pollution, etc.

How Do MSCI ESG Ratings Work?

Over the past decade, ESG investing has become more popular. In 2020, the US SIF: The Forum for Sustainable and Responsible Investment published that more than $17 trillion of professionally managed assets were held in sustainable assets (about one-third of all assets under management).

Data providers have created various scoring criteria to rank and access potential ESG investments. Besides MSCI, other financial firms have curated their own proprietary ESG scoring models, including Standard & Poors (S&P), Blackrock, and Russell Investments. As a result, socially responsible investors can make more informed decisions when screening companies, ETFs, or mutual funds to include in their portfolios.

Division of ESG into pillars

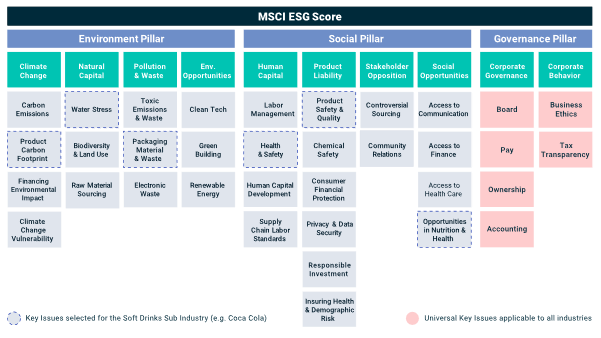
MSCI’s ratings segregate ESG into its three pillars: environment, social, and governance. Figure 1 below shows the main components of each pillar and the key issues of each component.

MSCI evaluate thousands of data points across 35 ESG Key Issues that focus on the junction between a company’s core business and the industry-specific issues that may create significant risks and opportunities for the company. All companies are automatically evaluated for Corporate Governance and Corporate Behavior.

Figure 1. MSCI ESG classification.
MSCI ESG Classification
Source: MSCI.

For example, in Figure 1, we take the example of a soft drink sub-industry (say Coca-Cola). In this scenario, the key issues for the environment and social pillar are highlighted. All the key issues mentioned for the governance pillar will be automatically considered for this industry (or any other industry).

Calculation of MSCI scores

When calculating the ESG scores for a company, MSCI rates each key issue from zero to ten. Zero indicates virtually no exposure, and ten represents very exposure to a particular ESG risk or opportunity.

MSCI also evaluates a company for its possible exposure to dubious business activities (e.g., gambling, weapons, tobacco, etc.). The data informing these scores are received from corporate filings, financial reports, and press releases. In addition to this, almost half of all data comes from hundreds of third-party media, academic institutions, non-government organizations (NGO), regulatory, and government sources.

Scores based on a company’s individual metrics are aggregated, weighted, and scaled to the relevant industry sector. Finally, an intuitive letter-based grade gets assigned to the company.

Assessment of MSCI scores

MSCI distinguishes its grades into three categories, mentioned below in descending order:

  • 1. Leader (grade AAA & AA) – this grade indicates that a company is leading its relative industry. The company is managing the most significant ESG risks and opportunities.
  • 2. Average (grade A, BBB & BB) – this grade indicates a company has an unexceptional or mixed track record of alleviating ESG risks and opportunities.
  • 3. Laggard (grade B or CCC) – this grade indicates that a company is lagging in its industry because of the high exposure to ESG risks and failure to mitigate them.

Figure 2. MSCI ESG Score board.
MSCI ESG Score board
Source: MSCI.

Example of MSCI ESG rating

The following case below is a real-life example of the MSCI ESG rating of Tesla, an electric vehicle producer. The company attained an overall grade of “A”, achieving the higher end of the “average” category.

When we look at the breakdown of this rating:

  • Tesla exceeds corporate governance and environmental risks, maintains a comparatively small carbon footprint, and utilizes green technologies.
  • The company scores an average grade for product quality and safety due to its past experiences of exploding batteries, undesirable crash test ratings, and accidents involving the car’s “autopilot” feature.
  • Tesla’s score is below-average for labor management practices. Tesla has been found to violate labor laws by blocking unionization. It has also repeatedly violated the National Labor Relations Act.

It is fascinating to note that the French auto parts maker, Valeo SA is the only company in the auto industry that earns a “leader” category grade from the MSCI ESG Ratings.

Related posts on the SimTrade blog

▶ Anant JAIN Environmental, Social & Governance (ESG) Criteria

▶ Anant JAIN Dow Jones Sustainability Index

▶ Anant JAIN Socially Responsible Investing

Useful resources

MSCI

MSCI Ratings Methodology

Tesla’s MSCI Rating

US SIF

About the author

The article was written in July 2021 by Anant JAIN (ESSEC Business School, Grande Ecole Program – Master in Management, 2019-2022).