The investment ecosystem

The investment ecosystem

Nithisha CHALLA

In this article, Nithisha CHALLA (ESSEC Business School, Grande Ecole Program – Master in Management, 2021-2023) explains the investment ecosystem in financial markets.

Introduction

In the investment ecosystem, there are several blocks to understand: market participants, market products, and market organization.

Market participants

Market participants are individuals, companies, financial institutions, and governments. Some of these participants may issue assets like companies (stocks, commercial paper, and bonds) and governments (bonds). Some of these participants may invest in these assets like individuals or pension funds.

Based on the amount they invest, market participants are segregated as big players and small players. Big players are mostly institutional investors which collect the funds and then invest them. Few examples of institutional investors are mutual funds, pension funds, hedge funds, trusts, charities etc. Big players may also be wealthy individuals (high net worth individuals or HNWI) or family offices. Small players are other individual investors.

Corporates run businesses, including manufacturing, service, and technology firms, and they need capital to expand and maintain their operations. On the other side, we have institutions that consist of fund managers that could be institutional investors but also retail investors as well. These are the people that have capital so the capital flows from the institutions or investment managers who have the money to the corporations that need that money to grow and run their business. The cycle between the two parties is completed when the firms issue back to the investor’s bonds, which are classified as debt, or shares, which are classified as equity.

In the middle of these two groups sit the investment banks they are often referred to as the sell side and they have contacts on both sides of these players. They have corporate clients, and they have institutional investor clients, their job is to match up the institutional investors with the corporates based on risk and return assessments and expectations and investment style to get the deal done. In addition, we have public accounting firms which are the fourth player in the market.

Market Products

Assets

What are assets? In financial language, an asset is that which has some economic value. And assuming that its value increases in the future market participants buy them and that is how it is a part of the investment ecosystem. Few examples for assets are fixed deposit, land, gold, stock, etc.

Asset classes are made up of those investments or securities whose characteristics are the same. Few major asset classes are equity, bonds (fixed income), commodities, and real estate.

Instruments

What are Instruments? Instruments are the ways through which we can invest in different asset classes.

Some of the major instruments we see in markets are direct investing, mutual funds, and exchange-traded funds (ETFs).

  • Direct investing is nothing but investing cash physically in different asset classes or we can digitally buy assets through our accounts
  • Mutual funds are the funds collected by multiple investors and then those are invested in different asset classes. To manage these mutual funds, we have fund managers who will invest on behalf of investors.
  • ETFs are nothing but a basket of securities just like mutual funds, but the only difference is they are traded on stock exchanges.

Market organization

Primary and secondary markets

The primary markets: the initial issuance of assets

The primary market is where new securities, including stocks, bonds, and other financial assets, are first issued by governments or corporations. The primary market is also referred to as the market for new issues.

Companies and governments raise money in the primary market by offering their securities to retail or institutional investors. The securities may be sold through a private placement or an initial public offering (IPO).

There are four main players in the primary market mainly for issuance of securities.
1) Corporates
2) Investors: institutional investors and individual investors
3) Corporate banks
4) Public accounting firms

The secondary markets: the exchange of assets

In the secondary market, fund managers and banks collaborate to trade securities between investors after they have already been issued. On one side, a fund manager may want to purchase securities of a public company, while on the other, a different fund manager may wish to sell those same securities. Investment bankers come between these clients to help facilitate these trades, and this trade is facilitated over the stock exchange. They provide equity research coverage to help fund managers make decisions about buying and selling those securities. And this secondary market trading makes markets liquid. This is what allows you to get in and out of security very easily.

Market infrastructure

Infrastructure providers are the companies which enable the transactions and functioning of different instruments. It means all the digital and physical infrastructure required for the investor is provided by the infrastructure provider. The few common examples of an infrastructure provider are the stock exchange, depositories, and registrar and transfer of agents.

  • Stock exchange: It is the platform where you can sell and buy securities. Here, with the help of a broker and the stock exchange two investors can buy and sell stocks without knowing each other. For example, The TSE is the largest stock exchange in Asia by market capitalization. It is located in Tokyo, Japan and has over 3,500 listed companies.
  • Depositories: These are the companies that store the stocks we buy in electronic form. We can store these stocks through our demat accounts. Depositories help you transfer stock and various other functions like checking the statements, portfolio holdings and transaction information etc. Generally investors directly do not interact with depositories but they approach through a broker who would invest on their behalf. For example: The DTC is one of the largest depositories in the world. It is located in New York City and holds over 3.5 million securities worth trillions of dollars.
  • Registrar and Transfer of Agents (RTA): just like depositories in case of stocks, RTA’s in case of mutual funds. All trades of mutual funds like subscription, redemption, and transfer, are recorded by an RTA. An RTA also helps mutual fund investors in providing their portfolio and statements to them.

Why should I be interested in this post?

As a student and prospective business management graduate, I think it is important to know the investment ecosystem. Firstly, investments play a vital role in the growth and success of companies. Companies need investments to fund their operations, expand their businesses, and create value for their shareholders. Therefore, understanding the investment ecosystem will enable management students to make informed decisions regarding investments that can help drive the growth of the companies they work for or manage in the future.

Related posts on the SimTrade blog

All posts about financial techniques

   ▶ Marie POFF Film analysis: The Wolf of Wall Street

Useful resources

McKinsey (2017) Capital Markets Infrastructure: An Industry Reinventing Itself

Black rock The Investment Stewardship Ecosystem

About the author

The article was written in March 2023 by Nithisha CHALLA (ESSEC Business School, Grande Ecole Program – Master in Management, 2021-2023).

Active Investing

Youssef_Louraoui

In this article, Youssef LOURAOUI (Bayes Business School, MSc. Energy, Trade & Finance, 2021-2022) elaborates on the concept of active investing, which is a core investment strategy that relies heavily on market timing and stock picking as the two main drivers of financial performance.

This article is structured as follows: we introduce the concept of active investing in asset management. Next, we present an overview of the academic literature regarding active investing. We finish by presenting some basic principles on active investing.

Introduction

Active investing is an approach for going beyond matching a benchmark’s performance and instead aiming to outperform it. Alpha may be calculated using the CAPM framework, by comparing the fund manager’s expected return with the expected market return (Jensen, 1968). The search for alpha is done through two very different types of investment approaches: stock picking and market timing.

Stock picking

Stock picking is a method used by active managers to select assets based on a variety of variables such as their intrinsic value, the growth rate of dividends, and so on. Active managers use the fundamental analysis approach, which is based on the dissection of economic and financial data that may impact the asset price in the market.

Market timing

Market timing is a trading approach that involves entering and exiting the market at the right time. In other words, when rising outlooks are expected, investors will enter the market, and when downward outlooks are expected, investors will exit. For instance, technical analysis, which examines price and volume of transactions over time to forecast short-term future evolution, and fundamental analysis, which examines the macroeconomic and microeconomic data to forecast future asset prices, are the two techniques on which active managers base their decisions.

Review of academic literature on active investing

As fund managers tried strategies to beat the market, financial literature delved deeper into the mechanism to achieve this purpose. Jensen’s groundbreaking work in the early ’70s gave rise to the concept of alpha in the tracking of a fund’s performance to distinguish between the fund’s manager’s ability to generate abnormal returns and the part of the returns due to luck (Jensen, 1968).

Jensen develops a risk-adjusted measure of portfolio performance that quantifies the contribution of a manager’s forecasting ability to the fund’s returns. He used the measure to quantify the predictive ability of 115 mutual fund managers from 1945 to 1964—that is, their ability to produce returns above those expected given the risk level of each portfolio.

Not only does the evidence on mutual fund performance indicate that these 115 funds on average were unable to forecast security prices accurately enough to outperform a buy-and-hold strategy, but there is also very little evidence that any individual fund performed significantly better than what we would expect from mutual random chance. Additionally, it is critical to highlight that these conclusions hold even when fund returns are measured net of management expenses (that is assume their bookkeeping, research, and other expenses except brokerage commissions were obtained free). Thus, on average, the funds did not appear to be profitable enough in their trading activity to cover even their brokerage expenses.

Core principles of active investing

First principle: market efficiency varies between asset classes.

Investment information is not always readily available in all markets. For less efficient asset classes, an “active” management strategy offers a larger possibility to outperform the market, whereas a “passive” investment strategy may be more appropriate for highly efficient asset classes. In other words, there are compelling advantages for incorporating both active and passive techniques into an overall portfolio.

For example, Wall Street analysts cover a huge portion of US large size shares, making it harder to locate cheap companies. For this highly efficient asset class, a passive investment strategy may be more cost-effective in some cases. On the other side, emerging market equities are sometimes under-researched and difficult to appraise, providing an active manager with additional opportunities to identify mispriced companies. The critical point here is to notice the distinctions and then make the appropriate decisions.

Second principle: market efficiency varies across asset classes.

Within practically every asset class, active and passive management strategies can alternate as winners periodically. Even the most efficient asset classes can occasionally benefit from active management over passive. The reason is substantially distinct from the one stated in Principle One. Principle Two is related to the “Grossman-Stiglitz Paradox”: If markets are fully efficient, there is no reason to investigate them; yet markets can only be perfectly efficient for as long as they are regularly investigated. When investors run out of patience researching stocks in a highly efficient market, passive investment becomes appealing, reopening the door to opportunities for active research. This can result in an annual cycle of active/passive trends.

In some investing environments, active strategies have tended to benefit investors more, while passive strategies have tended to outperform in others. For instance, active managers may outperform more frequently than passive managers when the market is turbulent, or the economy is deteriorating. On the other way, when certain securities within the market move in lockstep or when stock valuations are more consistent, passive strategies may be preferable. Investors may gain from combining passive and active strategies in a way that exploits these insights, depending on the opportunity in various areas of the capital markets. Market conditions, on the other hand, vary constantly, and it frequently takes an intelligent eye to determine when and how much to skew toward passive rather than active investments (Morgan Stanley, 2021).

It’s worth noting that attaining consistently successful active management has historically been more challenging in some asset classes and segments of the market, such as large US company stocks. As a result, it may make sense to be more passive in certain areas and more active in asset classes and segments of the market where active investing has historically been more rewarding, such as overseas stocks in emerging markets and smaller U.S. corporations (Morgan Stanley, 2021).

Why should I be interested in this post?

If you are a business school or university undergraduate or graduate student, this content will help you in broadening your knowledge of finance.

Related posts on the SimTrade blog

   ▶ Youssef LOURAOUI Portfolio

   ▶ Youssef LOURAOUI Systematic and specific risk

   ▶ Youssef LOURAOUI Alpha

   ▶ Youssef LOURAOUI Factor Investing

   ▶ Youssef LOURAOUI Origin of factor investing

   ▶ Youssef LOURAOUI Markowitz Modern Portfolio Theory

   ▶ Jawati WALIA Capital Asset Pricing Model (CAPM)

Useful resources

Academic research

Grossman, S., Stiglitz, J., 1980. On the impossibility of Informationally efficient markets. The American Economic Review, 70(3), 393-408.

Lintner, J. 1965a. The Valuation of Risk Assets and the Selection of Risky Investments in Stock Portfolios and Capital Budgets. The Review of Economics and Statistics 47(1): 13-37.

Lintner, J. 1965b. Security Prices, Risk and Maximal Gains from Diversification. The Journal of Finance, 20(4): 587-615.

Mangram, M.E., 2013. A simplified perspective of the Markowitz Portfolio Theory. Global Journal of Business Research, 7(1): 59-70.

Markowitz, H., 1952. Portfolio Selection. The Journal of Finance, 7(1): 77-91.

Mossin, J. 1966. Equilibrium in a Capital Asset Market. Econometrica, 34(4): 768-783.

Sharpe, W.F. 1963. A Simplified Model for Portfolio Analysis. Management Science, 9(2): 277-293.

Sharpe, W.F. 1964. Capital Asset Prices: A Theory of Market Equilibrium under Conditions of Risk. The Journal of Finance, 19(3): 425-442.

Business analysis

Forbes, 2021. Active or Passive investing? Two principles provide the answer

JP Morgan Asset Management, 2021. Investing

Morgan Stanley, 2021. Active vs Passive management

About the author

The article was written in November 2021 by Youssef LOURAOUI (Bayes Business School, MSc. Energy, Trade & Finance, 2021-2022).

The IRR, XIRR and MIRR functions in Excel

The IRR, XIRR and MIRR functions in Excel

Photo Léopoldine FOUQUES

In this article, Léopoldine FOUQUES (ESSEC Business School, Global Bachelor of Business Administration, 2017-2021) presents the IRR function in Excel to compute the internal rate of return of a series of cash flows.

About Excel

Excel is by far the most used financial modeling tool across the world to build models and perform analysis. Knowing which Excel function to use can help employees in the financial sector (financial analysts, fund managers, risk managers, traders, etc.) to work faster and build a more powerful model.

The internal rate of return (IRR)

Definition

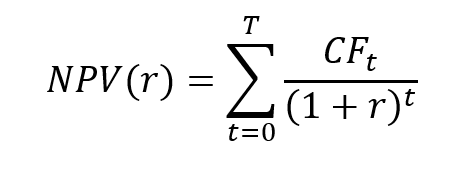
The computation of the internal rate of return (IRR) is based on the net present value (NPV) of an investment. In financial modelling, an investment is represented by a series of cash flows: CF0, CF1, CF2, …, CFT. For a classic investment, the first cash flow, CF0, is negative (outflow) and the future cash flows, CF1, CF2, …, CFT are positive (inflows).

The net present value (NPV) of an investment is computed according to the following formula:

NPV formula
where r is the discount rate that takes into account the risk of the project.

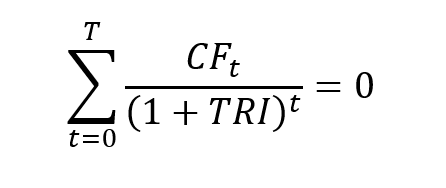
The IRR corresponds to the value of the discount rate for which the NPV is equal to 0:

IRR
The IRR is the solution of a non-linear equation:

IRR

Use in finance

One of the most important functions is the Internal Rate of Return (IRR) function, as it’s an easy function to compare an investment’s return, based on a series of cash flows.

The function is very useful in financial modeling. Indeed, it’s frequently used to compare scenarios before deciding about a project. An example is when a company is presented with two opportunities: one is investing in a new factory and the second is expanding its existing factory.

By using IRR, we can estimate the IRR for each scenario and verify which one is higher than the average cost of capital of the business (the Weighted Average Cost of Capital or WACC) is a calculation of a firm’s cost of capital in which each category is proportionally weighted).

The Excel functions to compute the IRR

Building a math-based calculation is time-consuming and complicated, so Excel offers three functions for the calculation of the internal rate of return: IRR, MIRR, and XIRR.

The IRR function

The IRR function uses one required argument and one optional:

  • The values: they represent the series of cash flows, including net income value and investments.
  • The guessed number for the expected internal rate of return. If omitted, the function will default to 0.1 (= 10%).

You can download the Excel file below in which I illustrate the use of the IRR function in Excel based on a simple example.

Download the Excel file to compute the IRR of an investment
Note that the IRR corresponds to a period rate. Monthly cash flows lead to a monthly IRR, quarterly cash flows lead to a quarterly IRR; and annual cash flows lead to an annual IRR. As, in practice, the standard is to work annual rates, monthly and quarterly IRR have to annualized.

Note that the use of the IRR function assumes that the period between each cash flow is the same (equal-size payment periods), for example one year.

From the IRR function to the XIRR function

If the period between each cash flow is not the same, the IRR function should not be used. It is the case with monthly cash flows as the months of the year may contain 28, 29, 30 or 31 days.

In this case, the XIRR function comes into play to calculate a correct internal rate of return, taking into consideration the periods of different sizes.

The XIRR function has three arguments:

  • The values
  • The dates for cash outflows and inflows.
  • The guessed number for the expected internal rate of return (optional argument).

You can download the Excel file below in which I illustrate the use of the IRR and XIRR functions in Excel based on a simple example.

Download the Excel file to compute the IRR and XIRR of an investment

From the IRR function to the MIRR function (Modified Internal Rate of Return)

The MIRR function is quite the same as the IRR function, except that it takes into consideration both the cost of borrowing the initial investment funds (discount rate) and reinvestment rates for future cash flows.

In contrast to IRR, MIRR assumes that cash flows from a project are reinvested at the firm’s cost of capital (rate of return on a portfolio company’s existing securities).

To compute the MIRR, the Excel function uses the following parameters:

  • The values
  • The guessed number for the expected internal rate of return (optional argument).
  • The financial rate: the finance rate of interest paid
  • The reinvest rate: the interest rate earned from the reinvested profit

MIRR formula
Where FV represents the Future Value of positive cash flows at the cost of capital for the company, PV represents the Present Value of negative cash flows at the financing cost of the company, and T represents the number of periods.

You can download the Excel file below in which I illustrate the use of the IRR and MIRR functions in Excel based on a simple example.

Download the Excel file to compute the IRR and MIRR of an investment
Some of the accountants say that the MIRR function is less valid than the other because not all the flows are reinvested fully. Although we can use a less important interest rate to compensate the partial investment; but we think the best approach will be the inclusion of the three calculations (IRR, XIRR, and MIRR).

Limits of the IRR

The non-linear equation for obtaining the IRR may have one solution, several solutions or no solution according to the sequence of cash flows. These represent limits of the IRR as an investor would like one value when estimating its investment.

Another limit of the IRR as a decision criterion for investing is that the result is not in agreement with the decision criterion based on NPV, which represents the value created by the investment.

You can download the Excel file below in which I provide an example to illustrate the limit of the IRR when selecting investment when two projects are available.

Download the Excel file to select investments based on IRR and NPV

Related posts on the SimTrade blog

▶ Jérémy PAULEN The IRR function in Excel

▶ Raphaël ROERO DE CORTANZE The Internal Rate of Return

▶ William LONGIN How to compute the present value of an asset?

▶ Sébastien PIAT Simple interest rate and compound interest rate

▶ Rodolphe CHOLLAT-NAMY Bond valuation

Useful resources

Mazars Excel IRR Function And Other Ways To Calculate IRR In Excel

About the author

The article was written in November 2021 by Léopoldine FOUQUES (ESSEC Business School, Global Bachelor of Business Administration, 2017-2021).