In this article, Max ODEN (ESSEC Business School, Bachelor’s in Business Administration, 2021-25) shares his professional experience as an analyst intern working in the Leveraged Finance division at Haitong Bank in the Paris office.
For those aspiring to work in Investment Banking but perhaps unsure which division which could perhaps suit you, this post provides a brief overview into what Leveraged Finance is and what goes on during a deal, using a leveraged loan transaction as an example.
Haitong Bank
Haitong Bank is a Lisbon-based investment bank whose roots can be traced back to China. The ultimate owner of the bank is Haitong Securities, one of the largest security houses in China who, in 2014, purchased the investment bank arm of Banco Espirito Santo – a Portuguese bank which was then rebranded to Haitong Bank. The bank has offices in major financial hubs in many continents in cities such as London, Paris, Macau, and Sao Paulo, where it offers services including Debt Capital Markets (DCM), Equity Capial Markets (ECM), asset management (AM), amongst others.
Haitong Logo

Source: Company Website
The Paris office opened in early 2023 and has a relatively small team working across mainly the Leveraged Finance, Structured Finance, and M&A divisions. The small size of the office means that you are immediately involved in transactions across the aforementioned divisions, and this was one the largest advantages of the 9-month internship I had, that I gained a high level of exposure to transactions. I got to experience things across different divisions but the vast majority of my time was spent in leveraged finance, working on deals spanning industries from healthcare to real estate development to consumables.
A Brief Introduction to Leveraged Finance
Simply put, Leveraged Finance, colloquially known as LevFin, involves providing debt capital to companies with an existing high-level of leverage and sub-investment-grade credit ratings to support operations such as leveraged buyouts (LBOs), mergers and acquisitions (M&A), debt refinancing, and recapitalisation efforts. Within an investment bank, the Leveraged Finance team partners with both corporations and private equity (PE) firms to raise this capital by syndicating loans and underwriting high-yield bond issuances. In this article, I will primarily discuss leveraged loans as this was the focus of my internship.
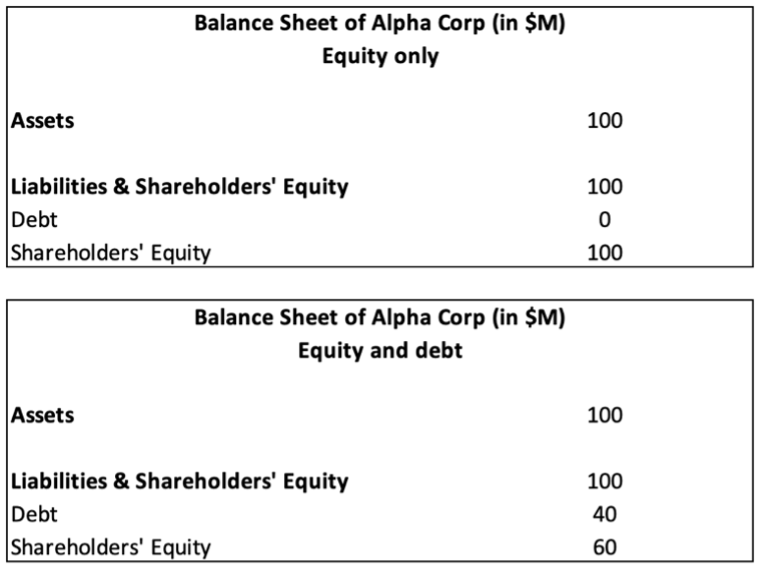
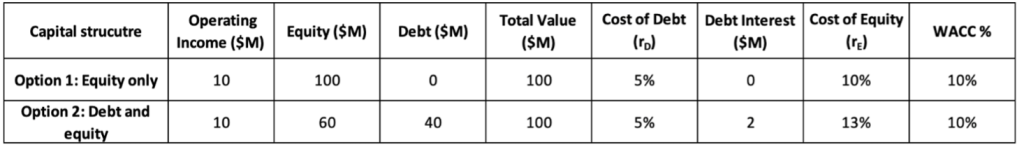
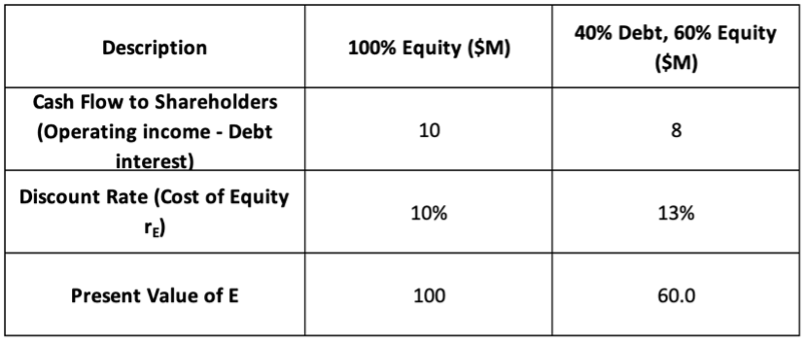
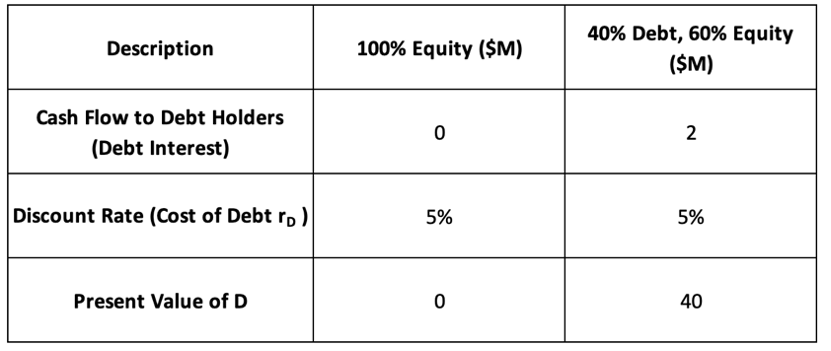
Private Equity (PE) firms are notably large players within LevFin, and later on in this article, I will provide a brief insight into how a transaction is structured based upon a deal which we participated in during my internship for which I was the analyst. PE firms, when raising capital to fund the acquisition of a new company for their portfolio, tend to use a combination of equity and debt (as do many other classic corporations), in which they will tend to use a higher level of debt relative to equity as this increase the PE firm’s Internal Rate of Return (IRR). Without going into too much detail, this is because the less equity (cash) which a PE firm contributes to an acquisition, the higher the return on the cash-investment made.
Investment-grade vs. Speculative-grade Debt
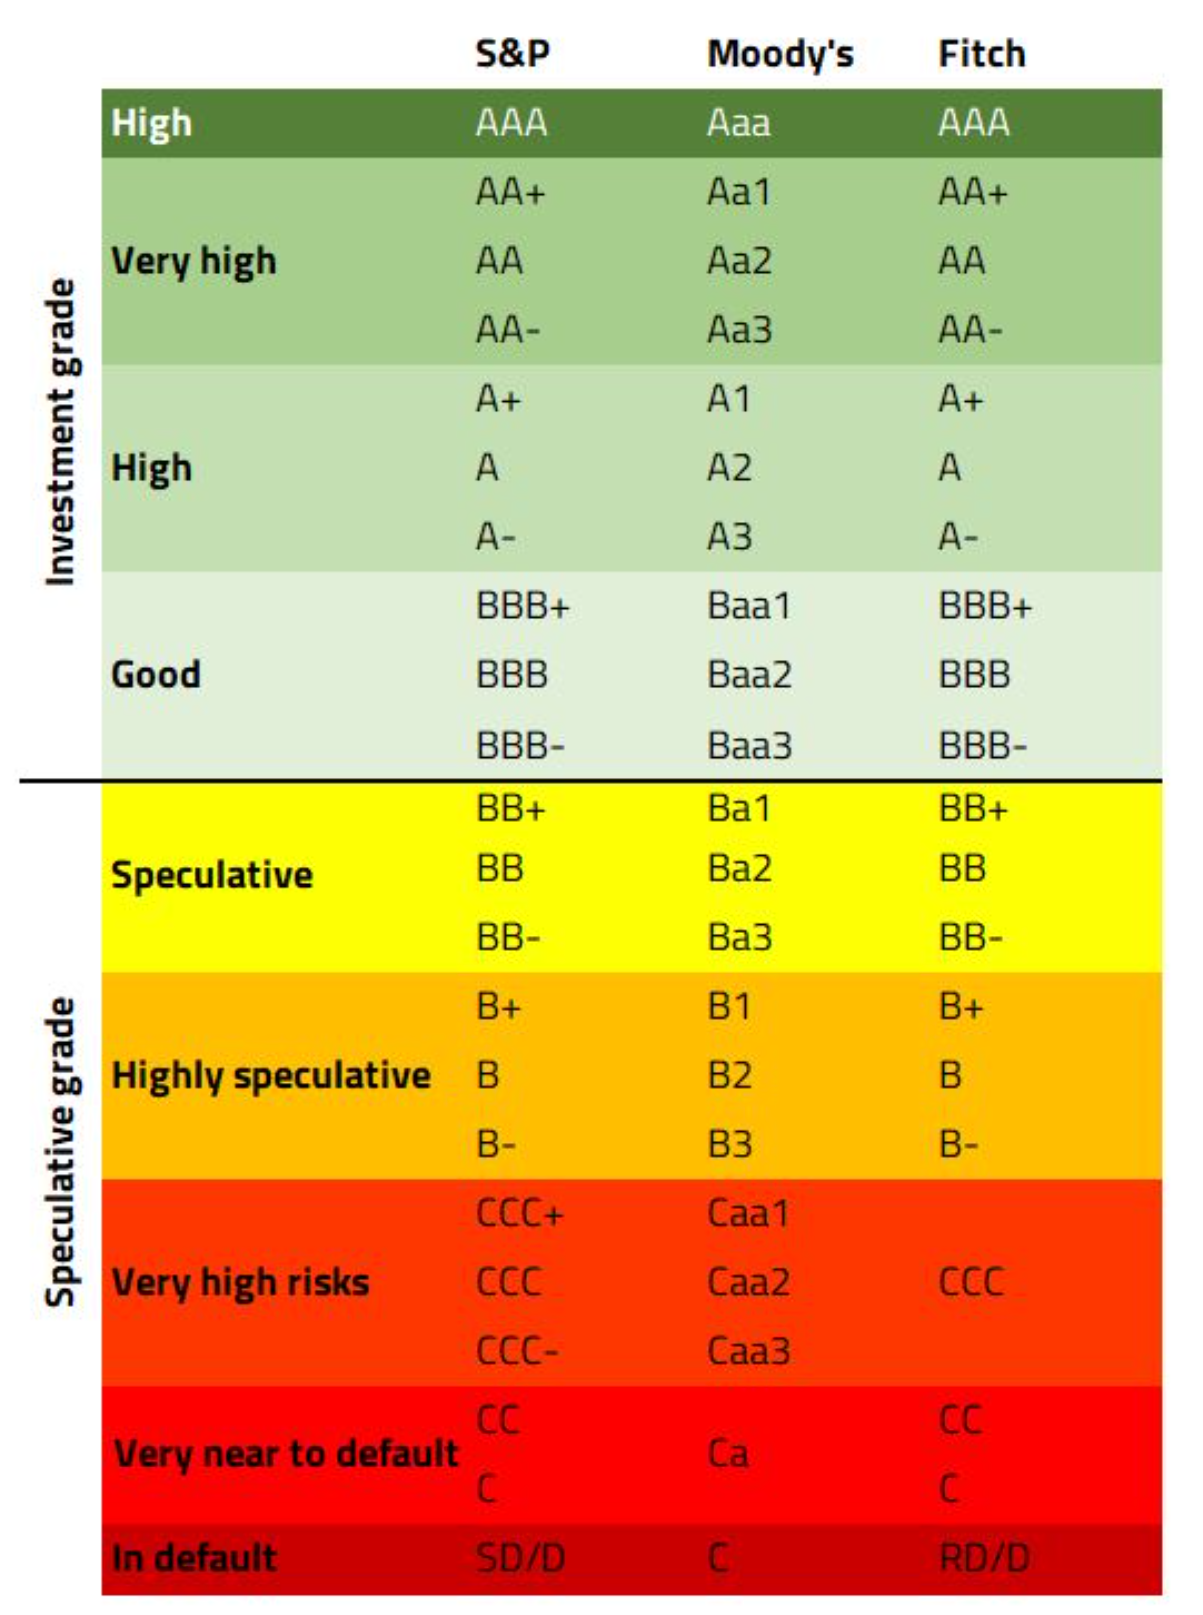
Investment-grade and speculative-grade debt are the two broad classifications given to companies based upon their credit worthiness, as assessed by rating companies such as Standard & Poor’s (S&P), Moody’s and Fitch. These ratings reflect the likelihood that the issuer will meet its debt obligations. Note that each rating agency has slightly different notation form to classify a company’s credit worthiness, but in this article, we will refer exclusively to S&P’s rating format.
Investment-grade debt refers to bonds or loans issued by entities that are considered low to moderate risk. These entities are expected to reliably meet their debt obligations, making them more attractive to risk-averse investors. Such ratings are often provided to mature, financially healthy companies such as Alphabet Inc. which has an AA credit rating from S&P.
On the other hand, speculative-grade debt often referred to as high-yield or junk debt, includes bonds or loans issued by entities that carry a higher risk of default. These are considered non-investment grade and are rated BB+ or lower by S&P. These bonds and loans offer higher yields to compensate investors for the increased risk of non-payment. Birkenstock, despite being a globally recognised brand carries a BB+ rating from S&P, which makes it a speculative-grade company.
The table below shows the broader classification of Investment-grade vs. Speculative-grade, and as you can see, these classifications can be broken down further with the lowest Investment-grade rating being BBB-. When a credit rating is given to a company, the rating agency will also provide an outlook of the rating: ‘Positive’, ‘Neutral’, or ‘Negative’, which logically refers to the likely evolution of the credit rating per the rating agency’s forecast for the company.
Default Rates: Investment- vs. Speculative-grade Debt.
Source: Standard & Poor’s (S&P), Moody’s and Fitch
The graph below shows the global default rates for Investment-grade and Speculative-grade companies, which clearly portrays the additional risk involves when investing into a company with the latter classification.
Default Rates: Investment- vs. Speculative-grade Debt.
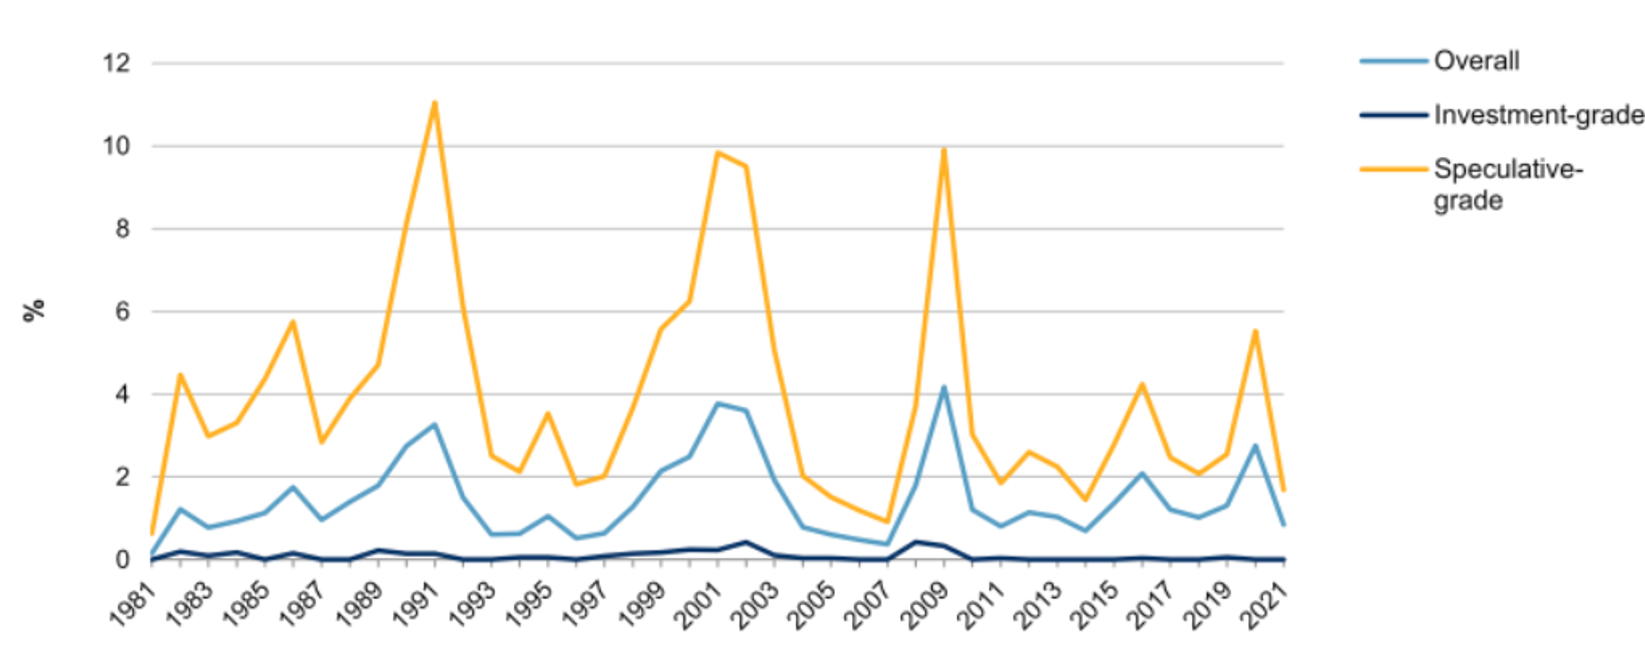
Source: S&P.
Further Interpretation of Credit Ratings
Credit ratings are a telling metric before beginning a thorough analysis of a potential transaction, providing an insight into certain key metrics which are vital when interested lenders are evaluating the investment opportunity. As one would expect, as credit ratings become worse, we see a higher level of Net Leverage (Net Debt/EBITDA), lower Interest Coverage Ratio (EBIT/Interest Payments).
The methodology of these credit ratings is not, however, merely a look at a company’s financial health; the rating agencies take a holistic approach, exploring all areas of a company, encompassing quantitative and qualitative factors. Although detailed credit rating reports are proprietary data provided by these agencies, concise reports can be publicly accessed such as this report on the credit rating of Birkenstock from June 2024.
In the context of leveraged finance, logically, the better the credit rating of a company, the lower the interest rate they can borrow at. This simply comes back to the idea that the company is less likely to fall into bankruptcy, meaning that the lenders are taking a lower risk and will settle for a lower level of interest.
Leveraged Loans: What are they and key characteristics
As was alluded to earlier, we will be discussing primarily leveraged loans, as this was the debt instrument most relevant to my internship experience.
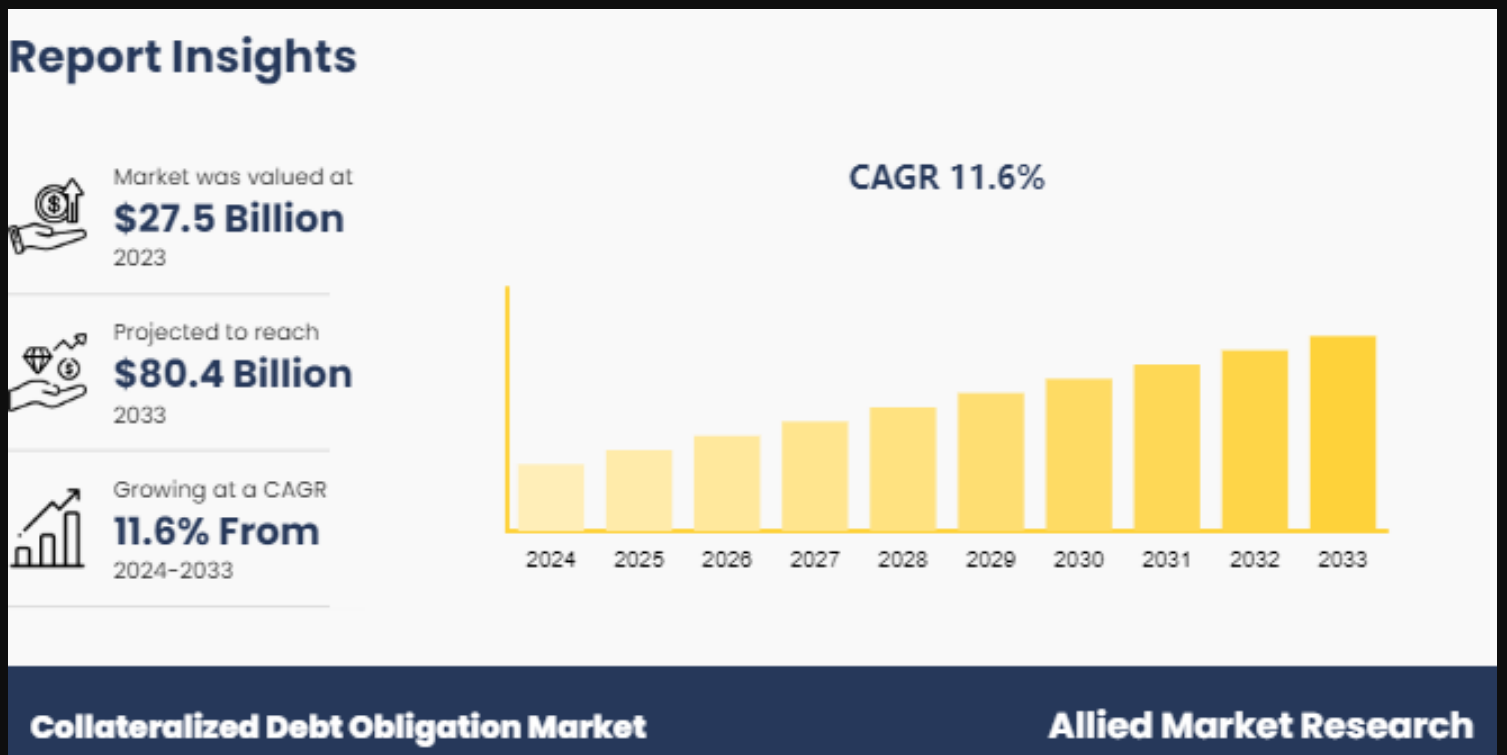
Leveraged loans are structured for institutional investors and syndicated broadly to lenders, including commercial banks, collateralized loan obligation (CLO) vehicles, hedge funds, pension funds, and insurance companies.
Most leveraged loans are senior secured instruments, meaning they are backed by the borrower’s assets and hold a first line claim in the capital structure. In the event of a default or bankruptcy, holders of these loans are first in line to be repaid from the liquidation of assets, ahead of subordinated debt and equity holders. This structural seniority tends to lower the expected loss in default scenarios. Capital structure and order of claims is vital for investors of junk and distressed debt, and I have included further readings at the end of this article which goes into further detail.
Key Characteristics of Leveraged Loans
- Secured: As mentioned, most leveraged loans are secured, often in the first or second lien, by assets owned by the company.
- Floating Interest Rates: This is very common for leveraged loans. The interest paid on the loan is typically tied to a benchmark reference rate such as the EURIBOR 3M in Europe, plus a credit spread of a certain level e.g. 450bps. Note that this benchmark is normally floored at 0%, meaning that regardless of the actual reference rate, it will not be lower than 0 for the transaction in question.
- Covenants: More restrictive due to the riskier nature of the debt. For clarity, covenants are clauses in the final agreement between the lender and the borrower which states certain aspects which the borrower must adhere to. This can include maximum Net Leverage ratios or limiting the ability to acquire other companies or participate in other activities. The limit is known as a basket; the dollar amount that a company may spend on specified activities, simply to minimise the chance that the borrower defaults.
- Amortisation and Maturity: This is not necessarily a feature exclusive to leveraged loans, but generally speaking, the principal amount of the loan is normally amortised over the tenor of the loan which tends to be in the range of 4-8 years, although this can vary slightly. Loans whose principal is repaid in one lump sum payment are known as having a bullet repayment profile. Furthermore, although not common, early repayment is normally allowed, granted that lenders receive a so-called repayment premium.
Players in a Leveraged Loan Transaction
Before going through the transaction process, it can be easy to get lost in who’s who and their role. Therefore, bullet pointed below are some of the key players who together facilitate the completion of a transaction:
- Borrower (Corporate or Portfolio Company). Typically a Speculative-grade company or a PE-sponsored portfolio company that is seeking to raise debt in order to achieve a certain goal e.g. fund acquisitions, refinance existing debt, or recapitalise the balance sheet. They will work together with the arranger to determine the structure, pricing, and timeline of the transaction whilst providing financial and operational data for due diligence and syndication.
- Private Equity firm (if applicable). In the case of an LBO, for example, they are the leading force behind a transaction which involves the acquisition of a portfolio company. They will aim to maximise their IRR by leveraging the capital structure with high amounts of debt, whilst coordinating with the arranger to secure favourable terms and negotiate loan covenants.
- Arranger/Lead Arranger/Mandated Leader Arranger. Works with the borrower to structure and underwrite the deal whilst advising on the loan size, maturity, interest margins, covenants, and any other aspect of the deal which is relevant. Oftentimes, they will also provide a bridge commitment or full underwriting prior to syndication, thus bearing the majority of the underwriting risk for which they will be rewarded with the largest portion of fees. Beside this, they will also prepare marketing materials which are provided to investors during the syndication including the Information Memorandum and the Lender’s Presentation.
- Bookrunner. This role can also be carried out by arrangers of a transaction, hence a specified bookrunner isn’t always present in a transaction. Their role is to manage the syndication process of the deal including investor outreach and roadshows, whilst also arranging Q&A sessions between borrowers and lenders. Finally, they also maintain the order book of the transaction, also leading the pricing and allocation of debt.
- Syndicate of Lenders. This group of investors can compromise of a variety of different players including banks, hedge funds, asset managers, and other institutional buyers. As investors, they will evaluate the transaction and decide whether to make an investment.
Transaction Process of Leveraged Loans: A Step-by-Step Overview Breakdown
A leveraged finance transaction can be a long process, with copious amounts of analysis required by front-office LevFin teams to ensure that the everyone involved in the process, predominately the potential lenders, have the complete image of the potential borrower and are able to evaluate the transaction to lead a successful execution of the deal.
We have created a bite-sized summary below of how a transaction tends to be structured, followed by a short case study in which I was in the LevFin team who were investors in the syndication of a deal, not the arrangers – the role often associated with leveraged finance divisions at investment banks. Not all LevFin divisions play the role of investors, many banks only structure and syndicate a transaction, but at Haitong this is not the case.
Origination and Identifying Opportunities
The transaction process begins with origination, where investment banks or financial institutions identify potential leveraged finance deals with their clients. Origination typically involves private equity firms, corporations, and advisory teams assessing market conditions, financing needs, and potential acquisition targets. During this stage, the parties will explore the strategic goals of the transaction, such as financing an LBO, acquisition, or debt refinancing. This step of the process is normally led by the arranger.
Structuring the Debt
The next step involves the arranger structuring the debt to determine the optimal mix of loan and bond financing. Key decisions include the selection of the debt instruments (i.e., senior loans, subordinated debt, or high-yield bonds) and the terms and conditions that will govern these instruments, which are found in a term sheet. The structure is typically designed to align with the cash flow capabilities of the borrower while balancing the need for high returns for the lenders and investors. It is crucial to design the structure so that it is financially sustainable over time, without overburdening the company with debt.
Underwriting
This is an extension of the previous step in which a more detailed plan of the debt structure is organised by the arranger. Underwriting is a critical step where the investment bank assumes the responsibility for issuing the debt. During underwriting, the bank will assess the creditworthiness of the borrower, including detailed analysis of the company’s financials, industry, and cash flow projections. The pricing of the debt is also determined, which reflects the risk premium for the borrower’s credit quality. A higher-risk borrower will face higher interest rates and more stringent terms to compensate for the increased risk of default, as we have previously explored.
Syndication – Spreading risk across multiple lenders
In leveraged finance transactions, especially those with large debt amounts, syndication is a common practice. Syndication allows a group of lenders to provide portions of the loan, spreading the risk and reducing individual exposure. Typically, a lead bank (arranger or bookrunner) will organise the syndicate, and the transaction will be marketed to other banks and institutional investors. This process helps ensure that the transaction is fully subscribed and that the risk is distributed across multiple participants. During this phase, significant discussion is held between interested investors in which they can also negotiate certain covenants of the loan with the arranging bank.
Case Study: From the Perspective of an Investor
To give a bit more of an insight, I will describe the process which I participated in on the buyside of leveraged loan transaction whilst providing useful tips to avoid mistakes that I made during my first stint in LevFin. It is worth nothing that whilst every firm has slightly different internal procedures, after having spoken to other industry professionals, a similar structure is common. I’ve chosen to describe the buyside because if you are working in a traditional LevFin division, you are ultimately trying to sell a product; the debt, and gaining an insight into how a buyer acts can help to understand what they are looking for.
With regards to the transaction, sensitive information cannot be disclosed, but it involved the financing of a PE firm’s majority-stake acquisition of a high-end global consumer goods brand, in which circa half of the overall transaction value, in the nine-figure range, was funded via debt with the remaining being equity provided by the acquirer.
Invitation
Last year, we were contacted by the arranging bank of the transaction, and we were invited to participate in the syndication of a leveraged loan including a Revolving Credit Facility (RCF), the former of which’s primary purpose was to finance the acquisition of a majority-stake in the target company. The RCF was for General Corporate Purposes.
Once the invitation was accepted, the legal department of Haitong signed a Non-Disclosure Agreement (NDA), and we received all of the material which would allow us and any other potential investor to evaluate the feasibility of the deal. This included the Info Memo, Lender’s Presentation, financial statements of the target company, financial forecasts of the target company, indicative term sheet, and all due diligence, of which the latter constituted of around 3,000 pages of vendor due diligence, financial due diligence, tax due diligence, legal due diligence amongst others.
Initial Analysis on Feasibility of Transaction Participation
The first step when receiving all this material, at least when following the procedure during my internship, is creating a model which creates an estimate for the Return on Investment (ROI). The reason for this is that according to internal policies, we need to have a weighted-average ROI above a certain threshold when investing in debt securities, and should the ROI not be compatible, then we cannot move ahead with the transaction. It would be redundant to complete a full analysis of the transaction, only to realise after that it is not feasible.
Building this model is a fairly straight-forward task once familiar with the mechanics of the model. It relied on various inputs of which the most notable were a) the margin of the loan b) the tenor of the loan c) the credit rating of the borrower. However, the borrower of the transaction, also the target company of the acquirer, was a private company and did not have a credit rating provided by any rating agency, thus I had to make a credit assessment of the borrower.
At Haitong, we used the S&P Methodology when constructing these ratings, and as you will recall from earlier, this entails conducting a thorough analysis on the quantitative and qualitative factors of the company. Quantitative inputs when creating a credit assessment report are largely historical – looking at the past financial performance of the company, whereas the qualitative inputs are more forward-looking, examining factors relating to market risk, for example, which could hinder future growth. In this instance, I had plenty of due diligence material which helped me to evaluate all the metrics which together helped provide a final credit rating, which indicated that the borrower was highly rated within the speculative-grade classification, circa BB.
The initial ROI calculation on this transaction indicated a 14% return, a rather significant figure given the initial credit rating, surpassing our internal requirements, thus we could proceed to complete the first stage of our internal processes, known as ‘pre-screening’. This is a circa 10-minute presentation in which the front office staff such as myself have to present an overview of a proposed transaction to senior decision makers at the bank, often involving senior managing directors, with the goal to gain initial approval to move onto the next stage of the process. It is worth mentioning, that such a transaction, like any other, has a buyer and seller (in this case the debt). Therefore, at this stage, there can exist an opportunity to negotiate the terms of the debt, if you deem that the loan has been priced too conservatively i.e., that the interest margin is too low for the level of risk involved.
Preparation of Pre-Screening Presentation
For about two weeks, I would sift through countless documents extracting the most important aspects of the transaction and the borrower, so that when I presented this information to the senior members, I would clearly be able to describe the proposed deal including its purpose, security (collateral) put up amongst other aspects. In addition, I would have the answers to any question they could ask me whether it be about the covenants of the term sheet, the borrower’s supply chain or their growth strategies. However, given the early stage, this presentation, as indicated by the name, is merely a screening of the transaction and in-depth analysis is not yet required.
When looking at such a transaction, whilst it is good to know the reasons why this transaction can be beneficial to the bank, it is even more important to understand the risks involved, ranging from market risk to business risk.
If there was one thing that I would like you to take away, it would be to not underestimate the importance of the term sheet/senior facilities agreement. This is a document which lays out all the terms and conditions of a loan, almost like rulebook which the borrower and lender must abide by. Simply put, you are providing tens of millions of euros to a company, and this document will spell out your rights, and seek to contain the risk involved in a transaction. Understanding such a document is not easy, they are extremely long and written in legal jargon, but in doing so you understand how your risk is being minimised through what is spelled out in the term sheet/senior facilities agreement and provides you with an understanding as to what happens in case of default by the borrower and how you can make claims to make up for monetary losses – a worst case scenario.
The challenge in presenting a transaction is that you have to be as thorough as you can whilst keeping it as concise as possible. It is easy to focus on unimportant aspects, wasting valuable time to convince your audience/decision-makers to support your case. Equally, however, after having spent 2 weeks gathering information non-stop, it can be easy to forget that your audience have no context as to what you’re speaking about, and you must make every point abundantly clear.
I think that anyone who has worked in investment banking can share a similar sentiment that bankers are impatient, and I count myself as part of that group; they want as much information in as little time as possible, and if you can’t communicate effectively, you will struggle to succeed. I have been on both sides of this but as an example, prior to this transaction, I had failed to do so, and I did not gain approval to move ahead with the transaction despite its strong fundamentals.
In the end, after answering a few questions from the senior bankers pertaining to the pro-forma structure after closing of the acquisition and the supply chain risk, we gained approval to move forward to present in front of the Executive Committee (ExCo), a 20-minute presentation with a Q&A session thereafter. At this point, you are presenting in front of the most senior bankers in the firm including the CEO.
Preparing for the ExCo
This is by far the most challenging part of a transaction from a buyside perspective. You, as a front office employee, are coordinating with several departments internally at the bank such as portfolio management and risk, as well as the arranging bank to request more information which you require to conduct a full analysis. Alongside doing so, you are ensuring the constant progress of the transaction, knowing that there are commitment deadlines after which point you will not be allowed to invest into the transaction.
The key is to keep organised, and that applies to everything.
You will have hundreds of documents related to one particular transaction being sent around from different departments, ranging from legal compliance certificates to intricate financial models. Therefore, I urge you that from the start, before even having reached this point, that you create neatly organised desktop folders, special Outlook folders – this will save the team time and avoid miscommunications and costly time delays. Even seemingly less important things such as formatting conventions when building financial models in Excel will minimise errors and spare you hours of time looking for a singular source of circularity across 20 tabs late at night.
For example, during this transaction, a modified financial model which had originally been provided by the arranging bank was sent to the risk department from a front office member, not the original as thought. When this was made apparent when the risk analyst presented their findings after a weeks’ worth of work, it almost caused us to miss the commitment deadline. Fortunately, the ramifications weren’t significant, but an addition of a singular row in the original Excel could have costed us this transaction, highlighting the importance of being organised and having extreme attention to detail.
With regards to the tasks involved in this stage, it is an extension of the first phase before presenting for the Pre-Screening, the difference being that this time you go into much more detail. You are expected to understand all of the risks involved in this transaction, and you are expected to have incorporated these risks into quantifiable figures which are modelled in Excel through a forecast looking circa 5 years ahead. Therefore, being not only proficient in using Excel, but being able to create integrated forecasts for particularly the Income Statement and Cash Flow Statement, is vital, particularly if you want to set yourself apart from others in an industry which is already extremely competitive.
These scenario and sensitivity analyses are typically derived from management forecasts and due diligence reports which cover all business areas. But once again, you are expected to present your finding in a concise manner whilst relaying the most important aspects of the transaction, with a particular focus on the risks and mitigants, strengthening your case.
The loan in question for this transaction had a tenor of 7 years, meaning that it would mature in mid-2031, and had a bullet repayment profile. When looking at a transaction whose repayment is structured like so, one of the largest risks is the refinancing risk; the risk which looks at a borrower’s ability to issue new debt before the existing debt matures to be able to repay this existing debt. If a borrower is unlikely to be able raise debt, it would be extremely difficult to justify investing in such debt.
For this deal, there was some doubt raised as to the borrower’s ability to meet this criterion, with downside case cash flow forecasts indicating that it would potentially become an issue. However, my team were confident in the company’s financial trajectory based upon our analyses, that would see it unlikely that the downside case would be what we would ultimately see down the line. Coupled with a strong core business, we were able to mute these doubts.
As was alluded to earlier, this was senior secured debt, meaning that the borrower posted security over items such as bank accounts, accounts receivable, and other assets on the balance sheet. However, there was some concern from the ExCo regarding this as a significant portion of the assets on the borrower’s project balance sheet was tied to goodwill, an intangible asset which cannot be converted to physical cash. Despite this, we deemed that the PE sponsor of the transaction mitigated part of this risk, as well as historical data indicating that the company would continue to grow exponentially throughout the tenor of the loan.
After a 2-hour presentation and Q&A session, we gained approval for this transaction, at which the legal department from each respective bank (Haitong and the arranger) would finalise the documentation. At this point, the grunt work is done and the only remaining thing is to complete Key Your Customer (KYC) forms.
Takeaways from my Internship Experience
Overall, my internship in leveraged finance provided me with invaluable insight into the fast-paced and intellectually challenging world of structured debt. I developed a strong understanding of how complex transactions are structured, from initial credit analysis to syndication and documentation. One of my key takeaways was the importance of balancing risk and return – not just in terms of financial metrics, but also in assessing the borrower’s industry dynamics, capital structure, and covenant protections. I also gained exposure to how lenders protect themselves through mechanisms like security interests and covenants, such as more complicated uses of floating charges over assets. Beyond technical knowledge, I learned the importance of attention to detail, clear communication, and collaboration across teams, all of which are essential in executing successful deals. By the end of the 9-month period, the experience solidified my interest in pursuing a career in leveraged finance.
Three Skills to Bring into a Role in Leveraged Finance
Finally, to pass on some wisdom to those who would perhaps be interested in pursuing career or just an internship in LevFin… Whilst there are many skills which are rather general to be able to succeed in finance and/or investment banking such as understanding the relationship between the three financial statements and being able to build a 3FS model from scratch, I will focus on three which are slightly more relevant when working in a Leveraged Finance division.
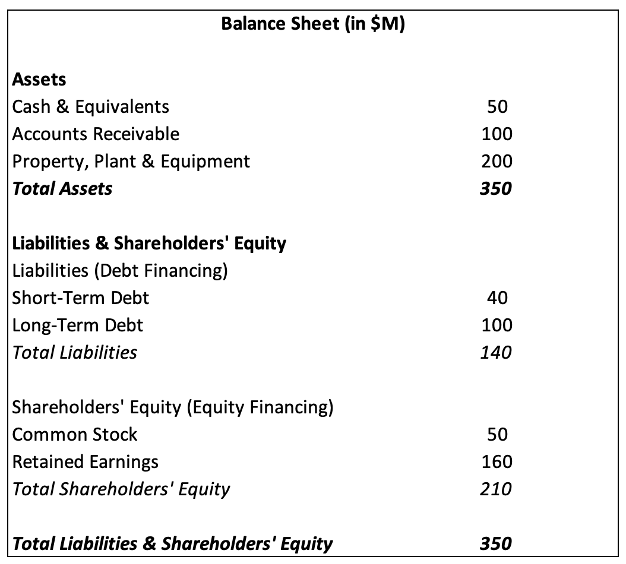
Deep understanding of capital structure
A comprehensive understanding of capital structure is foundational in LevFin, as it underpins nearly every transaction the team is involved in. Analysts must assess how different layers of financing, ranging from senior secured debt to mezzanine and equity, interact within a company’s balance sheet. This knowledge is essential for determining how much debt a company can sustain, how it should be structured, and where different investors sit in the hierarchy of repayment in the event of default. For instance, in an LBO, the sponsor and the arranging bank must work closely to optimise the mix of debt and equity in order to minimize the cost of capital while preserving financial flexibility. A firm grasp of capital structure also allows analysts to assess the impact of leverage on valuation, control, and credit risk, ensuring that the financing solution supports the strategic objectives of both the borrower and the investor base. At the end of this article, I have provided names of books and further readings including a book by Stephen Moyer. This is the gold standard when learning about capital structure and would thoroughly recommend it to those looking to further their knowledge.
Organisation
It may seem like an obvious soft skill to have, but its importance cannot be overstated. From the first day, as a LevFin analyst you need to give yourself the best possible to succeed in a high-tempo environment. If you are working within origination, it is possible that you are working on up to 6-7 deals at once which means that you are working with hundreds of documents, creating info memos, lenders’ presentations, financial forecasts etc. These documents will be sent around from different companies and departments, ranging from legal compliance certificates to intricate financial models. Therefore, I urge you that from the start, before even having reached this point, that you create neatly organised desktop folders, special Outlook folders – this will save the team time and avoid miscommunications and costly time delays. Even seemingly less important things such as formatting conventions when building financial models in Excel will minimise errors and spare you hours of time looking for a singular source of circularity across 20 tabs late at night.
Clear communication
This refers to both oral and written communication. Aside from being an essential skill in any workplace, it is even more key when working in LevFin. Whether you are working in origination, and structuring a transaction and creating marketing materials, or acting on the buyside of the deal, you will have to communicate with other parties, internally and externally, create summaries and presentations for a specific audience for a specific goal in mind. This is especially a challenge given the complicated nature of leveraged finance transactions. The best communicators are those who make the complex idea seem simple, and if you can master this art which is extremely difficult, you’re halfway there.
Related Posts on the SimTrade Blog
Financial concepts
▶ Lilian BALLOIS Discovering Private Equity: Behind the Scenes of Fund Strategies
▶ Matisse FOY Key participants in the Private Equity ecosystem
▶ Lilian BALLOIS M&A Strategies: Benefits and Challenges
▶ Raphaël ROERO DE CORTANZE Credit Rating Agencies
▶ Dante MARRAMIERO Structured Debt in Private Equity: Rated Feeder Funds and Collateral Fund Obligations
Professional experiences
▶ Louis DETALLE A quick review of the DCM (Debt Capital Market) analyst’s job…
▶ Louis DETALLE A quick review of the ECM (Equity Capital Market) analyst’s job…
▶ Yann-Ray KAMANOU TAWAMBA My internship experience at Natixis
▶ Basma ISSADIK My experience as an M&A Analyst Intern at Oaklins Atlas Capital
Useful Resources
LCD Leveraged Loan Primer, S&P. This article was a brief, non-technical overview of leveraged finance, and specifically leveraged loans. If you want to understand more about such topics, primers are a great source of information for understanding market dynamics and trends, as well as other characteristics of loans.
Moyer S.G. (2004) Distressed Debt Analysis: Strategies for Speculative Investors, J. Ross Publishing. The gold standard for those who want to work in restructuring (but also LevFin), this is a rather in-depth read, and ventures into how firms such as hedge funds evaluate distressed debt investment opportunities. However, the first circa 250 pages are extremely information when learning about topics such as capital structure which is imperative for leveraged finance.
About the Author
The article was written in April 2025 by Max ODEN (ESSEC Business School, Bachelor in Business Administration, 2021-25). Should you have any questions for Max, or simply connect, do not hesitate to reach out to him on LinkedIn.