Hedge fund diversification

Youssef LOURAOUI

In this article, Youssef LOURAOUI (Bayes Business School, MSc. Energy, Trade & Finance, 2021-2022) discusses the notion of hedge fund diversification by analyzing the paper “Hedge fund diversification: how much is enough?” by Lhabitant and Learned (2002).

This article is organized as follows: we describe the primary characteristics of the research paper. Then, we highlight the research paper’s most important points. This essay concludes with a discussion of the principal findings.

Introduction

The paper discusses the advantages of investing in a set of hedge funds or a multi-strategy hedge fund. It is a relevant subject in the field of alternative investments since it has attracted the interest of institutional investors seeking to uncover the alternative investment universe and increase their portfolio return. The paper’s primary objective is to determine the appropriate number of hedge funds that an portfolio manager should combine in its portfolio to maximise its (expected) returns. The purpose of the paper is to examine the impact of adding hedge funds to a traditional portfolio and its effect on the various statistics (average return, volatility, skewness, and kurtosis). The authors consider basic portfolios (randomly chosen and equally-weighted portfolios). The purpose is to evaluate the diversification advantage and the dynamics of the diversification effect of hedge funds.

Key elements of the paper

The pioneering work of Henry Markowitz (1952) depicted the effect of diversification by analyzing the portfolio asset allocation in terms of risk and (expected) return. Since unsystematic risk (specific risk) can be neutralized, investors will not receive an additional return. Systematic risk (market risk) is the component that the market rewards. Diversification is then at the heart of asset allocation as emphasized by Modern Portfolio Theory (MPT). The academic literature has since then delved deeper on the analysis of the optimal number of assets to hold in a well-diversified portfolio. We list below some notable contributions worth mentioning:

  • Elton and Gruber (1977), Evans and Archer (1968), Tole (1982) and Statman (1987) among others delved deeper into the optimal number of assets to hold to generate the best risk and return portfolio. There is no consensus on the optimal number of assets to select.
  • Evans and Archer (1968) depicted that the best results are achieved with 8-10 assets, while raising doubts about portfolios with number of assets above the threshold. Statman (1987) concluded that at least thirty to forty stocks should be included in a portfolio to achieve the portfolio diversification.

Lhabitant and Learned (2002) also mention the concept of naive diversification (also known as “1/N heuristics”) is an allocation strategy where the investor split the overall fund available is distributed into same. Naive diversification seeks to spread asset risk evenly in the portfolio to reduce overall risk. However, the authors mention important considerations for naïve/Markowitz optimization:

  • Drawback of naive diversification: since it doesn’t account for correlation between assets, the allocation will yield a sub-optimal result and the diversification won’t be fully achieved. In practice, naive diversification can result in portfolio allocations that lie on the efficient frontier. On the other hand, mean-variance optimisation, the framework revolving he Modern Portfolio Theory is subject to input sensitivity of the parameters used in the optimization process. On a side note, it is worth mentioning that naive diversification is a good starting point, better than gut feeling. It simplifies allocation process while also benefiting by some degree of risk diversification.
  • Non-normality of distribution of returns: hedge funds exhibit non-normal returns (fat tails and skewness). Those higher statistical moments are important for investors allocation but are disregarded in a mean-variance framework.
  • Econometric difficulties arising from hedge fund data in an optimizer framework. Mean-variance optimisers tend to consider historical return and risk, covariances as an acceptable point to assess future portfolio performance. Applied in a construction of a hedge fund portfolio, it becomes even more difficult to derive the expected return, correlation, and standard deviation for each fund since data is scarcer and more difficult to obtain. Add to that the instability of the hedge funds returns and the non-linearity of some strategies which complicates the evaluation of a hedge fund portfolio.
  • Operational risk arising from fund selection and implementation of the constraints in an optimiser software. Since some parameters are qualitative (i.e., lock up period, minimum investment period), these optimisers tool find it hard to incorporate these types of constraints in the model.

Conclusion

Due to entry restrictions, data scarcity, and a lack of meaningful benchmarks, hedge fund investing is difficult. The paper analyses in greater depth the optimal number of hedge funds to include in a diversified portfolio. According to the authors, adding funds naively to a portfolio tends to lower overall standard deviation and downside risk. In this context, diversification should be improved if the marginal benefit of adding a new asset to a portfolio exceeds its marginal cost.

The authors reiterate that investors should not invest “naively” in hedge funds due to their inherent risk. The impact of naive diversification on the portfolio’s skewness, kurtosis, and overall correlation structure can be significant. Hedge fund portfolios should account for this complexity and examine the effect of adding a hedge fund to a well-balanced portfolio, taking into account higher statistical moments to capture the allocation’s impact on portfolio construction. Naive diversification is subject to the selection bias. In the 1990s, the most appealing hedge fund strategy was global macro, although the long/short equity strategy acquired popularity in the late 1990s. This would imply that allocations will be tilted towards these two strategies overall.

The answer to the title of the research paper? Hedge funds portfolios should hold between 15 and 40 underlying funds, while most diversification benefits are reached when accounting with 5 to 10 hedge funds in the portfolio.

Why should I be interested in this post?

The purpose of portfolio management is to maximise returns on the entire portfolio, not just on one or two stocks. By monitoring and maintaining your investment portfolio, you can accumulate a substantial amount of wealth for a range of financial goals, such as retirement planning. This article facilitates comprehension of the fundamentals underlying portfolio construction and investing. Understanding the risk/return profiles, trading strategy, and how to incorporate hedge fund strategies into a diversified portfolio can be of great interest to investors.

Related posts on the SimTrade blog

   ▶ Youssef LOURAOUI Introduction to Hedge Funds

   ▶ Youssef LOURAOUI Equity market neutral strategy

   ▶ Youssef LOURAOUI Fixed income arbitrage strategy

   ▶ Youssef LOURAOUI Global macro strategy

   ▶ Youssef LOURAOUI Long/short equity strategy

   ▶ Youssef LOURAOUI Portfolio

Useful resources

Academic research

Elton, E., and M. Gruber (1977). “Risk Reduction and Portfolio Size: An Analytical Solution.” Journal of Business, 50. pp. 415-437.

Evans, J.L., and S.H. Archer (1968). “Diversification and the Reduction of Dispersion: An Empirical Analysis”. Journal of Finance, 23. pp. 761-767.

Lhabitant, François S., Learned Mitchelle (2002). “Hedge fund diversification: how much is enough?” Journal of Alternative Investments. pp. 23-49.

Markowitz, H.M (1952). “Portfolio Selection.” The Journal of Finance, 7, pp. 77-91.

Statman, M. (1987). “How many stocks make a diversified portfolio?”, Journal of Financial and Quantitative Analysis , pp. 353-363.

Tole T. (1982). “You can’t diversify without diversifying”, Journal of Portfolio Management, 8, pp. 5-11.

About the author

The article was written in January 2023 by Youssef LOURAOUI (Bayes Business School, MSc. Energy, Trade & Finance, 2021-2022).

Equity market neutral strategy

Youssef LOURAOUI

In this article, Youssef LOURAOUI (Bayes Business School, MSc. Energy, Trade & Finance, 2021-2022) presents the equity market neutral strategy. The objective of the equity market neutral strategy is to benefit from both long and short positions while minimizing the exposure to the equity market fluctuations.

This article is structured as follow: we introduce the equity market neutral strategy. Then, we present a practical case study to grasp the overall methodology of this strategy. We conclude with a performance analysis of this strategy in comparison with a global benchmark (MSCI All World Index and the Credit Suisse Hedge Fund index).

Introduction

According to Credit Suisse (a financial institution publishing hedge fund indexes), an equity market neutral strategy can be defined as follows: “Equity Market Neutral funds take both long and short positions in stocks while minimizing exposure to the systematic risk of the market (i.e., a beta of zero is desired). Funds seek to exploit investment opportunities unique to a specific group of stocks, while maintaining a neutral exposure to broad groups of stocks defined for example by sector, industry, market capitalization, country, or region. There are a number of sub- sectors including statistical arbitrage, quantitative long/short, fundamental long/short and index arbitrage”. This strategy makes money by holding assets that are decorrelated from a specific benchmark. The strategy can potentially generate returns in falling markets.

Mathematical foundation for the beta

This strategy relies heavily on the beta, derived from the capital asset pricing model (CAPM). Under this framework, we can relate the expected return of a given asset and its risk:

CAPM

Where :

  • E(r) represents the expected return of the asset
  • rf the risk-free rate
  • β a measure of the risk of the asset
  • E(rm) the expected return of the market
  • E(rm) – rf represents the market risk premium.

In this model, the beta (β) parameter is a key parameter and is defined as:

Beta

Where:

  • Cov(r, rm) represents the covariance of the asset return with the market return
  • σ2(rm) is the variance of market return.

The beta is a measure of how sensitive an asset is to market swings. This risk indicator aids investors in predicting the fluctuations of their asset in relation to the wider market. It compares the volatility of an asset to the systematic risk that exists in the market. The beta is a statistical term that denotes the slope of a line formed by a regression of data points comparing stock returns to market returns. It aids investors in understanding how the asset moves in relation to the market. According to Fama and French (2004), there are two ways to interpret the beta employed in the CAPM:

  • According to the CAPM formula, beta may be thought in mathematical terms as the slope of the regression of the asset return on the market return observed on different periods. Thus, beta quantifies the asset sensitivity to changes in the market return;
  • According to the beta formula, it may be understood as the risk that each dollar invested in an asset adds to the market portfolio. This is an economic explanation based on the observation that the market portfolio’s risk (measured by 〖σ(r_m)〗^2) is a weighted average of the covariance risks associated with the assets in the market portfolio, making beta a measure of the covariance risk associated with an asset in comparison to the variance of the market return.

Additionally, the CAPM makes a distinction between two forms of risk: systematic and specific risk. Systematic risk refers to the risk posed by all non-diversifiable elements such as monetary policy, political events, and natural disasters. By contrast, specific risk refers to the risk inherent in a particular asset and so is diversifiable. As a result, the CAPM solely captures systematic risk via the beta measure, with the market’s beta equal to one, lower-risk assets having a beta less than one, and higher-risk assets having a beta larger than one.

Application of an equity market neutral strategy

For the purposes of this example, let us assume that a portfolio manager wants to invest $100 million across a diverse equity portfolio while maintaining market-neutral exposure to market index changes. To create an equity market-neutral portfolio, we use five stocks from the US equity market: Apple, Amazon, Microsoft, Goldman Sachs, and Pfizer. Using monthly data from Bloomberg for the period from 1999 to 2022, we compute the returns of these stocks and their beta with the US equity index (S&P500). Using the solver function on Excel, we find the weights of the portfolio with the maximum expected return with a beta equal to zero.

Table 1 displays the target weights needed to build a portfolio with a neutral view on the equity market. As shown by the target allocation in Table 1, we can immediately see a substantial position of 186.7 million dollars on Pfizer while keeping a short position on the remaining equity positions of the portfolio totaling 86.7 million dollars in short positions. Given that the stocks on the short list have high beta values (more than one), this allocation makes sense. Pfizer is the only defensive stock and has a beta of 0.66 in relation to the S&P 500 index.

If the investment manager allocated capital in the following way, he would create an equity market neutral portfolio with a beta of zero:

Apple: -$4.6 million (-4.6% of the portfolio; a weighted-beta of -0.066)
Amazon: -$39.9 million (-39.9% of the portfolio; a weighted-beta of -0.592)
Microsoft: -$16.2 million (-16.2% of the portfolio; a weighted-beta of -0.192)
Goldman Sachs: -$26 million (-26% of the portfolio; a weighted-beta of -0.398)
Pfizer: $186.7 million (186.7% of the portfolio; a weighted-beta of 1.247)

Table 1. Target weights to achieve an equity market neutral portfolio.
Target weights to achieve an equity market neutral portfolio. Source: computation by the author (Data: Bloomberg)

You can find below the Excel spreadsheet that complements the explanations about the equity market neutral portfolio.

 Equity market neutral strategy

An extension of the equity market neutral strategy to other asset classes

A portfolio with a beta of zero, or zero systematic risk, is referred to as a zero-beta portfolio. A portfolio with a beta of zero would have an expected return equal to the risk-free rate. Given that its expected return is equal to the risk-free rate or is relatively low compared to portfolios with a higher beta. Such portfolio would have no correlation with market movements.

Since a zero-beta portfolio has no market exposure and would consequently underperform a diversified market portfolio, it is highly unlikely that investors will be interested in it during bull markets. During a bear market, it may garner some interest, but investors are likely to ask if investing in risk-free, short-term Treasuries is a better and less expensive alternative to a zero-beta portfolio.

For this example, we imagine the case of a portfolio manager wishing to invest 100M$ across a diversified portfolio, while holding a zero-beta portfolio with respect to a broad equity index benchmark. To recreate a diversified portfolio, we compiled a shortlist of trackers that would represent our investment universe. To maintain a balanced approach, we selected trackers that would represent the main asset classes: global stocks (VTI – Vanguard Total Stock Market ETF), bonds (IEF – iShares 7-10 Year Treasury Bond ETF and TLT – iShares 20+ Year Treasury Bond ETF), and commodities (DBC – Invesco DB Commodity Index Tracking Fund and GLD – SPDR Gold Shares).

To construct the zero-beta portfolio, we pulled a ten-year time series from Refinitiv Eikon and calculated the beta of each asset relative to the broad stock index benchmark (VTI tracker). The target weights to create a zero-beta portfolio are shown in Table 2. As captured by the target allocation in Table 2, we can clearly see an important weight for bonds of different maturities (56.7%), along with a 33.7% towards commodities and a small allocation towards global equity equivalent to 9.6% (because of the high beta value).

If the investment manager allocated capital in the following way, he would create a zero-beta portfolio with a beta of zero:

VTI: $9.69 million (9.69% of the portfolio; a weighted-beta of 0.097)
IEF: $18.99 million (18.99% of the portfolio; a weighted-beta of -0.029)
GLD: $18.12 million (18.12% of the portfolio; a weighted-beta of 0.005)
DBC: $15.5 million (15.50% of the portfolio; a weighted-beta of 0.070)
TLT: $37.7 million (37.7% of the portfolio; a weighted-beta of -0.143)

Table 2. Target weights to achieve a zero-beta portfolio.
Target weights to achieve a zero-beta portfolio Source: computation by the author. (Data: Reuters Eikon)

You can find below the Excel spreadsheet that complements the explanations about the zero beta portfolio.

Zero beta portfolio

Performance of the equity market neutral strategy

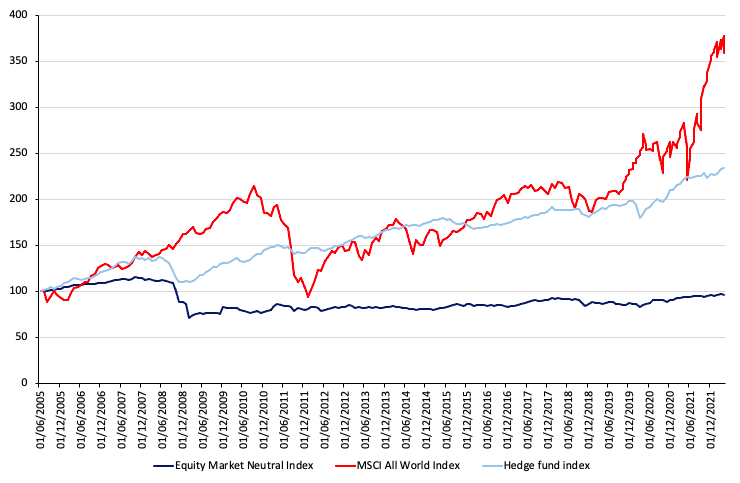
To capture the performance of the equity market neutral strategy, we use the Credit Suisse hedge fund strategy index. To establish a comparison between the performance of the global equity market and the equity market neutral strategy, we examine the rebased performance of the Credit Suisse managed futures index with respect to the MSCI All-World Index.

The equity market neutral strategy generated an annualized return of -0.18% with an annualized volatility of 7.5%, resulting in a Sharpe ratio of -0.053. During the same time period, the Credit Suisse Hedge Fund index had an annualized return of 4.34 percent with an annualized volatility of 5.64 percent, resulting in a Sharpe ratio of 0.174. With a neutral market beta exposure of 0.04, the results are consistent with the theory that this approach does not carry the equity risk premium. This aspect justifies the underperformance.

Figure 1 gives the performance of the equity market neutral funds (Credit Suisse Equity Market Neutral Index) compared to the hedge funds (Credit Suisse Hedge Fund index) and the world equity funds (MSCI All-World Index) for the period from July 2002 to April 2021.

Figure 1. Performance of the equity market neutral strategy.
Performance of the equity market neutral strategy
Source: computation by the author (Data: Bloomberg)

You can find below the Excel spreadsheet that complements the explanations about the Credit Suisse equity market neutral strategy.

 Equity market neutral performance

Why should I be interested in this post?

Understanding the performance and risk of the equity market neutral strategy might assist investors in incorporating this hedge fund strategy into their portfolio allocation.

Related posts on the SimTrade blog

Hedge funds

   ▶ Youssef LOURAOUI Introduction to Hedge Funds

   ▶ Youssef LOURAOUI Global macro strategy

   ▶ Youssef LOURAOUI Long/short equity strategy

Financial techniques

   ▶ Youssef LOURAOUI Yield curve structure and interet rate calibration

   ▶ Akshit GUPTA Interest rate swaps

   ▶ Youssef LOURAOUI Portfolio

Useful resources

Academic research

Pedersen, L. H., 2015. Efficiently Inefficient: How Smart Money Invests and Market Prices Are Determined. Princeton University Press.

Business Analysis

Credit Suisse Hedge fund strategy

Credit Suisse Hedge fund performance

Credit Suisse Equity market neutral strategy

Credit Suisse Equity market neutral performance benchmark

About the author

The article was written in January 2023 by Youssef LOURAOUI (Bayes Business School, MSc. Energy, Trade & Finance, 2021-2022).

Fixed-income arbitrage strategy

Fixed-income arbitrage strategy

Youssef LOURAOUI

In this article, Youssef LOURAOUI (Bayes Business School, MSc. Energy, Trade & Finance, 2021-2022) presents the fixed-income arbitrage strategy which is a well-known strategy used by hedge funds. The objective of the fixed-income arbitrage strategy is to benefit from trends or disequilibrium in the prices of fixed-income securities using systematic and discretionary trading strategies.

This article is structured as follow: we introduce the fixed-income arbitrage strategy principle. Then, we present a practical case study to grasp the overall methodology of this strategy. We also present a performance analysis of this strategy and compare it a benchmark representing all hedge fund strategies (Credit Suisse Hedge Fund index) and a benchmark for the global equity market (MSCI All World Index).

Introduction

According to Credit Suisse (a financial institution publishing hedge fund indexes), a fixed-income arbitrage strategy can be defined as follows: “Fixed-income arbitrage funds attempt to generate profits by exploiting inefficiencies and price anomalies between related fixed-income securities. Funds limit volatility by hedging out exposure to the market and interest rate risk. Strategies include leveraging long and short positions in similar fixed-income securities that are related either mathematically or economically. The sector includes credit yield curve relative value trading involving interest rate swaps, government securities and futures, volatility trading involving options, and mortgage-backed securities arbitrage (the mortgage-backed market is primarily US-based and over-the-counter)”.

Types of arbitrage

Fixed-income arbitrage makes money based on two main underlying concepts:

Pure arbitrage

Identical instruments should have identical price (this is the law of one price). This could be the case, for instance, of two futures contracts traded on two different exchanges. This mispricing could be used by going long the undervalued contract and short the overvalued contract. This strategy uses to work in the days before the rise of electronic trading. Now, pure arbitrage is much less obvious as information is accessible instantly and algorithmic trading wipe out this kind of market anomalies.

Relative value arbitrage

Similar instruments should have a similar price. The fundamental rationale of this type of arbitrage is the notion of reversion to the long-term mean (or normal relative valuations).

Factors that influence fixed-income arbitrage strategies

We list below the sources of market inefficiencies that fixed-income arbitrage funds can exploit.

Market segmentation

Segmentation is of concern for fixed-income arbitrageurs. In financial institutions, the fixed-income desk is split into different traders looking at specific parts of the yield curve. In this instance, some will focus on very short, dated bonds, others while concentrate in the middle part of the yield curve (2-5y) while other while be looking at the long-end of the yield curve (10-30y).

Regulation

Regulation has an implication in the kind of fixed-income securities a fund can hold in their books. Some legislations regulate actively to have specific exposure to high yield securities (junk bonds) since their probability of default is much more important. The diminished popularity linked to the tight regulation can make the valuation of those bonds more attractive than owning investment grade bonds.

Liquidity

Liquidity is also an important concern for this type of strategy. The more liquid the market, the easier it is to trade and execute the strategy (vice versa).

Volatility

Large market movements in the market can have implications to the profitability of this kind of strategy.

Instrument complexity

Instrument complexity can also be a reason to have fixed-income securities. The events of 2008 are a clear example of how banks and regulators didn’t manage to price correctly the complex instruments sold in the market which were highly risky.

Application of a fixed-income arbitrage

Fixed-income arbitrage strategy makes money by focusing on the liquidity and volatility factors generating risk premia. The strategy can potentially generate returns in both rising and falling markets. However, understanding the yield curve structure of interest rates and detecting the relative valuation differential between fixed-income securities is the key concern since this is what makes this strategy profitable (or not!).

We present below a case study related tot eh behavior of the yield curves in the European fixed-income markets inn the mid 1990’s

The European yield curve differential during in the mid 1990’s

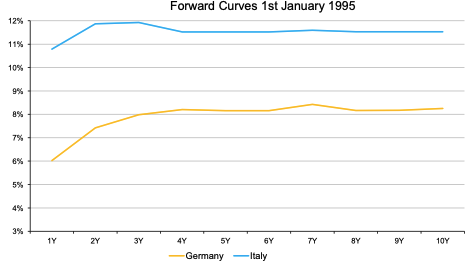
The case showed in this example is the relative-value trade between Germany and Italian yields during the period before the adoption of the Euro as a common currency (at the end of the 1990s). The yield curve should reflect the future path of interest rates. The Maastricht treaty (signed on 7th February 1992) obliged most EU member states to adopt the Euro if certain monetary and budgetary conditions were met. This would imply that the future path of interest rates for Germany and Italy should converge towards the same values. However, the differential in terms of interest rates at that point was nearly 350 bps from 5-year maturity onwards (3.5% spread) as shown in Figure 1.

Figure 1. German and Italian yield curve in January 1995.
German and Italian yield curve in January 1995
Source: Motson (2022) (Data: Bloomberg).

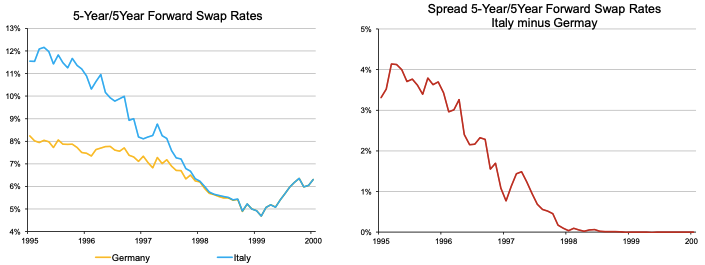
A fixed-income arbitrageur could have profited by entering in an interest rate swap where the investor receives 5y-5y forward Italian rates and pays 5y-5y German rates. If the Euro is introduced, then the spread between the two yield curves for the 5-10y part should converge to zero. As captured in Figure 2, the rates converged towards the same value in 1998, where the spread between the two rates converged to zero.

Figure 2. Payoff of the fixed-income arbitrage strategy.
Payoff of the fixed-income arbitrage strategy.
Source: Motson (2022) (Data: Bloomberg).

Performance of the fixed-income arbitrage strategy

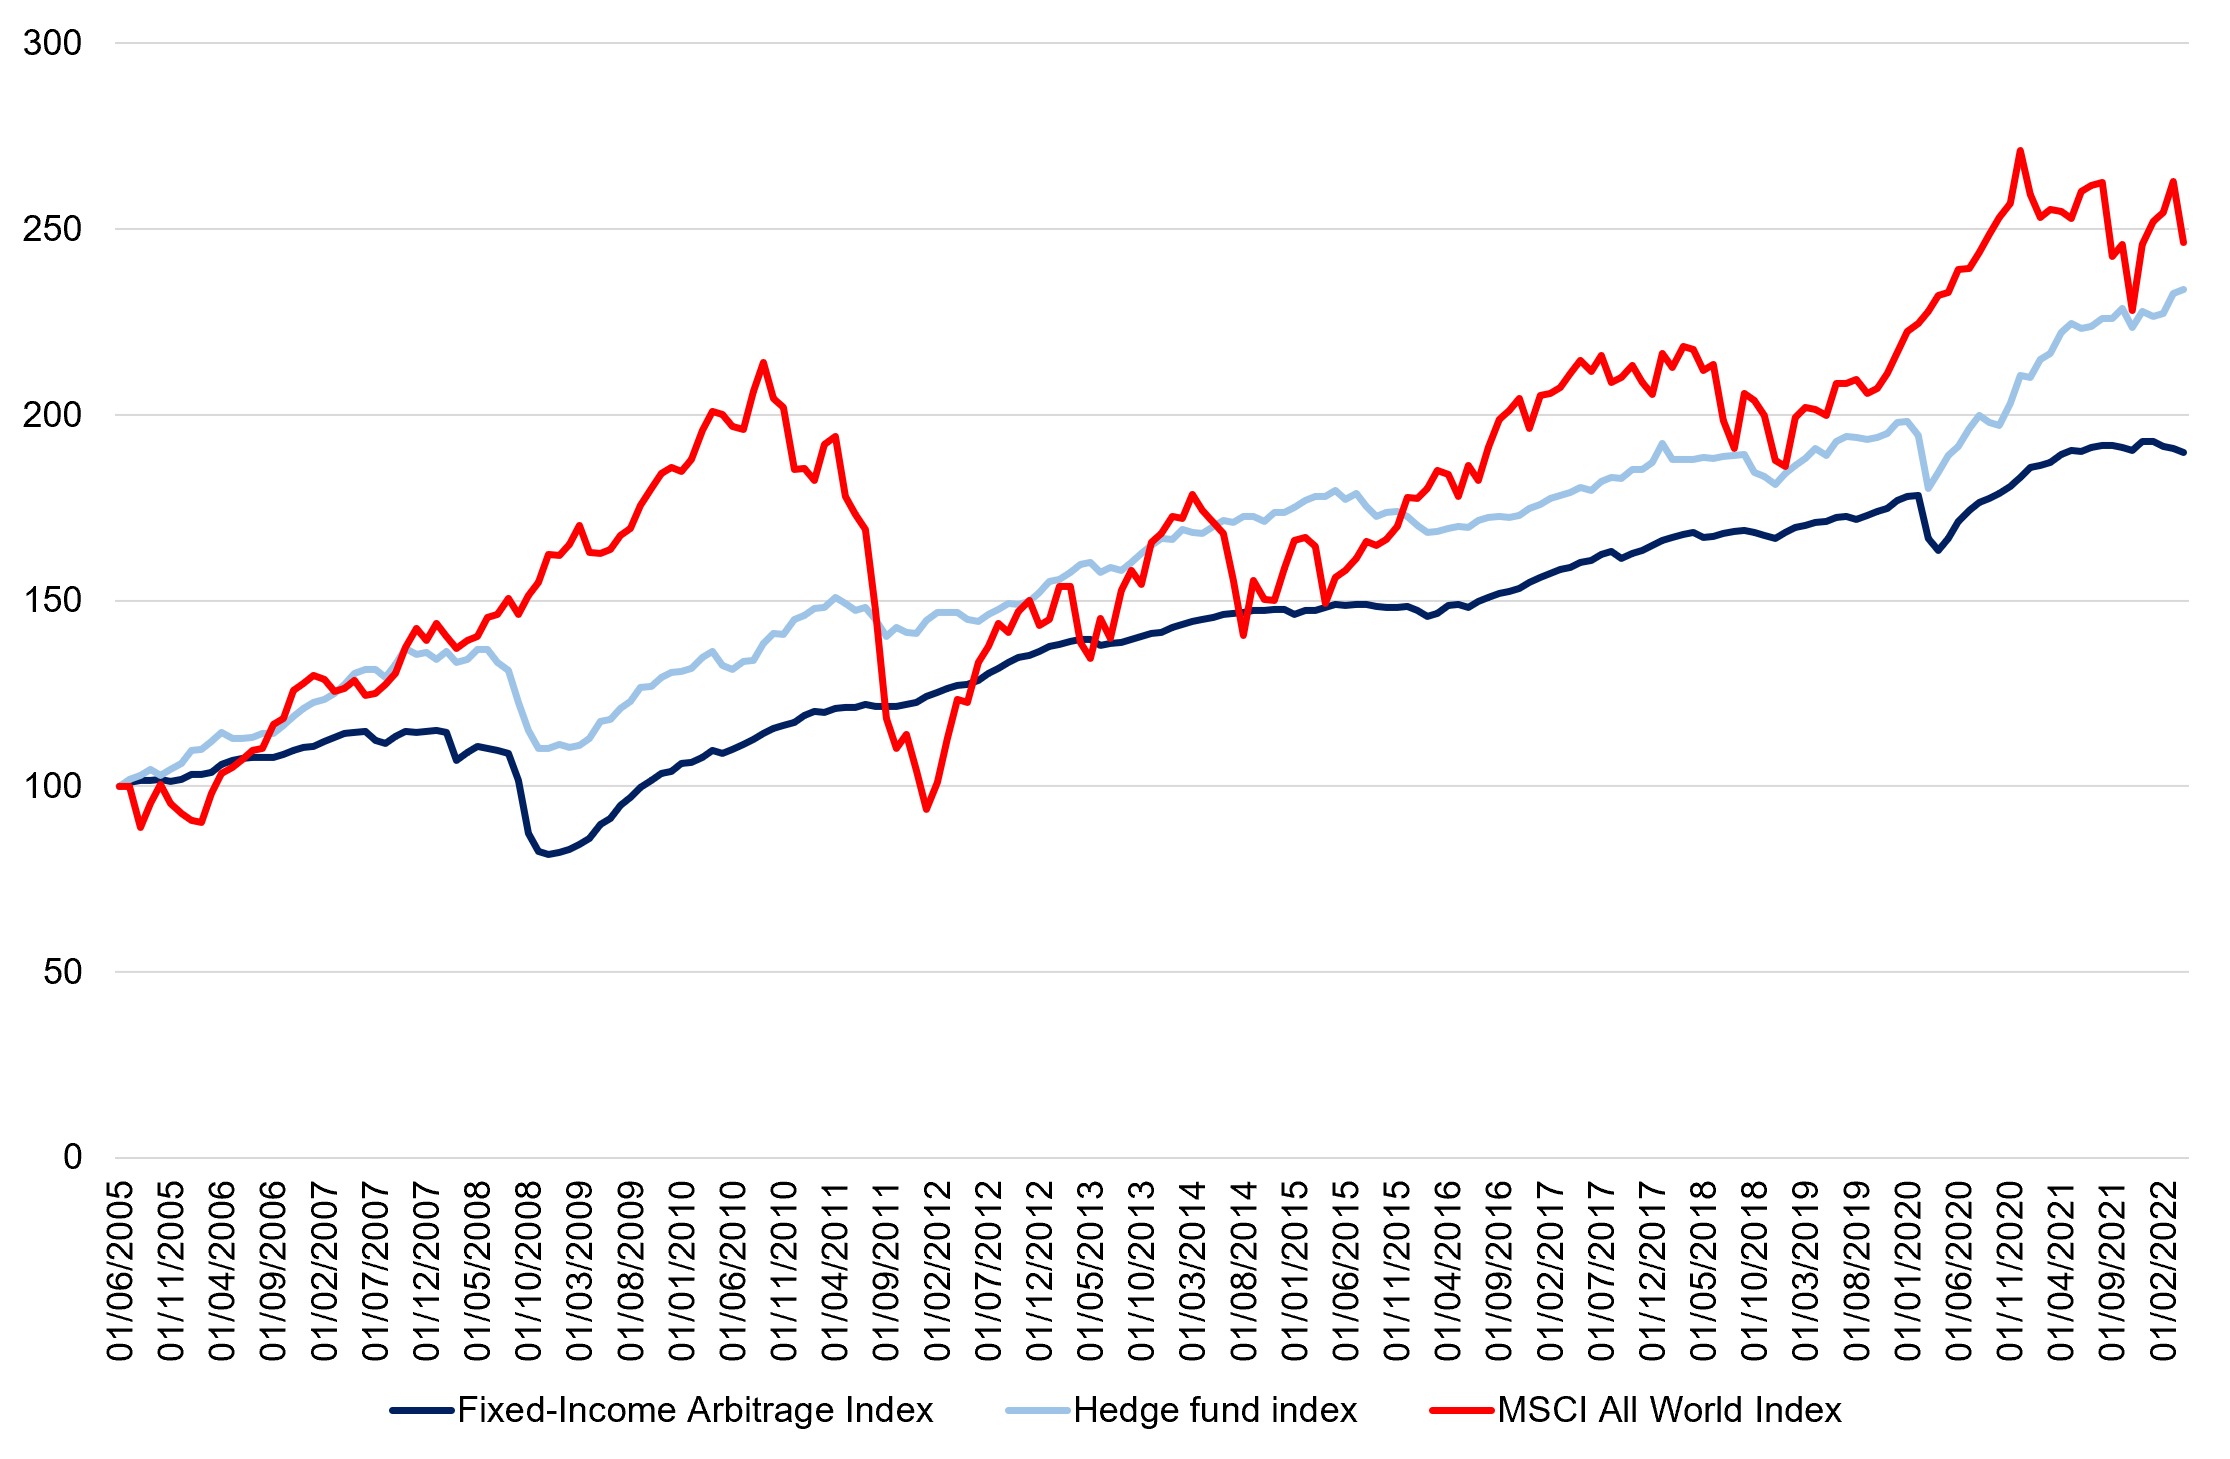
Overall, the performance of the fixed-income arbitrage between 1994-2020 were smaller on scale, with occasional large drawdowns (Asian crisis 1998, Great Financial Crisis of 2008, Covid-19 pandemic 2020). This strategy is skewed towards small positive returns but with important tail-risk (heavy losses) according to Credit Suisse (2022). To capture the performance of the fixed-income arbitrage strategy, we use the Credit Suisse hedge fund strategy index. To establish a comparison between the performance of the global equity market and the fixed-income arbitrage strategy, we examine the rebased performance of the Credit Suisse index with respect to the MSCI All-World Index.

Over a period from 2002 to 2022, the fixed-income arbitrage strategy index managed to generate an annualized return of 3.81% with an annualized volatility of 5.84%, leading to a Sharpe ratio of 0.129. Over the same period, the Credit Suisse Hedge Fund index Index managed to generate an annualized return of 5.04% with an annualized volatility of 5.64%, leading to a Sharpe ratio of 0.197. The results are in line with the idea of global diversification and decorrelation of returns derived from the global macro strategy from global equity returns. Overall, the Credit Suisse fixed-income arbitrage strategy index performed better than the MSCI All World Index, leading to a higher Sharpe ratio (0.129 vs 0.08).

Figure 3 gives the performance of the fixed-income arbitrage funds (Credit Suisse Fixed-income Arbitrage Index) compared to the hedge funds (Credit Suisse Hedge Fund index) and the world equity funds (MSCI All-World Index) for the period from July 2002 to April 2021.

Figure 3. Performance of the fixed-income arbitrage strategy.
 Global macro performance
Source: computation by the author (Data: Bloomberg).

You can find below the Excel spreadsheet that complements the explanations about the fixed-income arbitrage strategy.

Fixed-income arbitrage

Why should I be interested in this post?

The fixed-income arbitrage strategy aims to profit from market dislocations in the fixed-income market. This can be implemented, for instance, by investing in inexpensive fixed-income securities that the fund manager predicts that it will increase in value, while simultaneously shorting overvalued fixed-income securities to mitigate losses. Understanding the profits and risks associated with such a strategy may aid investors in adopting this hedge fund strategy into their portfolio allocation.

Related posts on the SimTrade blog

Hedge funds

   ▶ Youssef LOURAOUI Introduction to Hedge Funds

   ▶ Youssef LOURAOUI Global macro strategy

   ▶ Youssef LOURAOUI Long/short equity strategy

Financial techniques

   ▶ Youssef LOURAOUI Yield curve structure and interest rate calibration

   ▶ Akshit GUPTA Interest rate swaps

   ▶ Youssef LOURAOUI Portfolio

Useful resources

Academic research

Pedersen, L. H., 2015. Efficiently Inefficient: How Smart Money Invests and Market Prices Are Determined. Princeton University Press.

Motson, N. 2022. Hedge fund elective. Bayes (formerly Cass) Business School.

Business Analysis

Credit Suisse Hedge fund strategy

Credit Suisse Hedge fund performance

Credit Suisse Fixed-income arbitrage strategy

Credit Suisse Fixed-income arbitrage performance benchmark

About the author

The article was written in January 2023 by Youssef LOURAOUI (Bayes Business School, MSc. Energy, Trade & Finance, 2021-2022).

Global macro strategy

Youssef LOURAOUI

In this article, Youssef LOURAOUI (Bayes Business School, MSc. Energy, Trade & Finance, 2021-2022) presents the global macro equity strategy, one of the most widely known strategies in the hedge fund industry. The goal of the global macro strategy is to look for trends or disequilibrium in equity, bonds, currency or alternative assets based on broad economic data using a top-down approach.

This article is structured as follow: we introduce the global macro strategy principle. Then, we present a famous case study to grasp the overall methodology of this strategy. We conclude with a performance analysis of this strategy in comparison with a global benchmark (MSCI All World Index and the Credit Suisse Hedge Fund index).

Introduction

According to Credit Suisse, a global macro strategy can be defined as follows: “Global Macro funds focus on identifying extreme price valuations and leverage is often applied on the anticipated price movements in equity, currency, interest rate and commodity markets. Managers typically employ a top-down global approach to concentrate on forecasting how political trends and global macroeconomic events affect the valuation of financial instruments. Profits are made by correctly anticipating price movements in global markets and having the flexibility to use a broad investment mandate, with the ability to hold positions in practically any market with any instrument. These approaches may be systematic trend following models, or discretionary.”

This strategy can generate returns in both rising and falling markets. However, asset screening is of key concern, and the ability of the fund manager to capture the global macro picture that is driving all asset classes is what makes this strategy profitable (or not!).

The greatest trade in history

The greatest trade in history (before Michael Burry becomes famous for anticipating the Global financial crisis of 2008 linked to the US housing market) took place during the 1990’s when the UK was intending to join the Exchange Rate Mechanism (ERM) founded in 1979. This foreign exchange (FX) system involved eight countries with the intention to move towards a single currency (the Euro). The currencies of the countries involved would be adjustably pegged with a determined band in which they can fluctuate with respect to the Deutsche Mark (DEM), the currency of Germany considered as the reference of the ERM.

Later in 1992, the pace at which the countries adhering to the ERM mechanism were evolving at different rate of growth. The German government was in an intensive spending following the reunification of Berlin, with important stimulus from the German Central Bank to print more money. However, the German government was very keen on controlling inflation to satisfactory level, which was achieved by increasing interest rates in order to curb the inflationary pressure in the German economy.

In the United Kingdom (UK), another macroeconomic picture was taking place: there was a high unemployment coupled with already relatively high interest rates compared to other European economies. The Bank of England was put in a very tight spot because they were facing two main market scenarios:

  • To increase interest rates, which would worsen the economy and drive the UK into a recession
  • To devalue the British Pound (GBP) by defending actively in the FX market, which would cause the UK to leave the ERM mechanism.

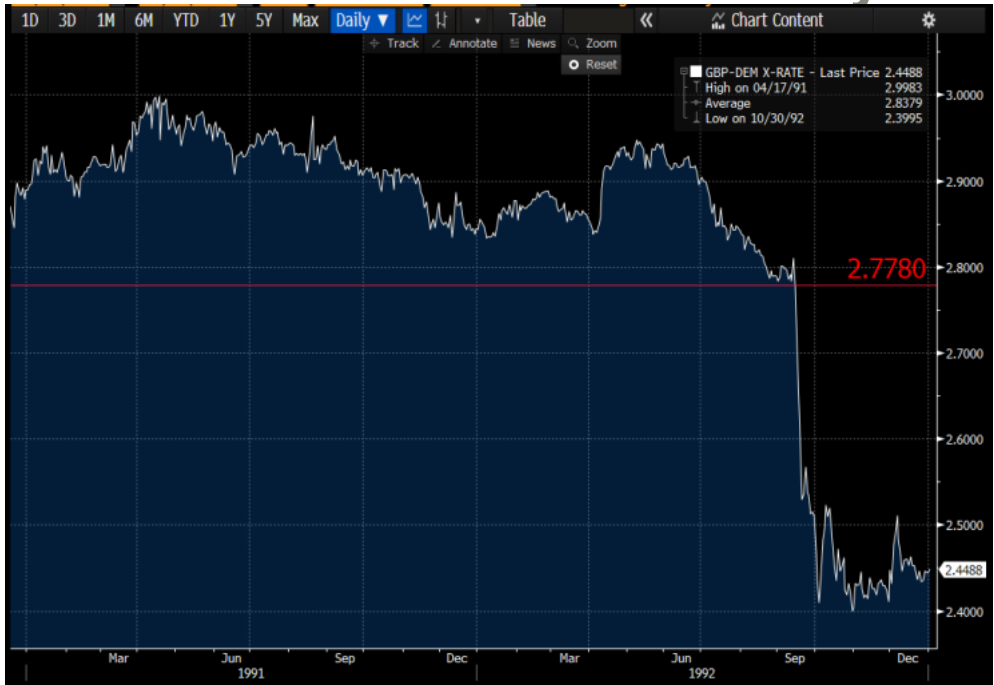
The Bank of England decided to go with the second option by defending the British Pound in the FX market by actively buying pounds. However, this strategy would not be sustainable over time. Soros (and other investors) had seen this disequilibrium and shorted British Pound and bought Deutsche Mark. The situation got completely off control for the Bank of England that in September 1992, they decided to increase interest rates, which were already at 10% to more than 15% to calm the selling pressure. Eventually, the following day, the Bank of England announced the exit of the UK from the ERM mechanism and put a hold on the increase of interest rate to the 12% until the economic conditions get better. Figure 1 gives the evolution of the exchange rate between the British Pound (GBP) and the Deutsche Mark (DEM) over the period 1991-1992.

Figure 1. Evolution of the GBP-DEM (British Pound / Deutsche Mark FX rate).
 Global macro performance
Source: Bloomberg.

It was reported that Soros amassed a position of $10 billion and gained a whopping $1 billion for this trade. This event put Soros in the scene as the “man who broke the Bank of England”. The good note about this market event is that the UK economy emerged much healthier than the European countries, with UK exports becoming much more competitive as a result of the pound devaluation, which led the Bank of England to cut rates cut down to the 5-6% level the years following the event, which ultimately helped the UK economy to get better.

Performance of the global macro strategy

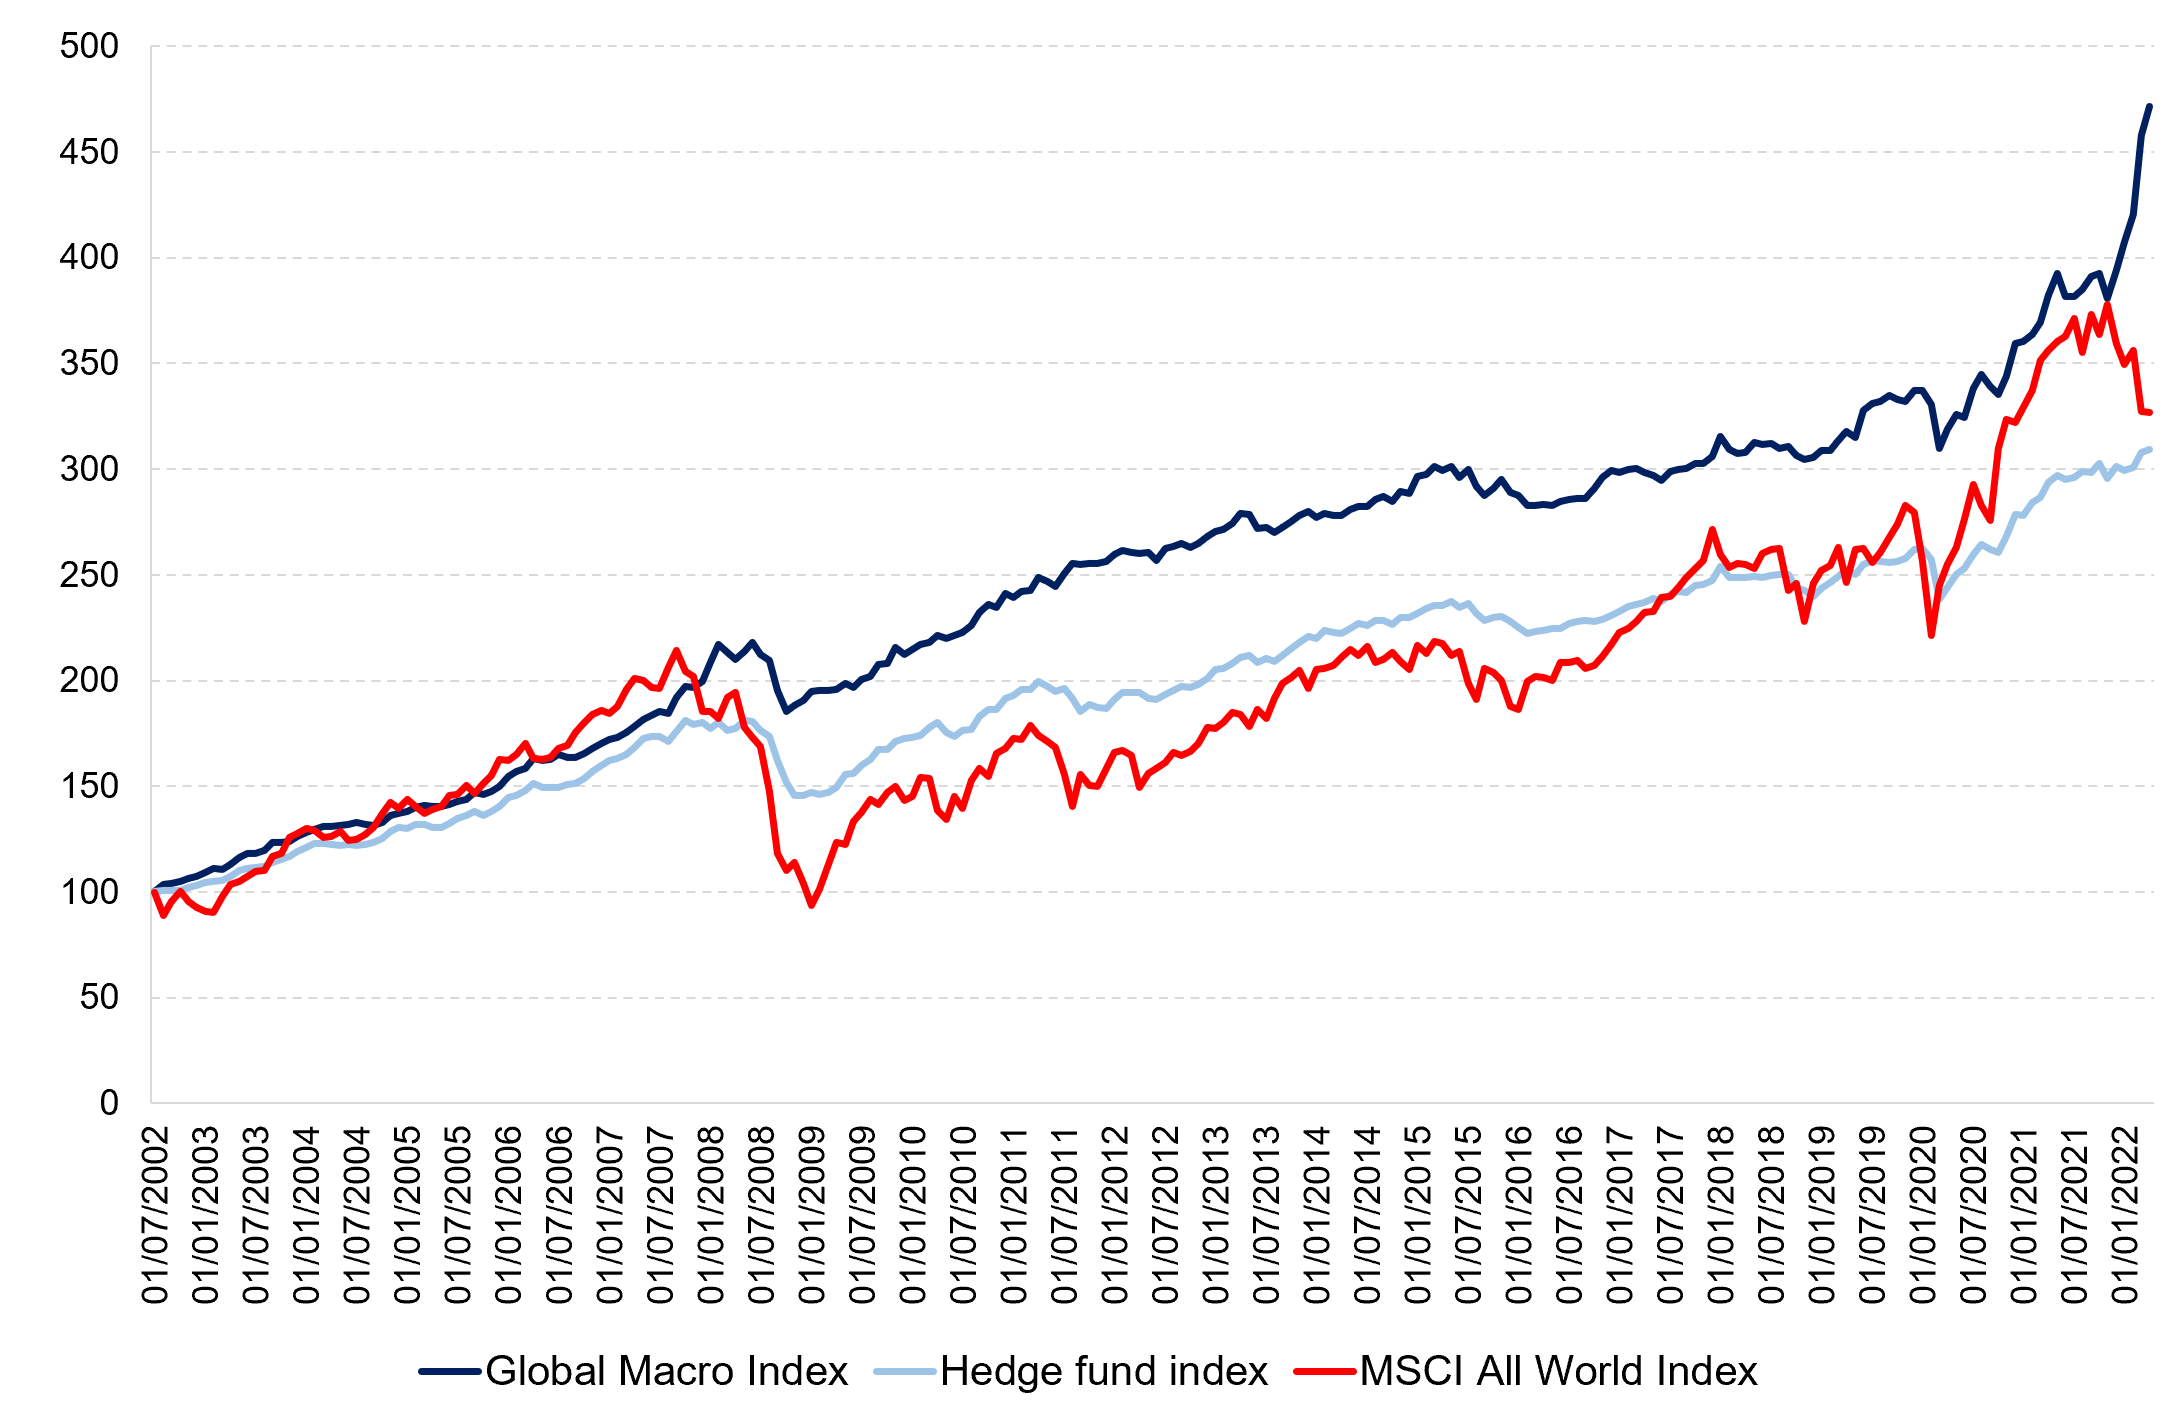
Overall, the performance of the global macro funds between 1994-2020 was steady, with occasional large drawdowns (Asian crisis 1998, Dot-com bubble 2000’s, Great Financial Crisis of 2008, Covid-19 pandemic 2020). On a side note, the returns seem smaller and less volatile since 2000 onwards (Credit Suisse, 2022).

To capture the performance of the global macro strategy, we use the Credit Suisse hedge fund strategy index. To establish a comparison between the performance of the global equity market and the global macro hedge fund strategy, we examine the rebased performance of the Credit Suisse index with respect to the MSCI All-World Index. Over a period from 2002 to 2022, the global macro strategy index managed to generate an annualized return of 7.85% with an annualized volatility of 5.77%, leading to a Sharpe ratio of 0.33. Over the same period, the MSCI All World Index managed to generate an annualized return of 6.00% with an annualized volatility of 15.71%, leading to a Sharpe ratio of 0.08. The low correlation of the long-short equity strategy with the MSCI All World Index is equal to -0.02, which is close to zero. The results are in line with the idea of global diversification and decorrelation of returns derived from the global macro strategy from global equity returns. Overall, the Credit Suisse hedge fund strategy index performed better worse than the MSCI All World Index, leading to a higher Sharpe ratio (0.33 vs 0.08).

Figure 2 gives the performance of the global macro funds (Credit Suisse Global Macro Index) compared to the hedge funds (Credit Suisse Hedge Fund index) and the world equity funds (MSCI All-World Index) for the period from July 2002 to April 2021.

Figure 2. Performance of the global macro strategy.
Performance of the global macro strategy
Source: computation by the author (data: Bloomberg).

You can find below the Excel spreadsheet that complements the explanations about the global macro hedge fund strategy.

Global Macro

Why should I be interested in this post?

Global macro funds seek to profit from market dislocations across different asset classes. reduce negative risk while increasing market upside. They might, for example, invest in inexpensive assets that the fund managers believe will rise in price while simultaneously shorting overvalued assets to cut losses. Other strategies used by global macro funds to lessen market volatility can include leverage and derivatives. Understanding the profits and risks of such a strategy might assist investors in incorporating this hedge fund strategy into their portfolio allocation.

Related posts on the SimTrade blog

   ▶ Youssef LOURAOUI Introduction to Hedge Funds

   ▶ Akshit GUPTA Portrait of George Soros: a famous investor

   ▶ Youssef LOURAOUI Yield curve structure and interest rate calibration

   ▶ Youssef LOURAOUI Long/short equity strategy

   ▶ Youssef LOURAOUI Portfolio

Useful resources

Academic research

Pedersen, L. H., 2015. Efficiently Inefficient: How Smart Money Invests and Market Prices Are Determined. Princeton University Press.

Business Analysis

Credit Suisse Hedge fund strategy

Credit Suisse Hedge fund performance

Credit Suisse Global macro strategy

Credit Suisse Global macro performance benchmark

About the author

The article was written in January 2023 by Youssef LOURAOUI (Bayes Business School, MSc. Energy, Trade & Finance, 2021-2022).