In this article, Snehasish CHINARA (ESSEC Business School, Grande Ecole Program – Master in Management, 2022-2024) explains the cryptocurrency XRP/Ripple.
Historical context and background
XRP, the digital currency associated with the Ripple network, emerged against the backdrop of a growing interest in blockchain technology and its potential applications beyond cryptocurrencies. The development of Ripple began in 2012 when Jed McCaleb, Chris Larsen, and Arthur Britto joined forces to create a decentralized digital currency system. Ripple Labs, the company behind XRP, aimed to address the inefficiencies in traditional cross-border payments by providing a fast and cost-effective alternative. Unlike Bitcoin, which relies on a proof-of-work consensus mechanism, Ripple utilizes a unique consensus algorithm called the Ripple Protocol Consensus Algorithm (RPCA). The XRP Ledger, the underlying technology, is designed to facilitate quick and secure transactions, making it particularly appealing for financial institutions. Over the years, Ripple has garnered both support and criticism within the crypto community due to its centralized nature and ongoing legal challenges. Nevertheless, its focus on facilitating seamless global transactions has positioned XRP as a significant player in the evolving landscape of digital assets.
XRP Logo
Source: Yahoo! Finance
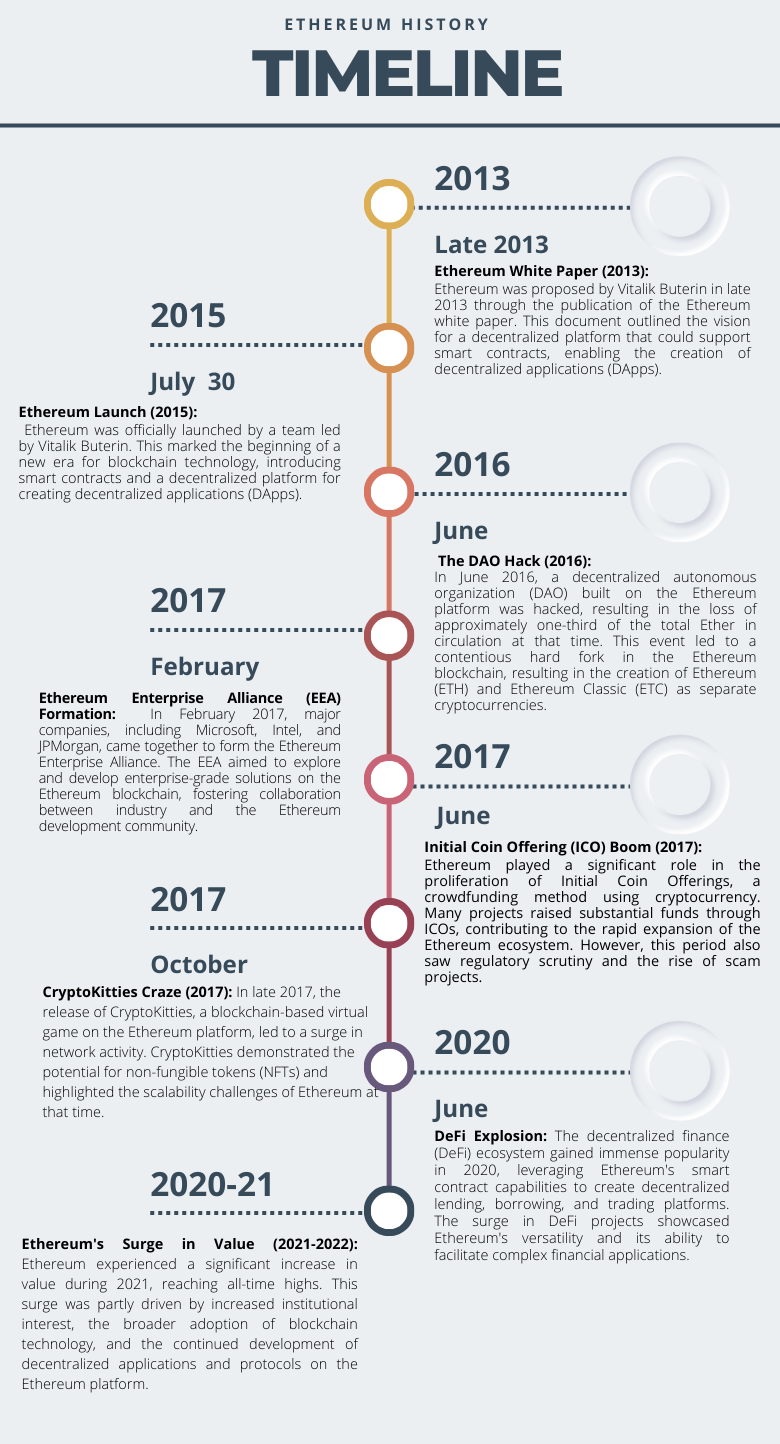
Figure 1. Key Dates in XRP History
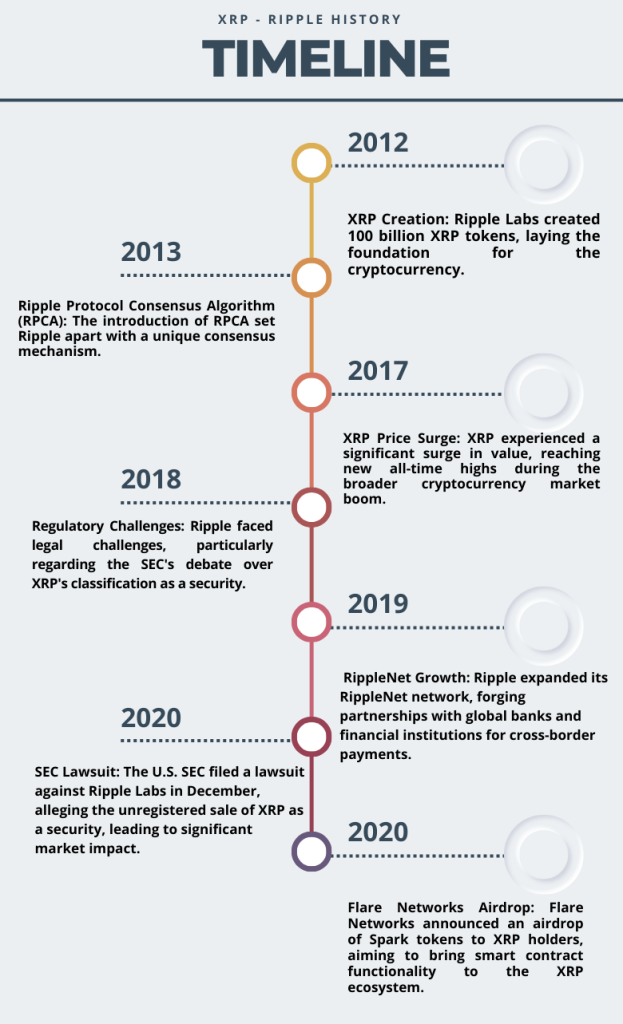
Source: Yahoo! Finance and other internet sources
Key features and use cases
- Fast and Low-Cost Transactions: One of the primary features of XRP is its speed and cost-effectiveness. The XRP Ledger is capable of processing transactions in just a few seconds, making it significantly faster than traditional banking systems and some other cryptocurrencies. The low transaction fees associated with XRP contribute to its appeal for cross-border payments.
- Liquidity and Scalability: XRP is designed to handle a high volume of transactions, providing liquidity for financial institutions. This scalability is crucial for the adoption of XRP in large-scale financial applications, including remittances and institutional transfers.
- Interoperability: Ripple aims to facilitate interoperability between different financial systems. XRP can act as a bridge currency between fiat currencies, enabling seamless and efficient transactions across borders. This interoperability is particularly valuable in the context of global finance.
- Decentralization with Unique Consensus Algorithm: While Ripple has faced criticism for some aspects of centralization, the XRP Ledger employs the Ripple Protocol Consensus Algorithm (RPCA) for transaction validation. This consensus mechanism is more energy-efficient compared to proof-of-work used by some other cryptocurrencies.
- Partnerships with Financial Institutions: Ripple has formed partnerships with various financial institutions, including banks and payment service providers. The aim is to leverage XRP for real-time, cross-border payments, reducing settlement times and costs for these institutions.
- Smart Contracts and Tokenization: Ripple has also explored adding smart contract functionality to the XRP Ledger, expanding its use cases beyond simple transactions. Additionally, the platform has the potential for tokenization of real-world assets, allowing for the representation of various assets on the blockchain.
- Stability and Predictable Supply: XRP has a fixed supply of 100 billion tokens, with a portion held by Ripple Labs. This fixed supply aims to provide stability and predictability, which could be attractive for businesses and investors.
While XRP has faced regulatory challenges and debates about its decentralization, its unique features and focus on solving real-world financial issues position it as a cryptocurrency with substantial potential in the global financial landscape.
Technology and underlying blockchain
XRP, the cryptocurrency associated with the Ripple network, operates on a distinct technological framework, utilizing a consensus algorithm that sets it apart from traditional proof-of-work systems. At the heart of XRP’s technology is the XRP Ledger, a decentralized blockchain that enables fast and secure transactions. The unique consensus mechanism employed by Ripple is known as the Ripple Protocol Consensus Algorithm (RPCA). Unlike the energy-intensive mining processes seen in proof-of-work systems, RPCA operates on a consensus model that involves a network of independent validators reaching agreement on the order and validity of transactions. This consensus mechanism allows the XRP Ledger to achieve high throughput and swift confirmation times, making it well-suited for the efficient processing of cross-border payments and financial transactions. Additionally, the XRP Ledger supports the issuance of various tokens, potentially expanding its use cases beyond its native cryptocurrency. Despite debates about the decentralization of Ripple, the technology behind XRP continues to evolve, showcasing a commitment to addressing the challenges and opportunities in the rapidly evolving blockchain and cryptocurrency space. Additionally, the platform has explored the integration of smart contract functionality, opening possibilities for more complex and programmable transactions. The focus on scalability, interoperability, and speed positions XRP as a blockchain solution tailored for the demands of the global financial industry, particularly in the context of cross-border payments and remittances.
Supply of coins
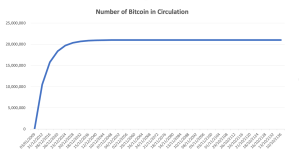
The supply dynamics of XRP, the native cryptocurrency of the Ripple network, play a crucial role in shaping its market characteristics. Unlike Bitcoin, which relies on a mining process to gradually release new coins into circulation, XRP was created with its entire supply generated at inception. XRP has a fixed maximum supply of 100 billion coins, a feature that distinguishes it from some other cryptocurrencies with potentially infinite supplies. Notably, a substantial portion of the XRP supply is held by Ripple Labs, the company behind the cryptocurrency. Approximately 55 billion XRP are held in escrow by Ripple Labs, the company behind the development of the Ripple protocol. This escrow mechanism is designed to release a specific amount of XRP into circulation each month, reducing the potential for market manipulation and ensuring a predictable supply trajectory.
This allocation has been a point of discussion and scrutiny within the crypto community, with debates surrounding the potential impact of such centralization on the coin’s decentralization ethos. Ripple has taken steps to address concerns, implementing strategies such as the escrow system, which locks a large amount of XRP in time-released contracts to be gradually released into circulation. The controlled release aims to provide transparency and mitigate concerns related to sudden market influxes. The fixed supply, along with Ripple’s strategic initiatives, contributes to the stability and predictability of XRP in the market, influencing investor perceptions and shaping the overall market dynamics of the cryptocurrency.
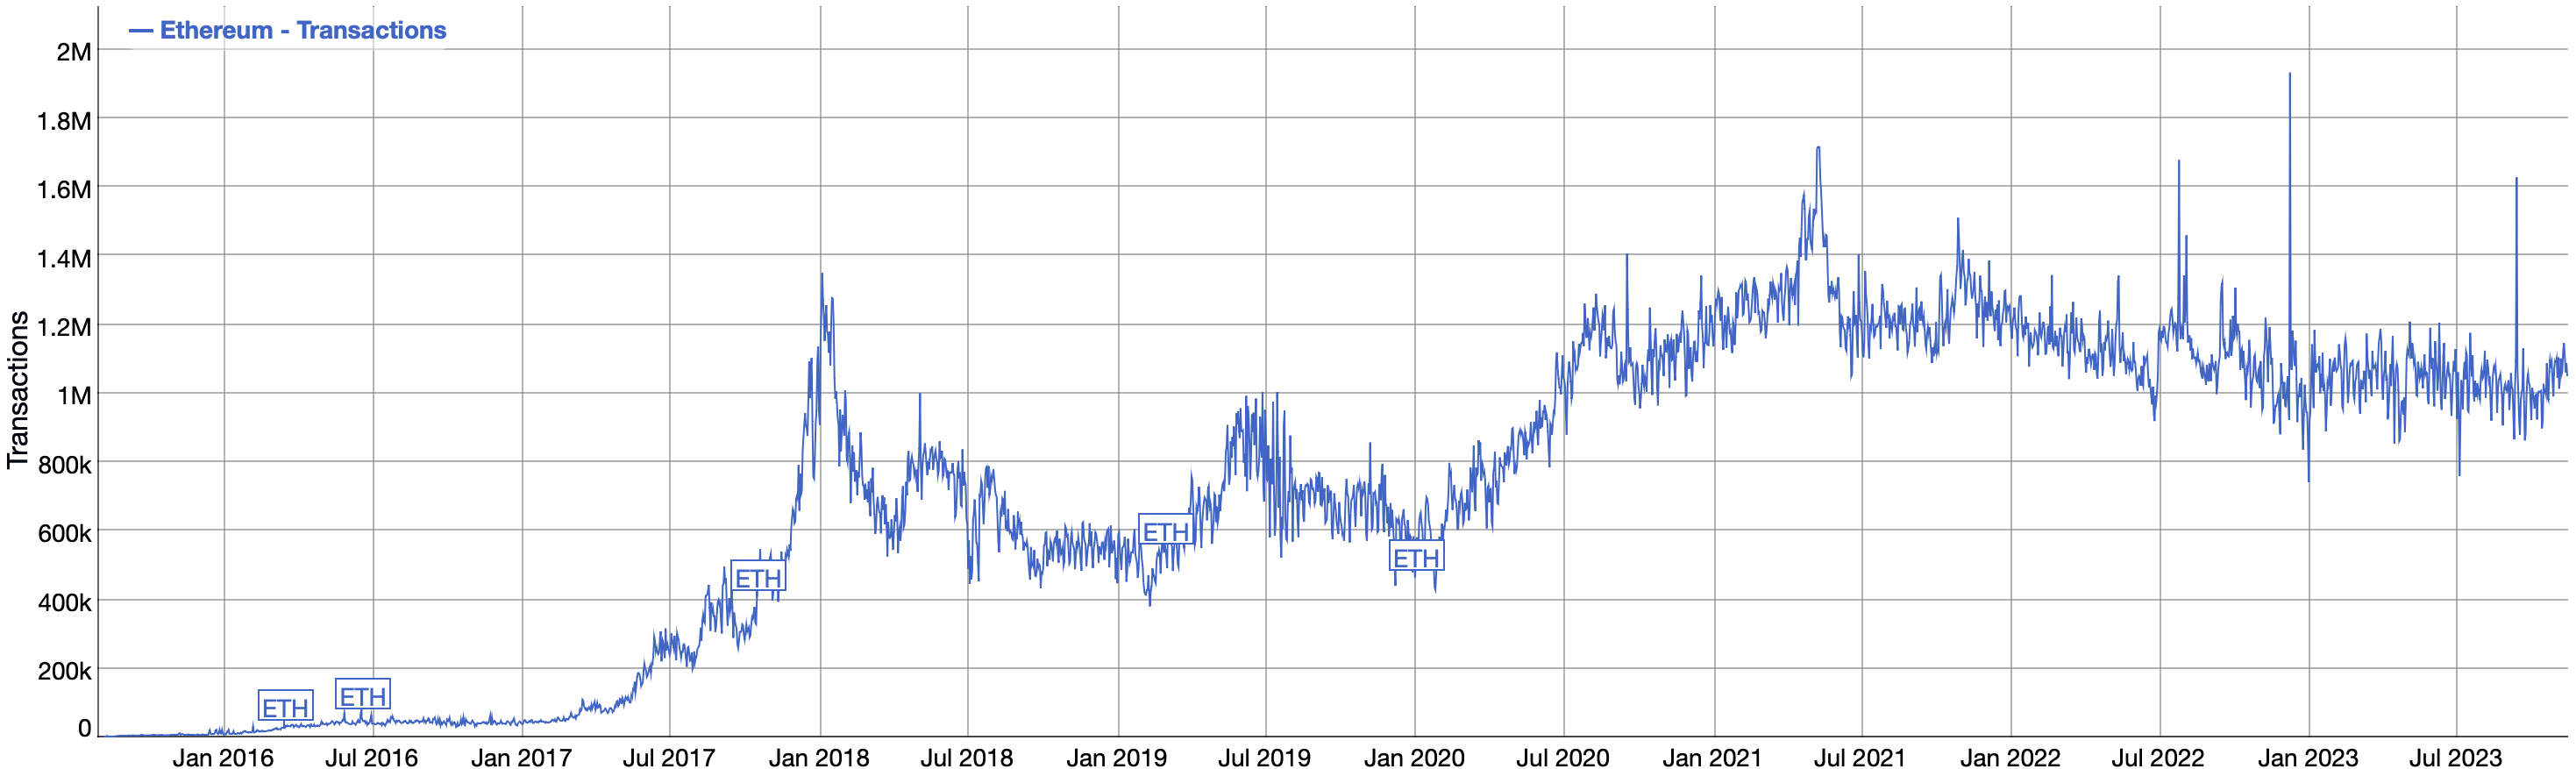
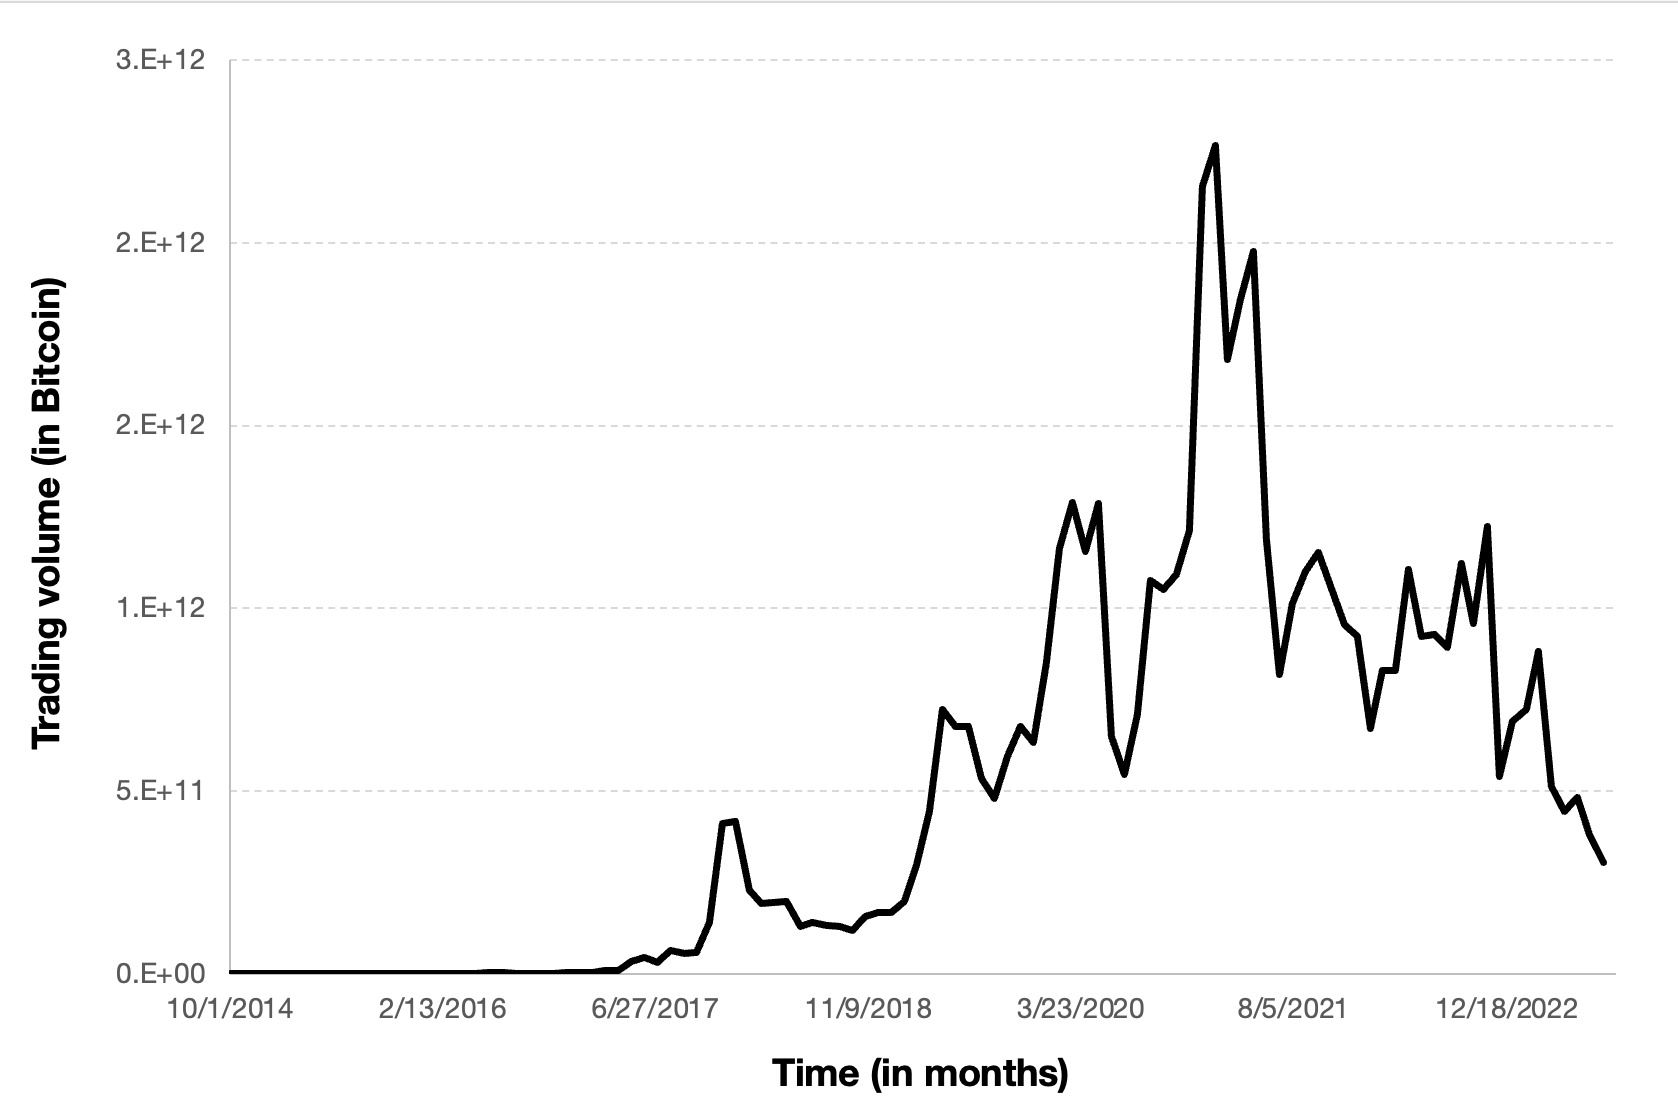
Figure 2. Number of XRP Transaction per Day
Source: BitInfoCharts (Ethereum Transactions historical chart)
Historical data for XRP
How to get the data?
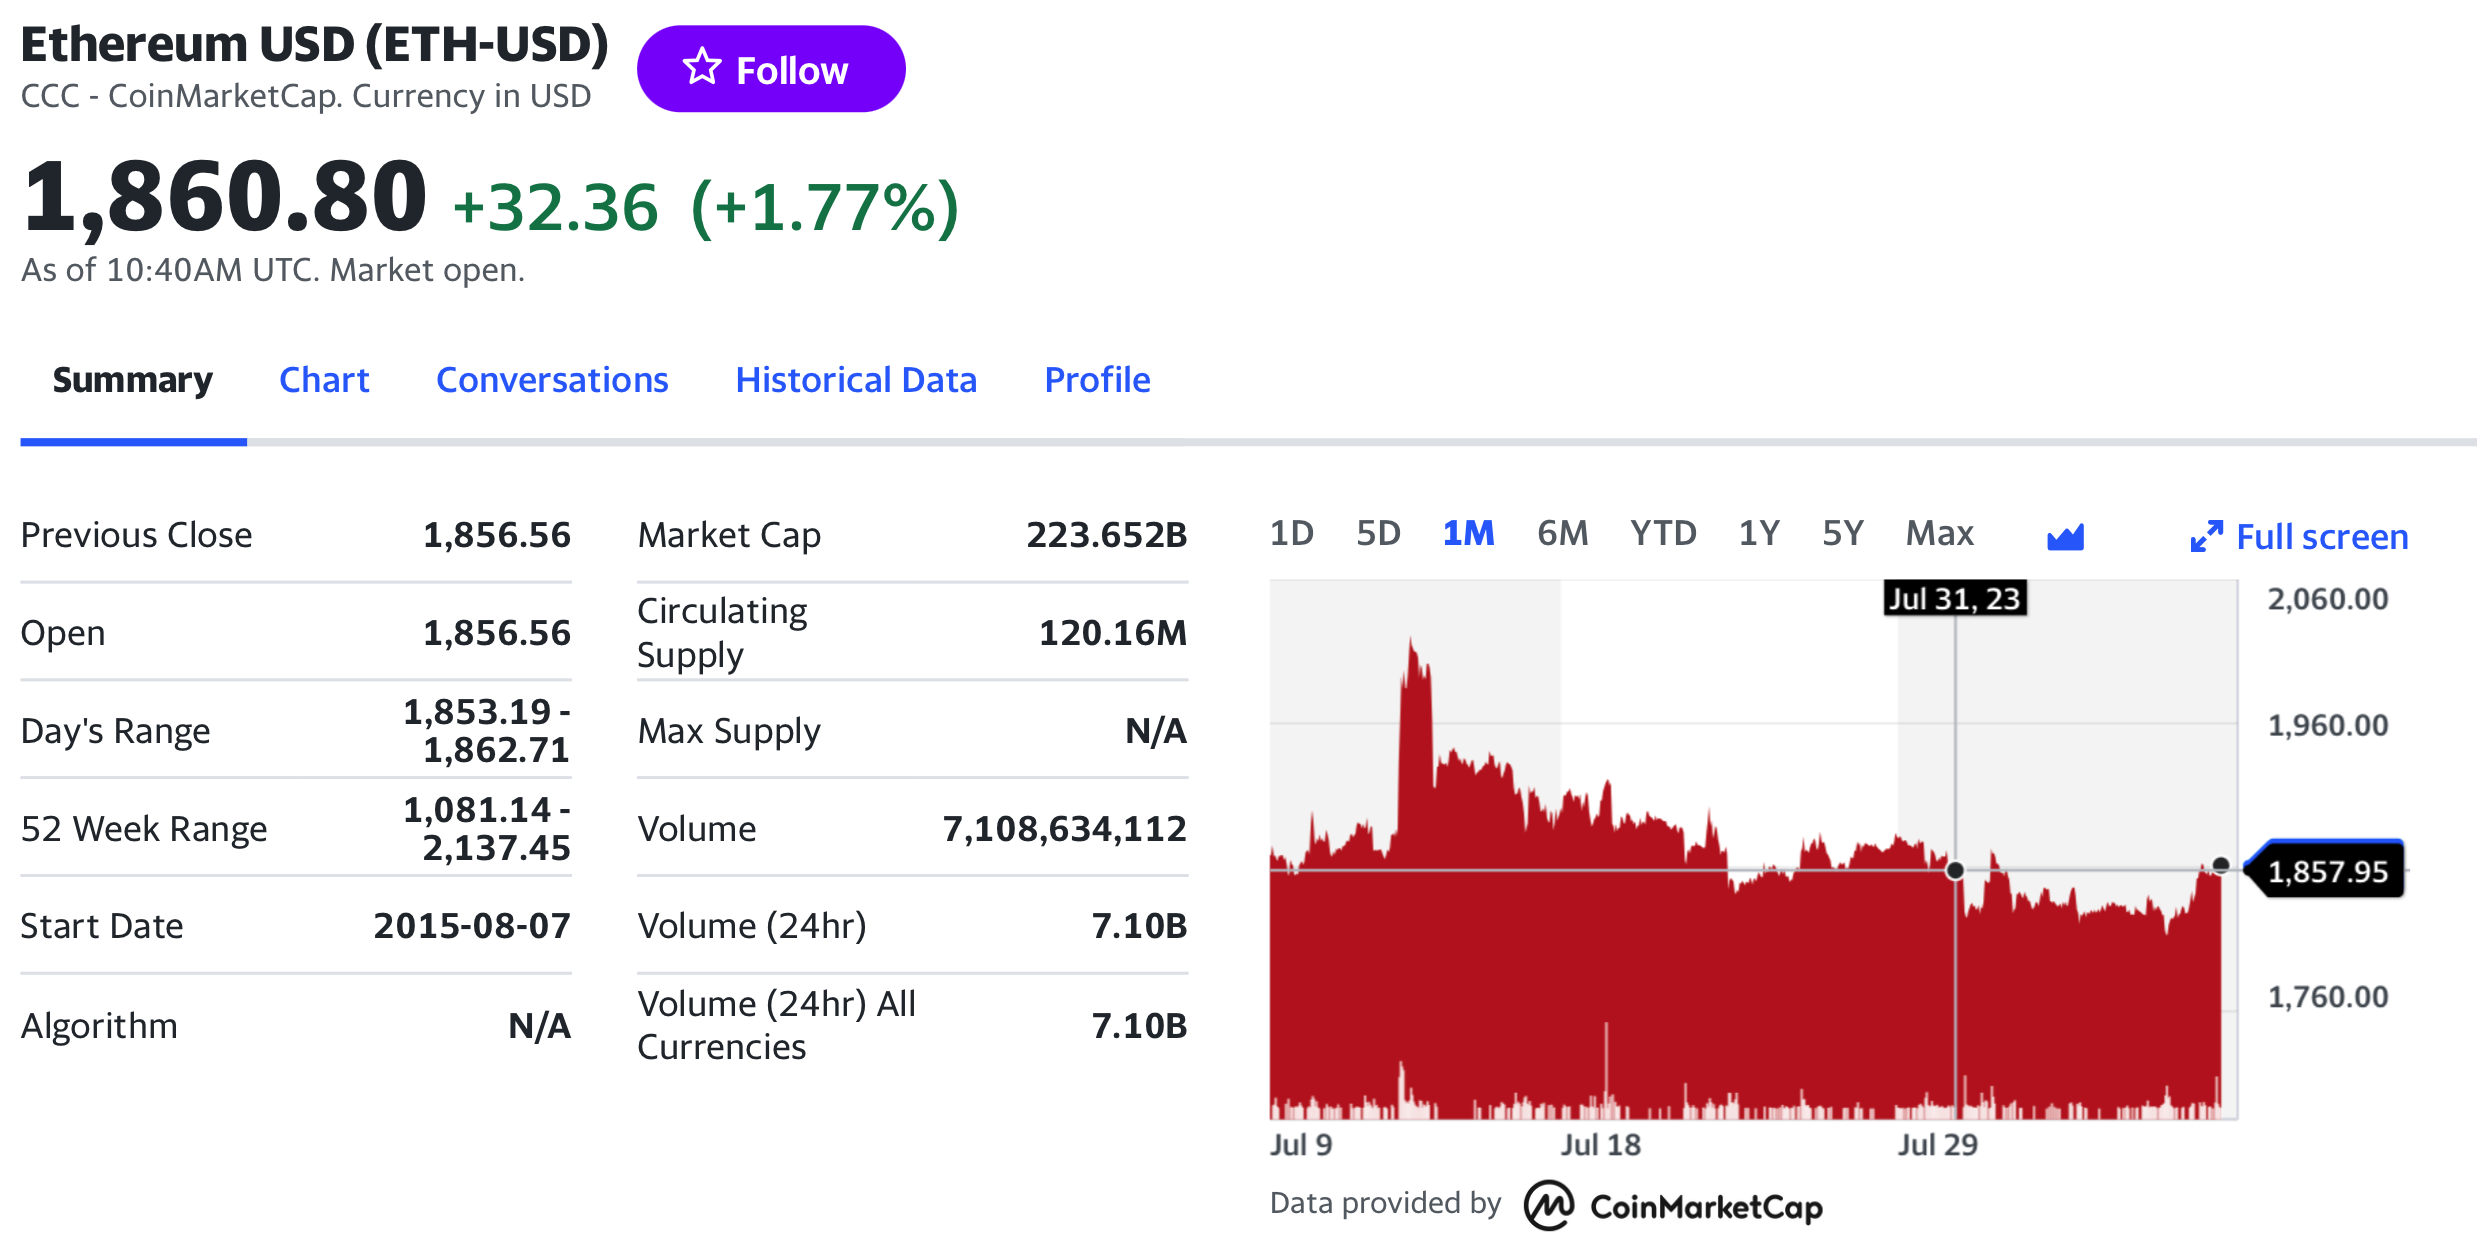
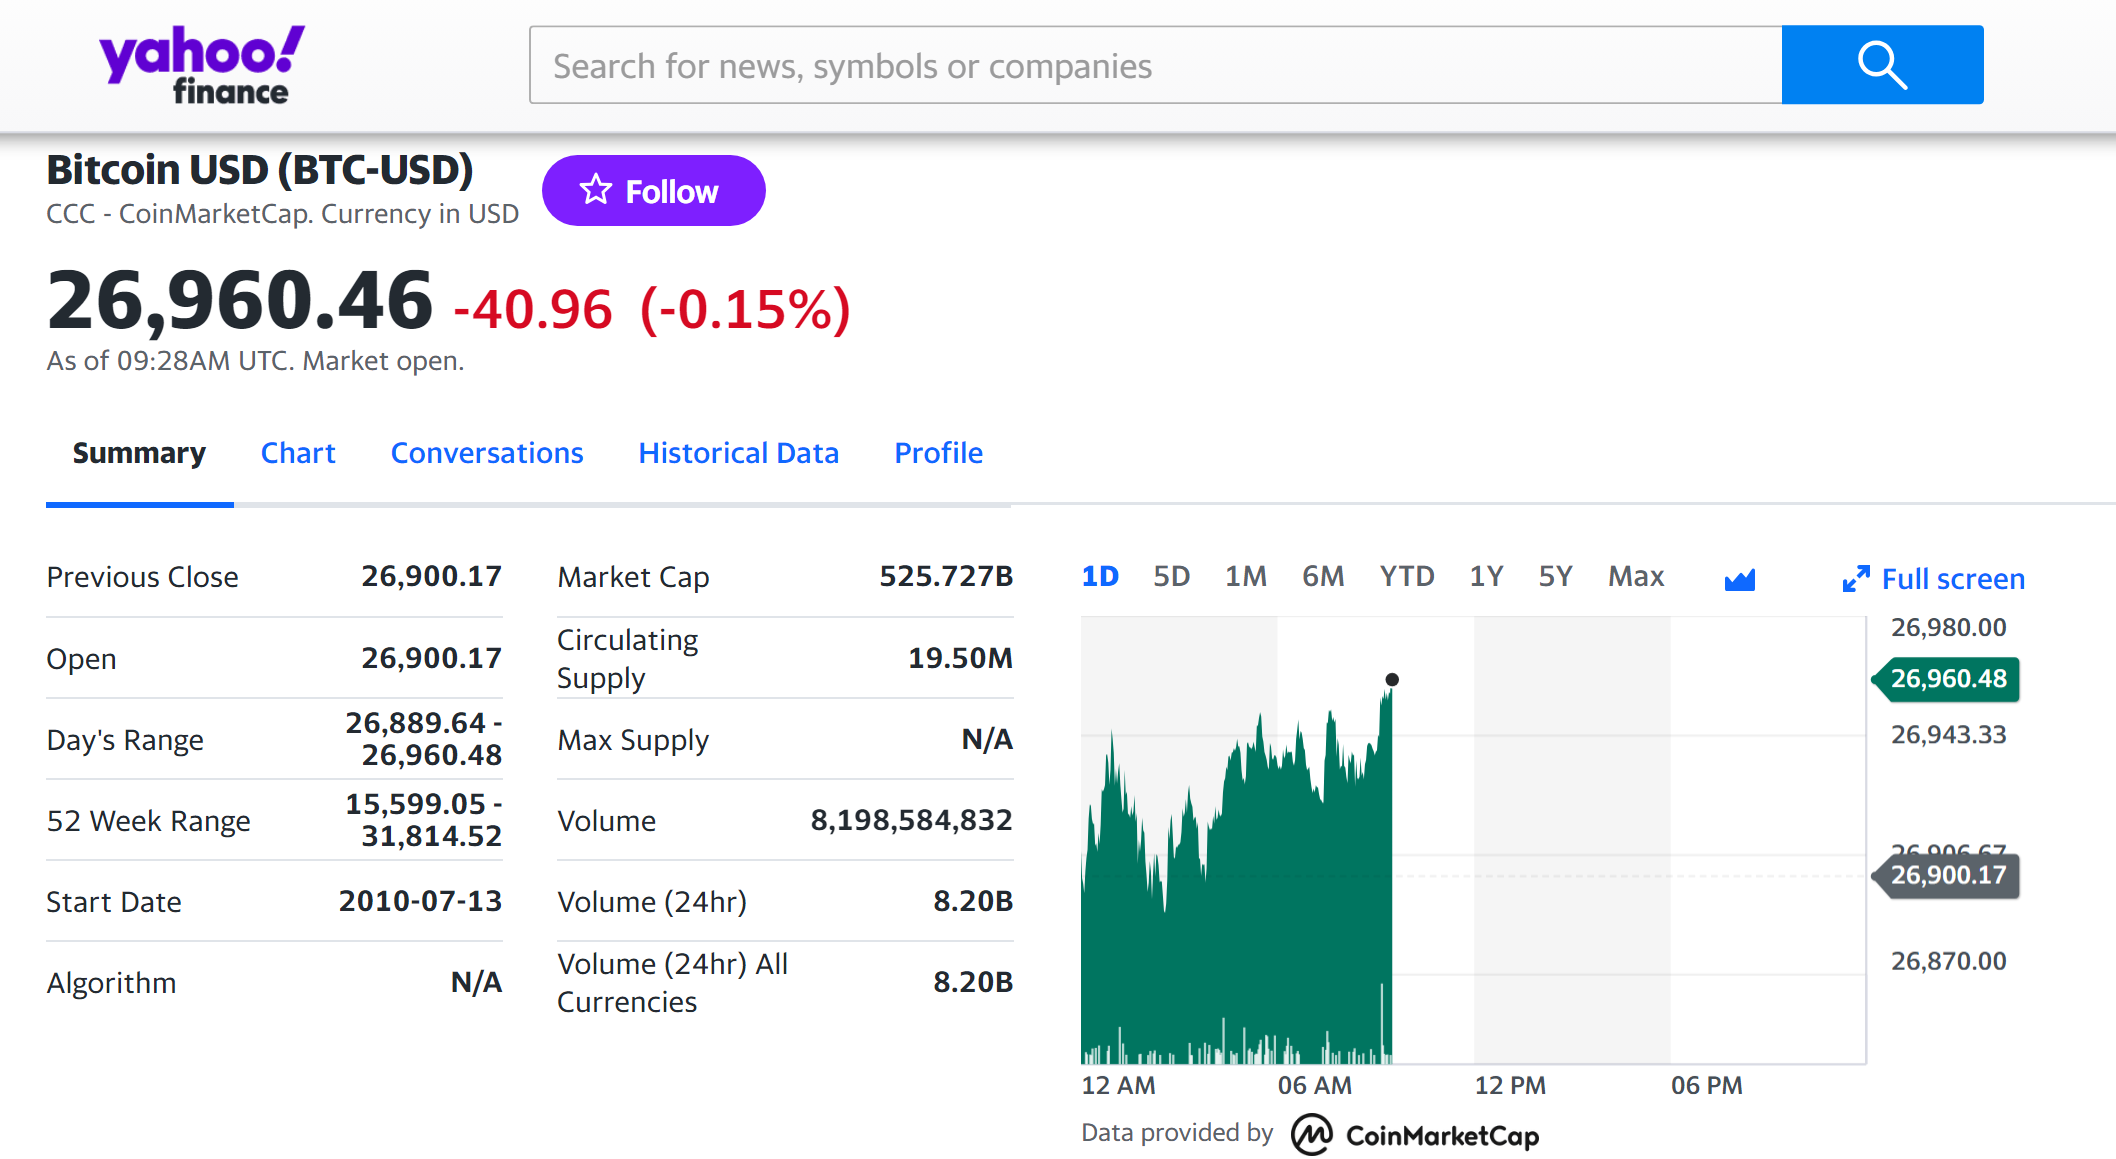
The XRP is popular cryptocurrency on the market, and historical data for the XRP such as prices and volume traded can be easily downloaded from the internet sources such as Yahoo! Finance, Blockchain.com & CoinMarketCap. For example, you can download data for XRP on Yahoo! Finance (the Yahoo! code for XRP is XRP-USD).
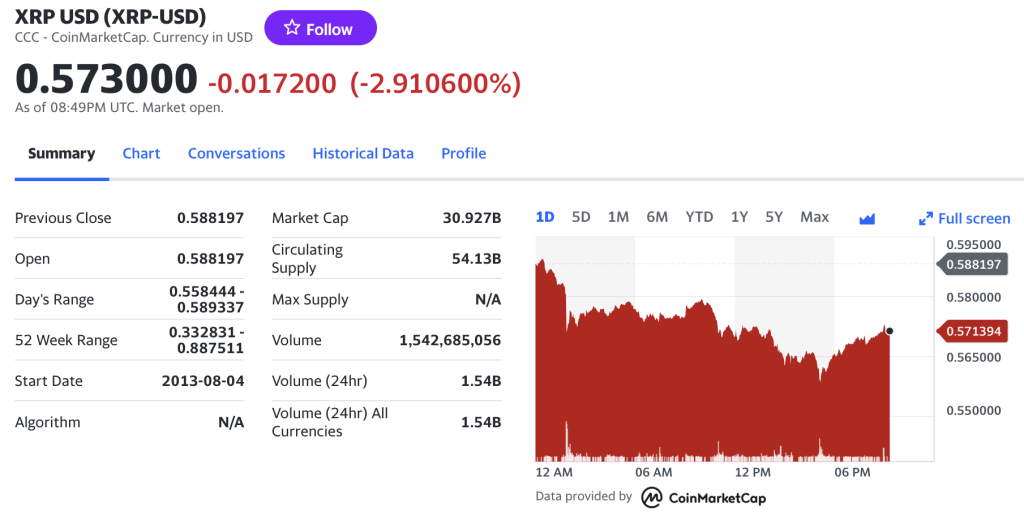
Figure 3. XRP data
Source: Yahoo! Finance
Historical data for the XRP market prices
Access to historical data on XRP, the cryptocurrency affiliated with Ripple, offers investors valuable insights and tools for decision-making. By analyzing past price trends and patterns, investors can better anticipate potential movements in XRP’s value, aiding in strategic buy or sell decisions. Historical data also serves as a record of XRP’s volatility, allowing investors to assess and manage risks effectively. Examining market sentiment during different periods provides a nuanced understanding of external factors that may impact XRP, such as regulatory developments or technological upgrades. Additionally, historical performance comparisons with other cryptocurrencies or traditional assets help investors evaluate XRP’s relative strength and potential for returns, informing optimal portfolio management. Event analysis around significant occurrences, such as partnerships or regulatory changes, assists in anticipating market reactions to future events. Furthermore, historical data aids in identifying market cycles, supporting investors in aligning their strategies with the prevailing market conditions. Recognizing key support and resistance levels based on historical prices enhances risk management by guiding entry and exit points. While historical data is a valuable tool, investors should blend it with current market analysis and fundamental factors for comprehensive decision-making, considering the inherent unpredictability of the cryptocurrency market.
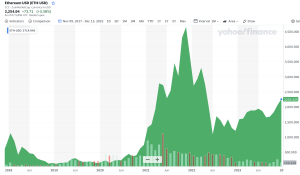
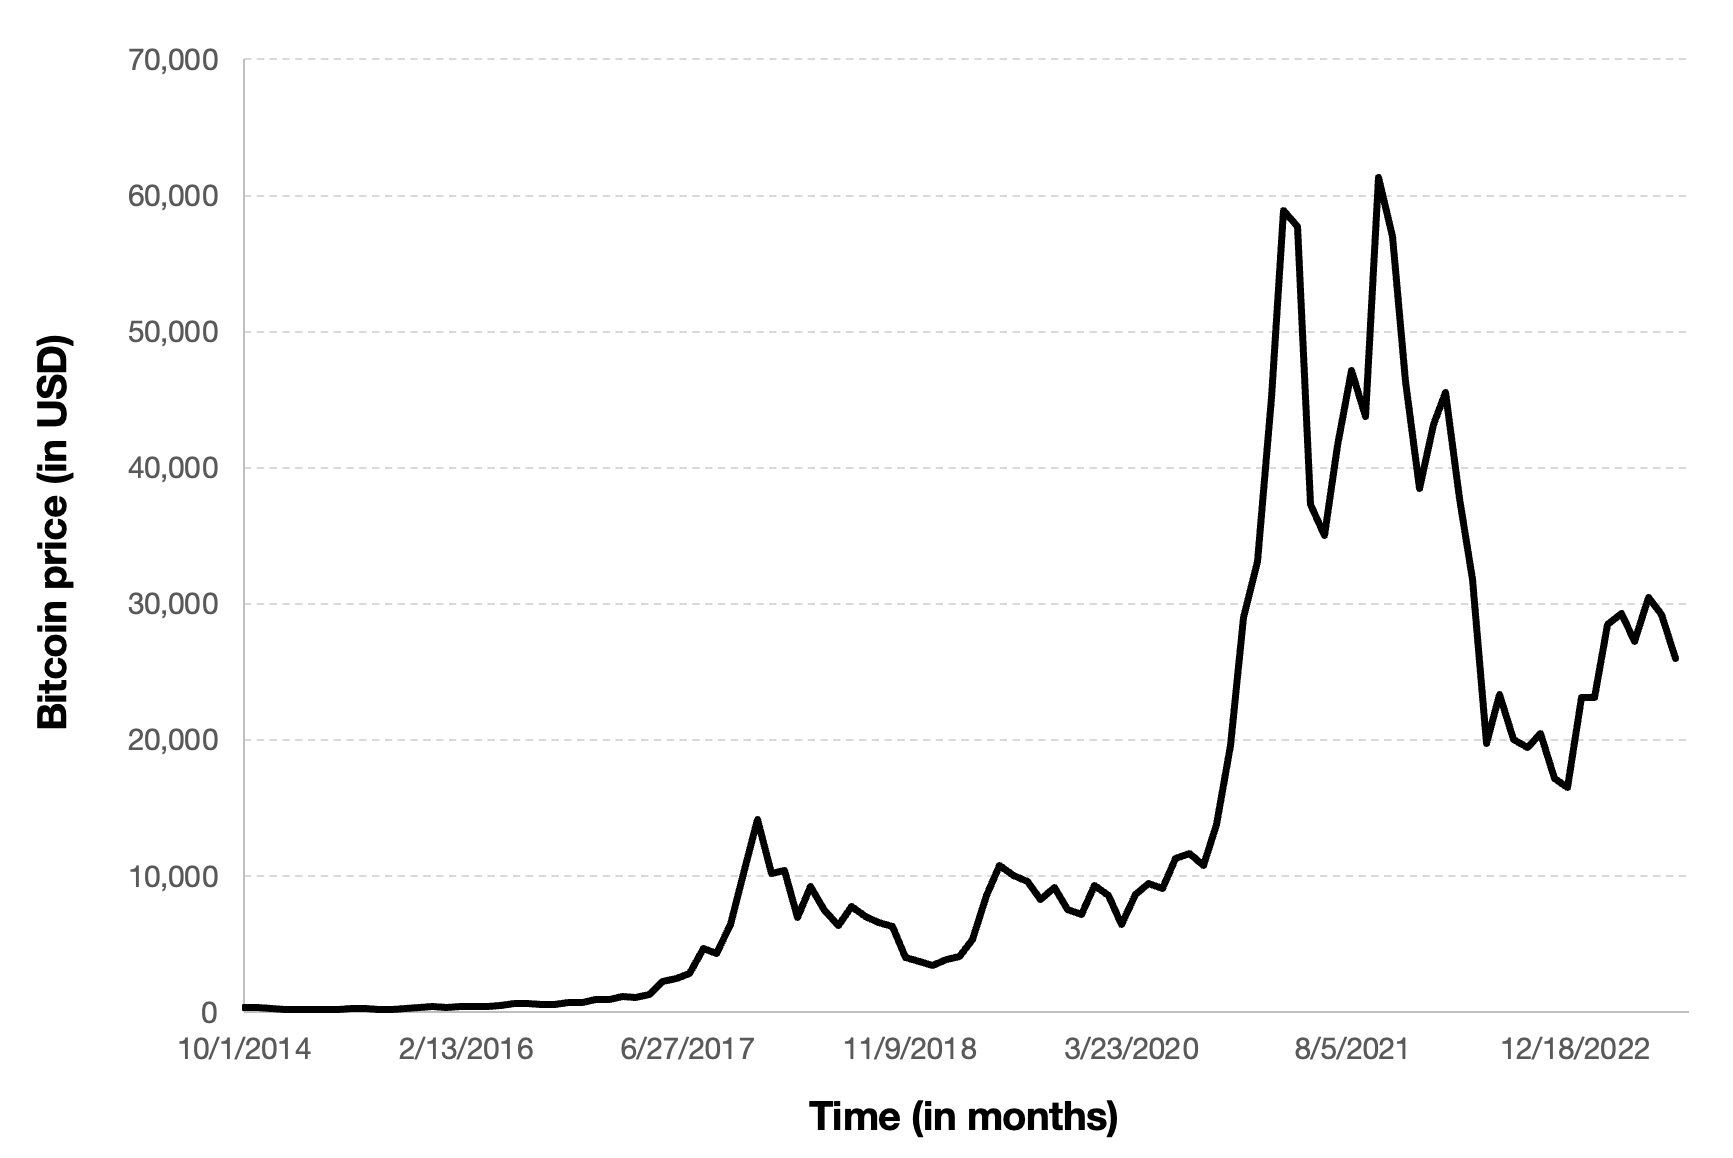
Figure 4 below represents the evolution of the price of XRP in US dollar over the period Nov 2017 – Dec 2023. The price corresponds to the “closing” price (observed at 10:00 PM CET at the end of the month).
Figure 4. Evolution of the XRP price
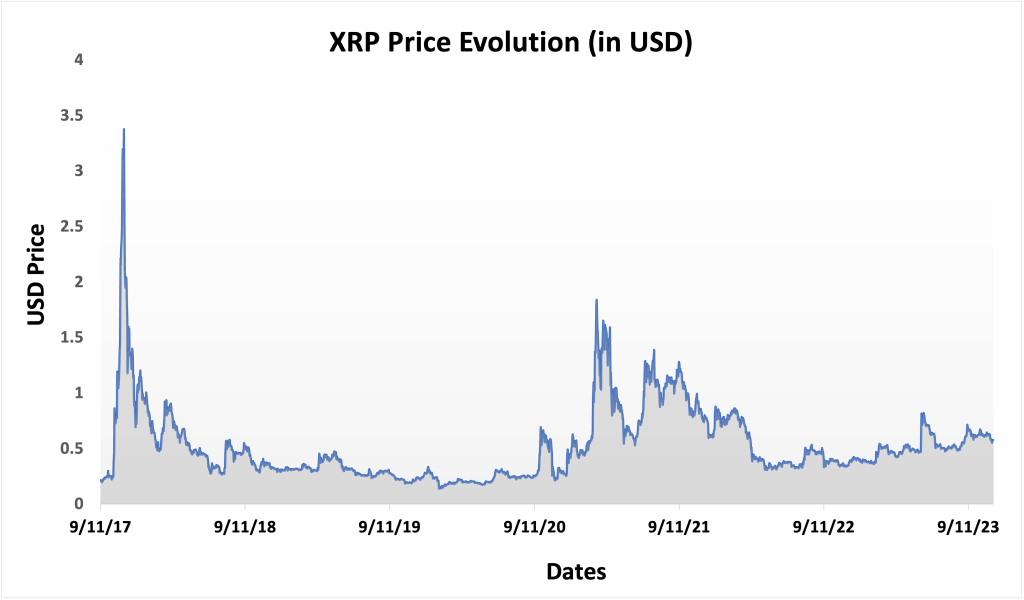
Source: Yahoo! Finance
R program
The R program below written by Shengyu ZHENG allows you to download the data from Yahoo! Finance website and to compute summary statistics and risk measures about the XRP.

Data file
The R program that you can download above allows you to download the data for the Ethereum from the Yahoo! Finance website. The database starts on December, 2017.
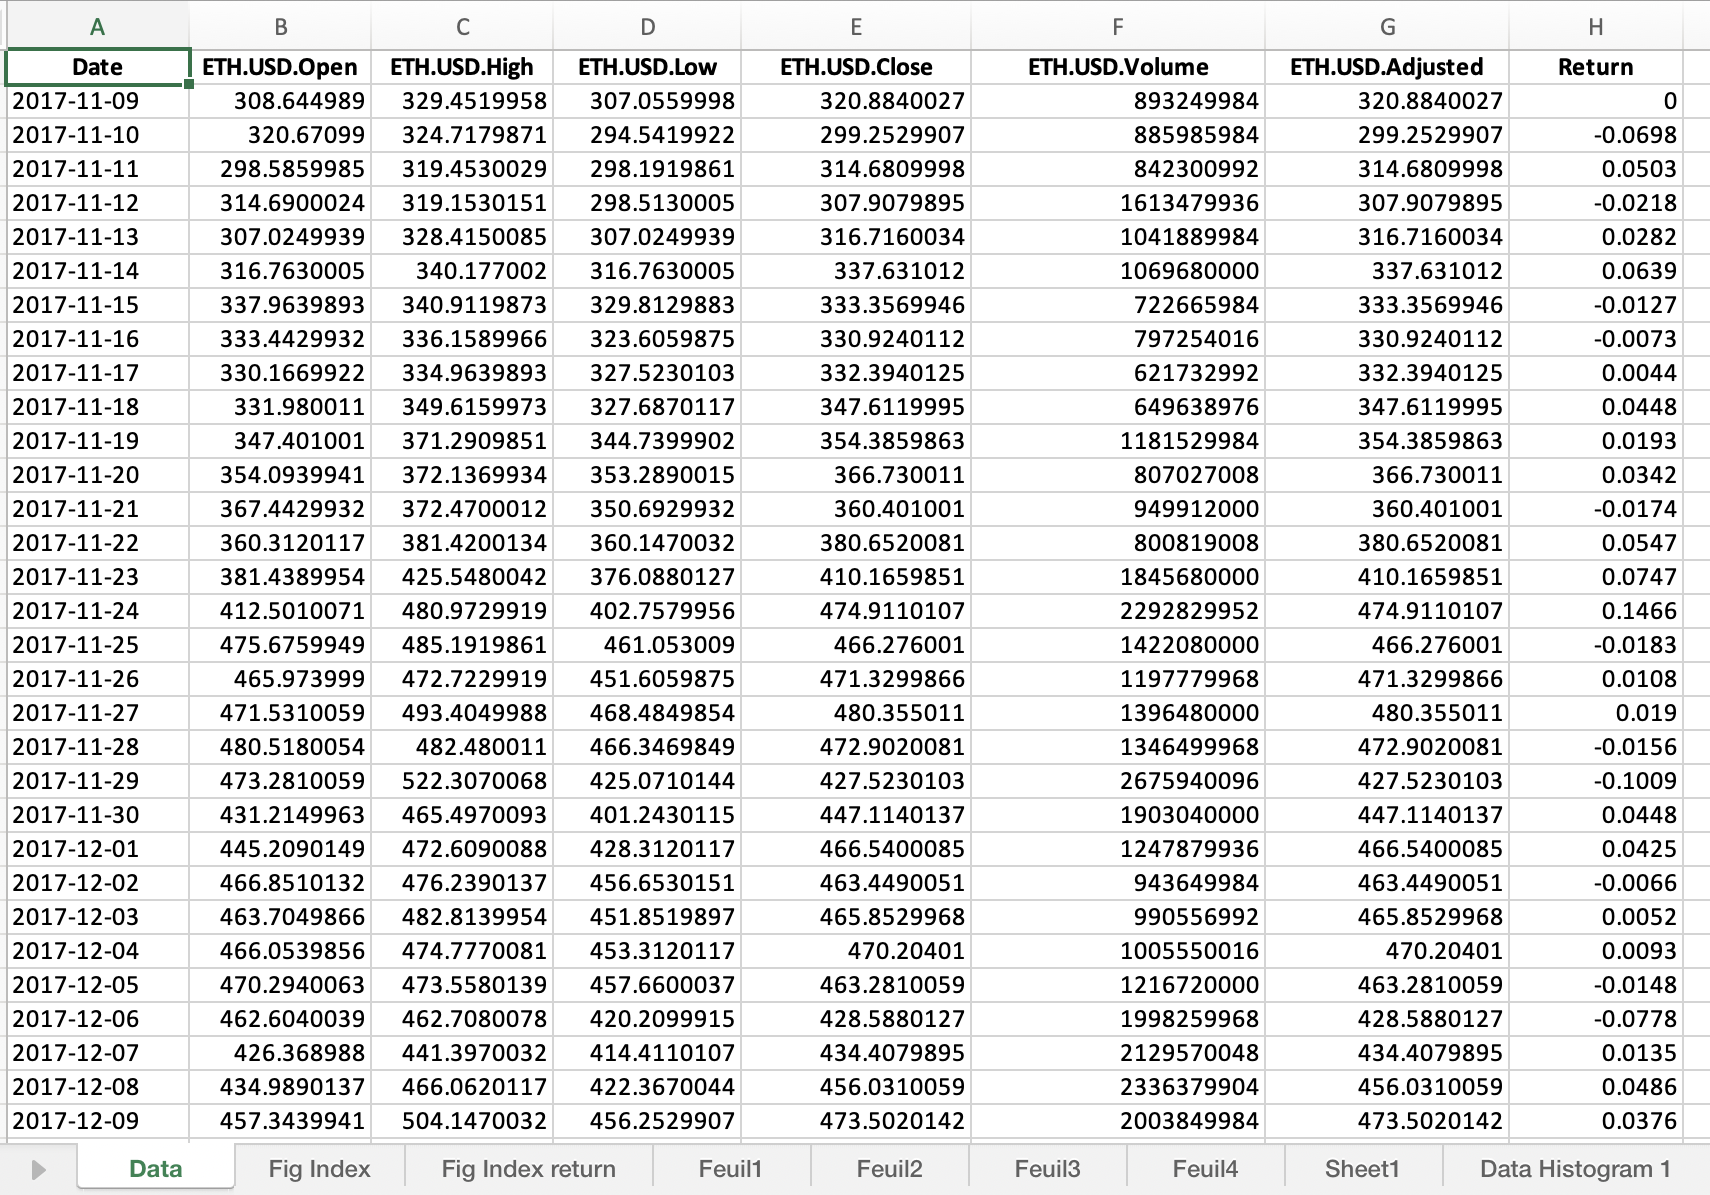
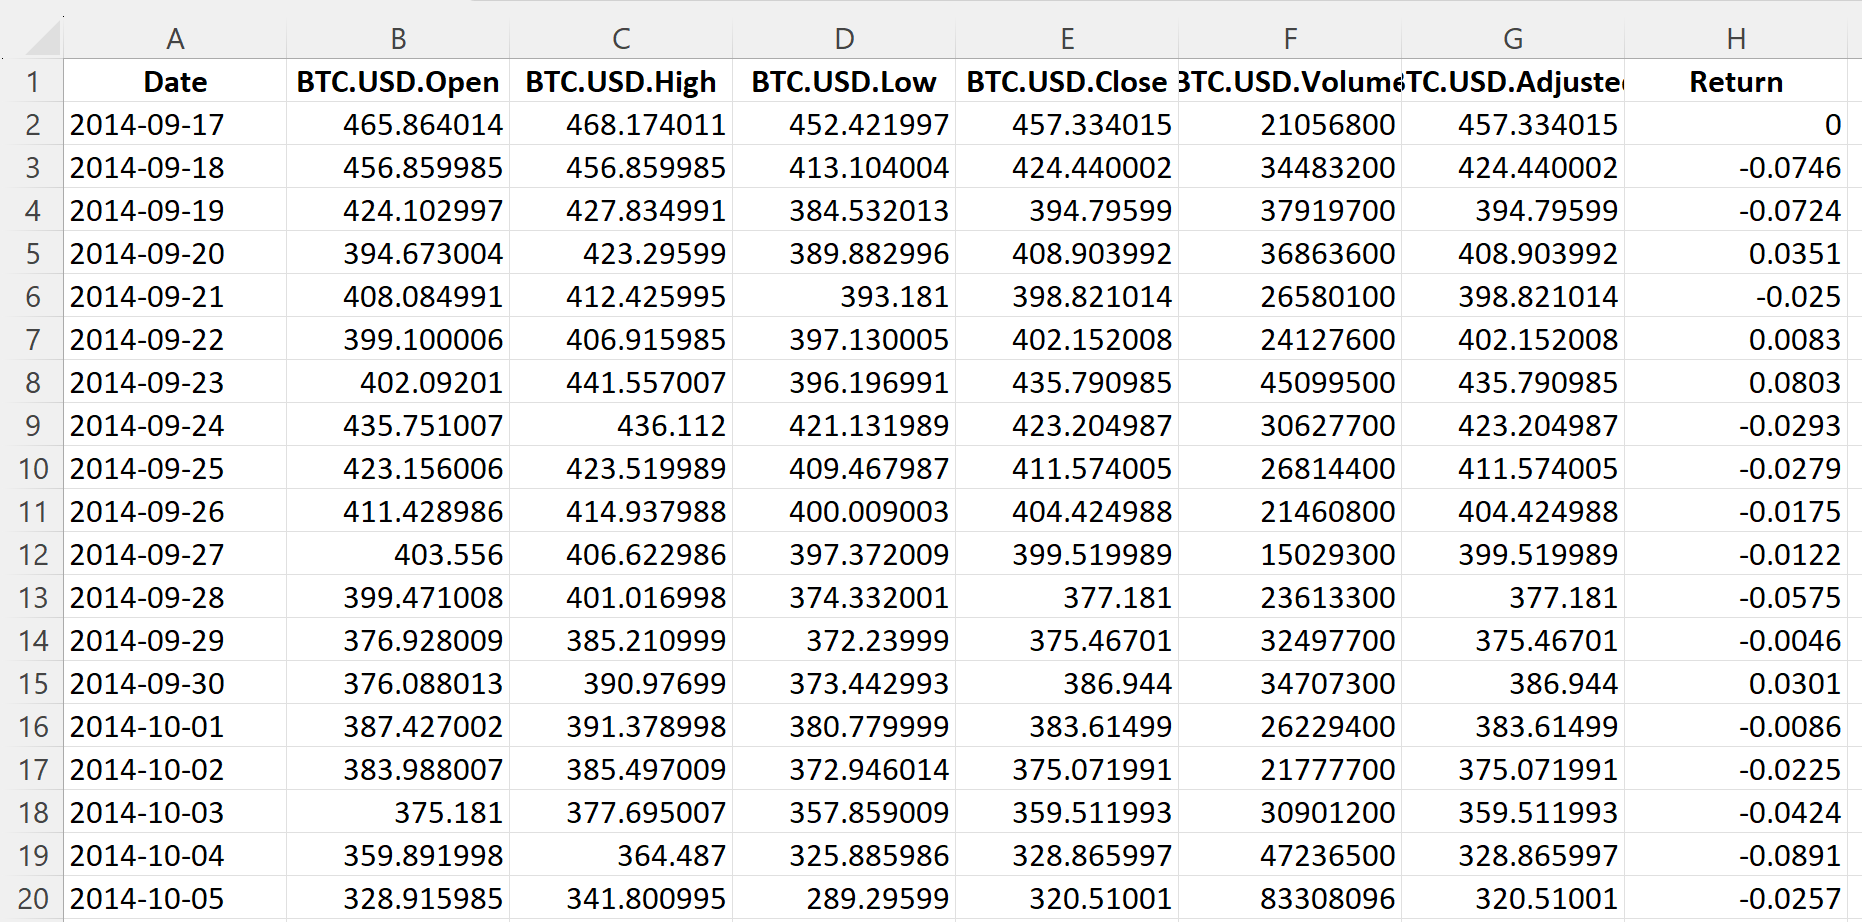
Table 3 below represents the top of the data file for the Ethereum downloaded from the Yahoo! Finance website with the R program.
Table 3. Top of the data file for XRP.
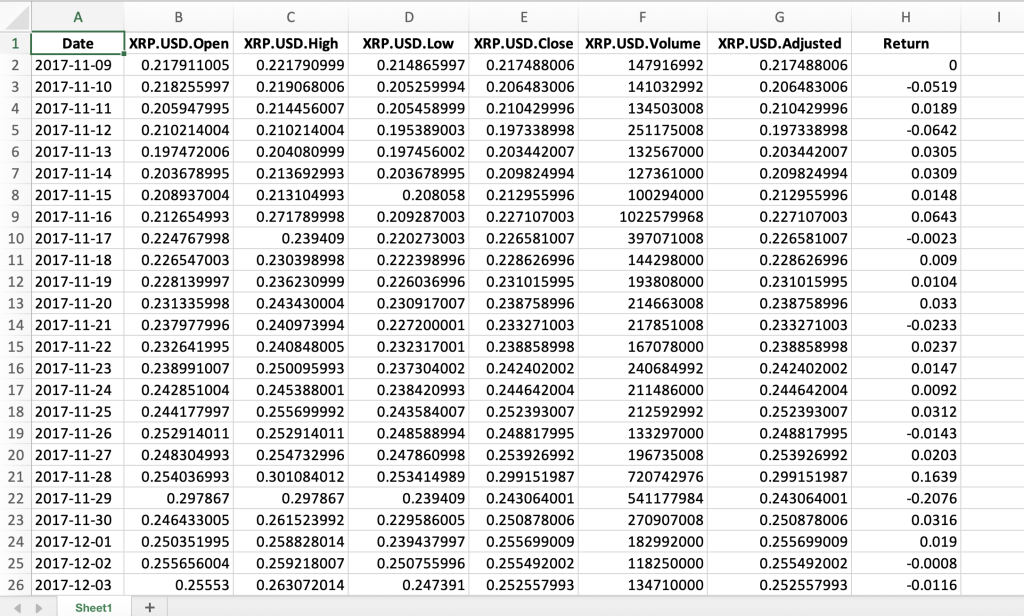
Source: computation by the author (data: Yahoo! Finance website)
Python code
You can download the Python code used to download the data from Yahoo! Finance.

Python script to download XRP historical data and save it to an Excel sheet::
import yfinance as yf
import pandas as pd
# Define the ticker symbol for Ethereum
xrp_ticker = “XRP-USD”
# Define the date range for historical data
start_date = “2020-01-01”
end_date = “2022-01-01”
# Download historical data using yfinance
xrp_data = yf.download(xrp_ticker, start=start_date, end=end_date)
# Create a Pandas DataFrame from the downloaded data
xrp_df = pd.DataFrame(xrp_data)
# Define the Excel file path
excel_file_path = “xrp_historical_data.xlsx”
# Save the data to an Excel sheet
xrp_df.to_excel(excel_file_path, sheet_name=”XRP Historical Data”)
print(f”Data saved to {excel_file_path}”)
# Make sure you have the required libraries installed and adjust the “start_date” and “end_date” variables to the desired date range for the historical data you want to download.
Evolution of the Ethereum
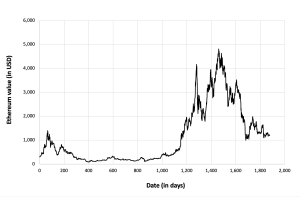
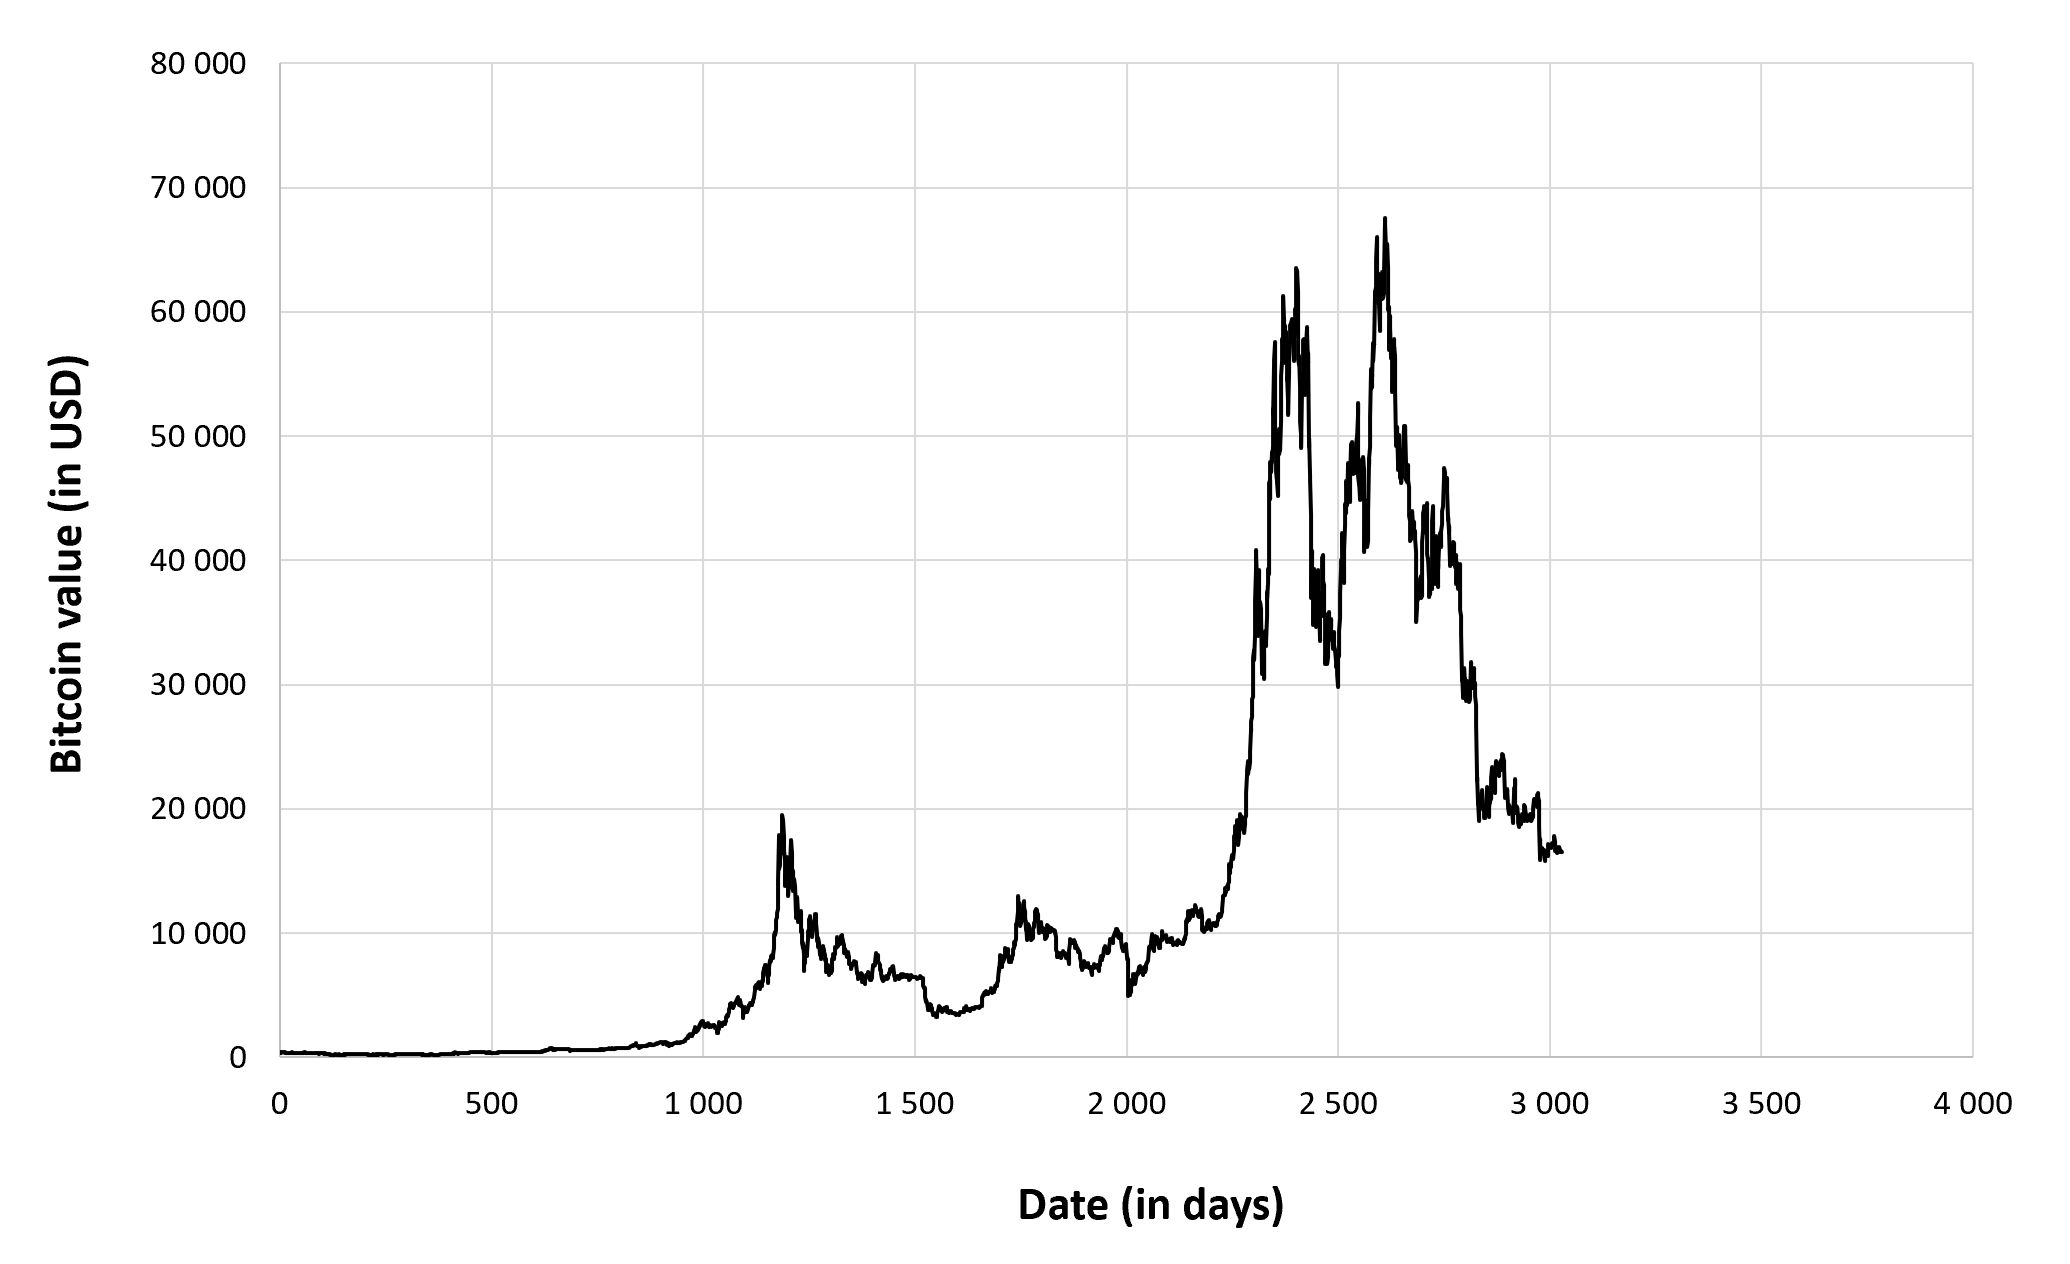
Figure 5 below gives the evolution of the Ethereum on a daily basis.
Figure 5. Evolution of the XRP.
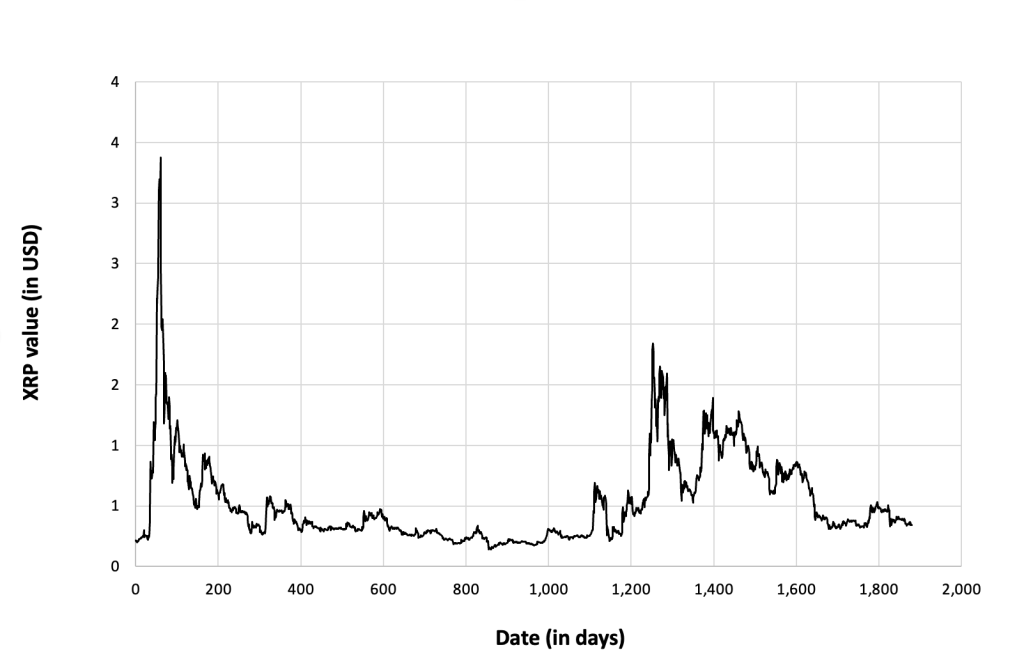
Source: computation by the author (data: Yahoo! Finance website).
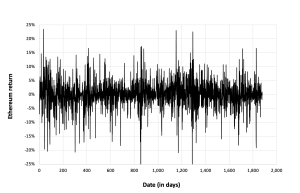
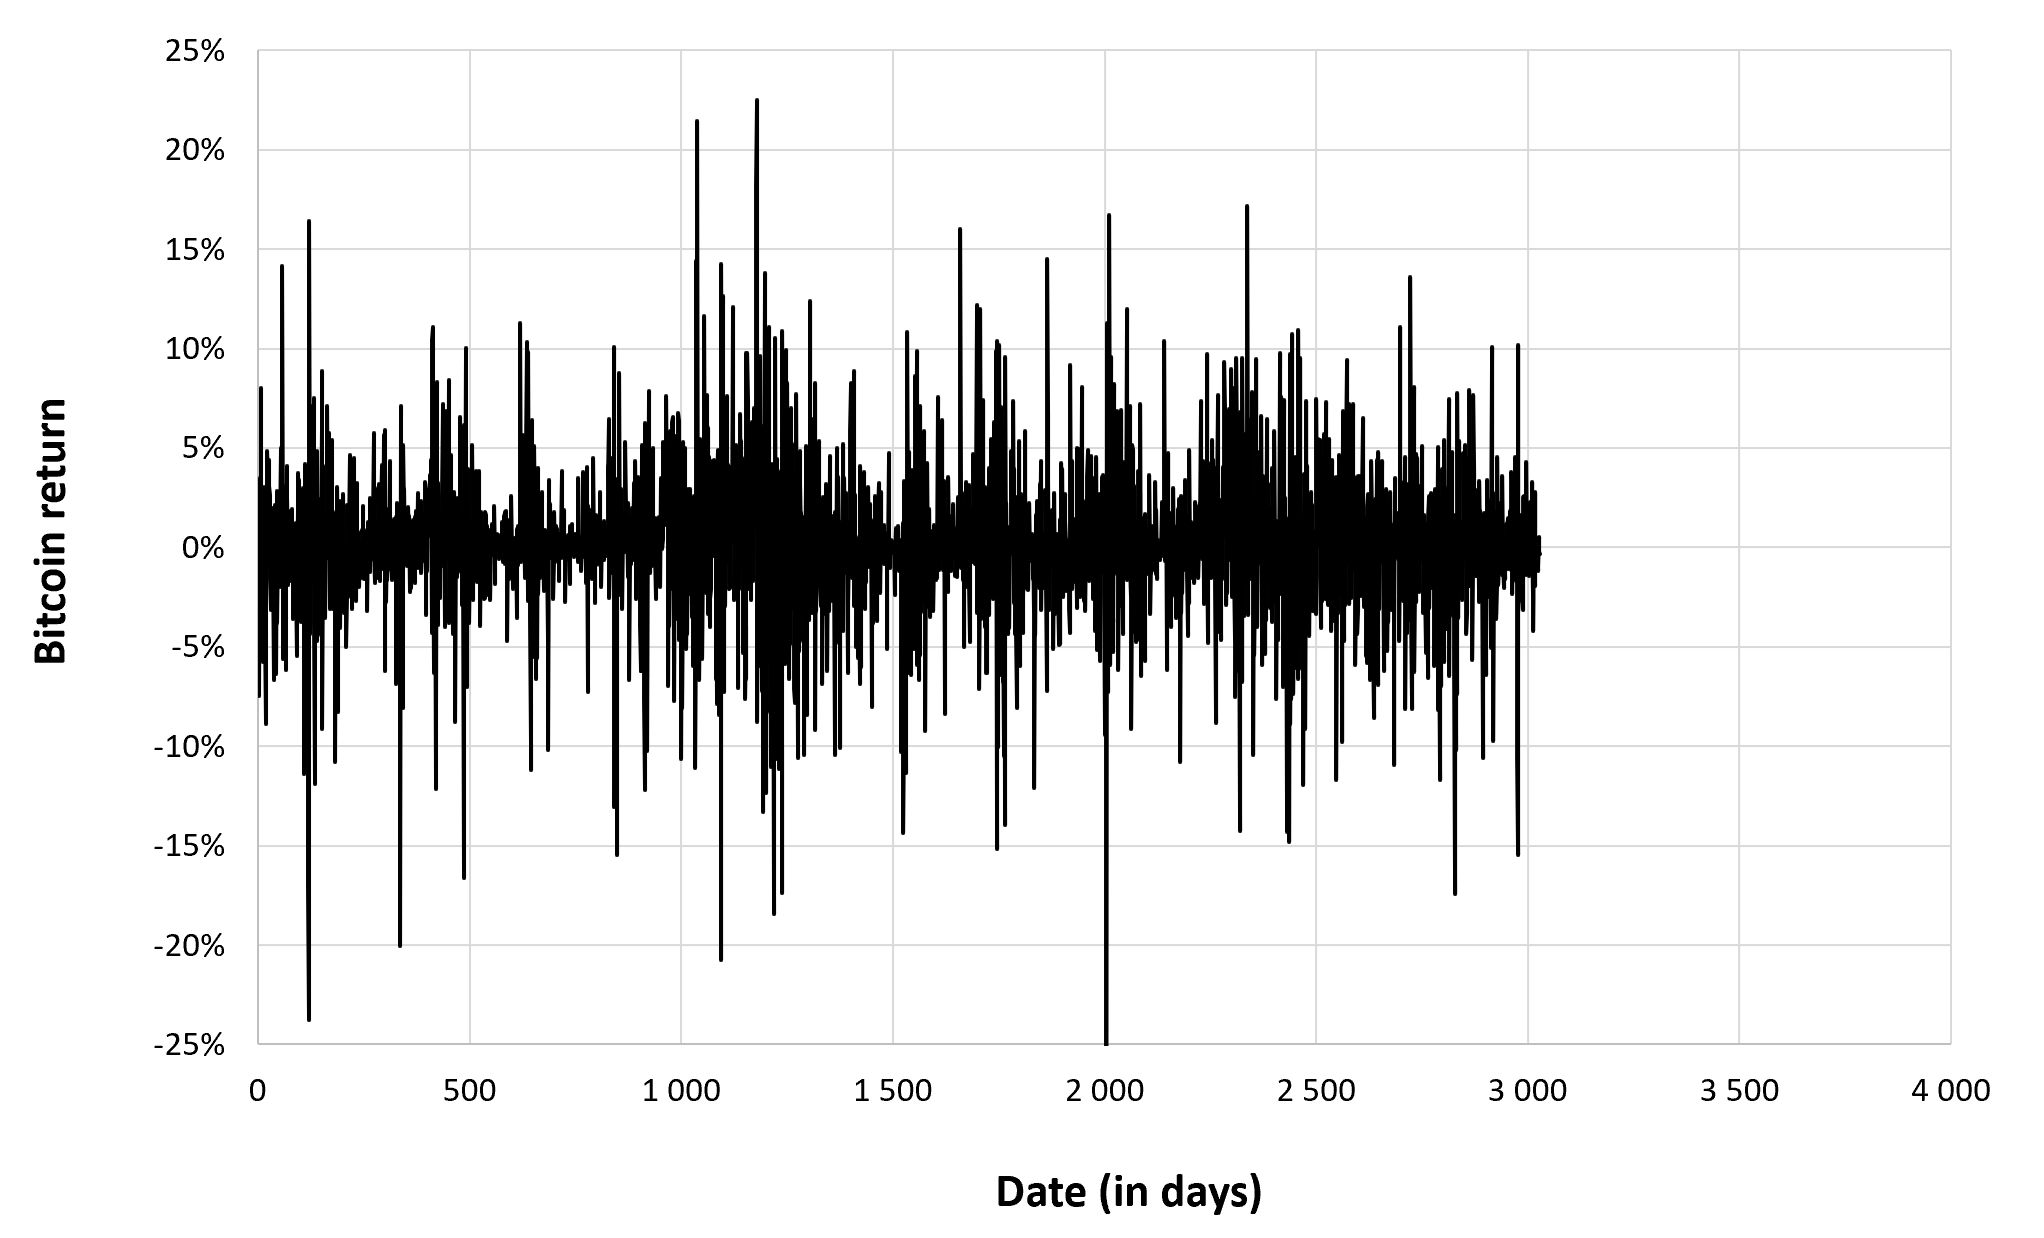
Figure 6 below gives the evolution of the Ethereum returns from November 09, 2017 to December 31, 2022 on a daily basis.
Figure 6. Evolution of the XRP returns.
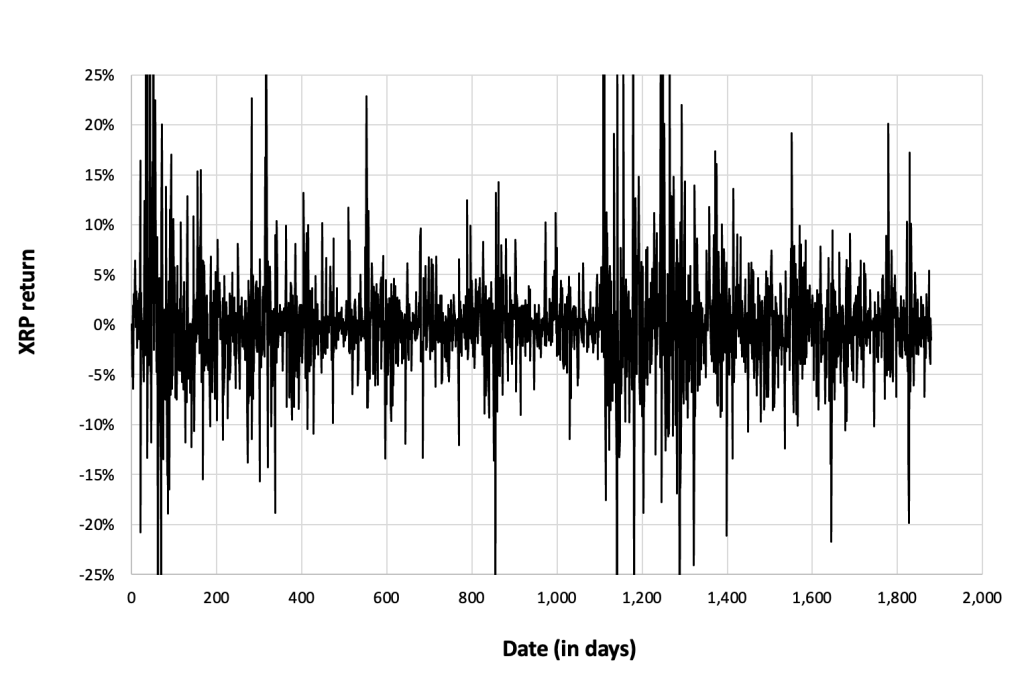
Source: computation by the author (data: Yahoo! Finance website).
Summary statistics for the Ethereum
The R program that you can download above also allows you to compute summary statistics about the returns of the Ethereum.
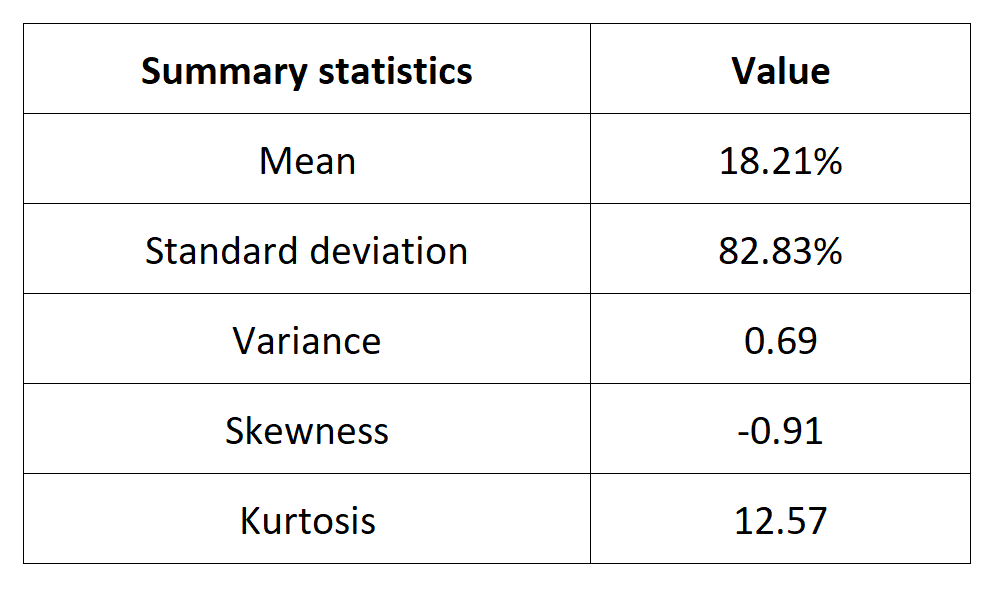
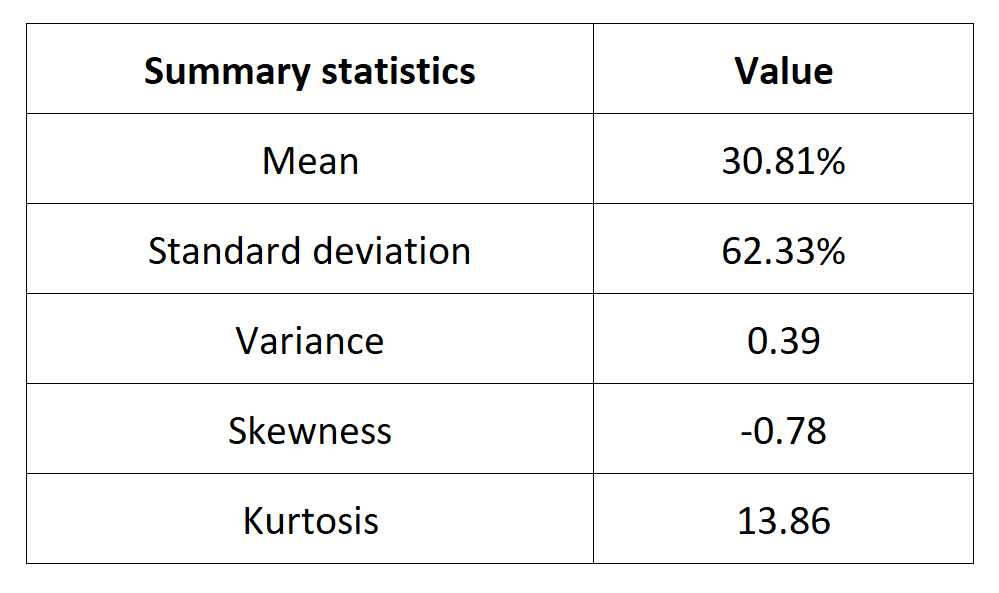
Table 4 below presents the following summary statistics estimated for the Ethereum:
- The mean
- The standard deviation (the squared root of the variance)
- The skewness
- The kurtosis.
The mean, the standard deviation / variance, the skewness, and the kurtosis refer to the first, second, third and fourth moments of statistical distribution of returns respectively.
Table 4. Summary statistics for XRP
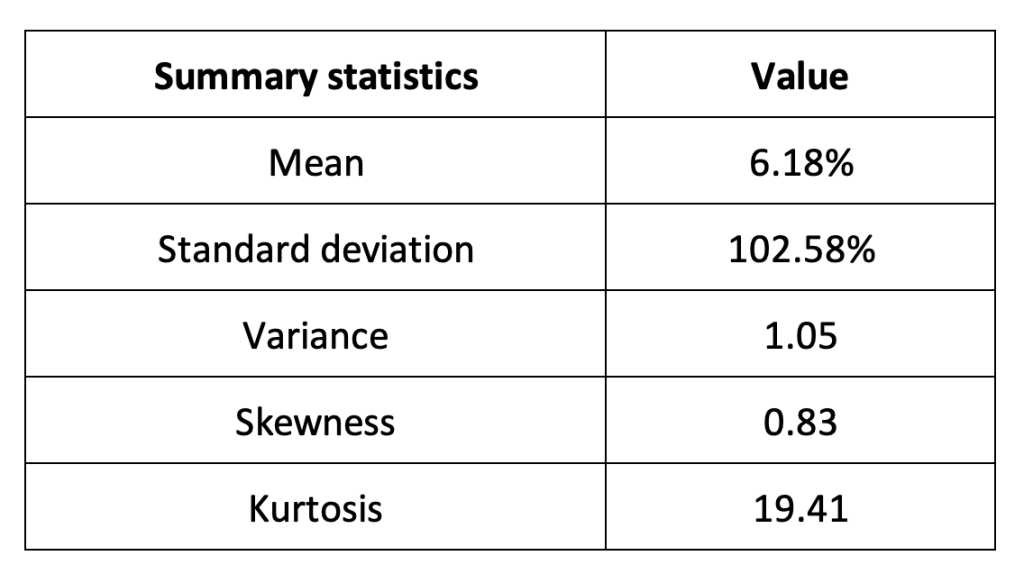
Source: computation by the author (data: Yahoo! Finance website).
Statistical distribution of the Ethereum returns
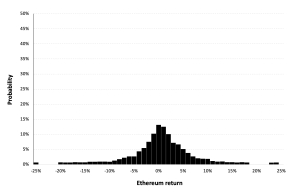
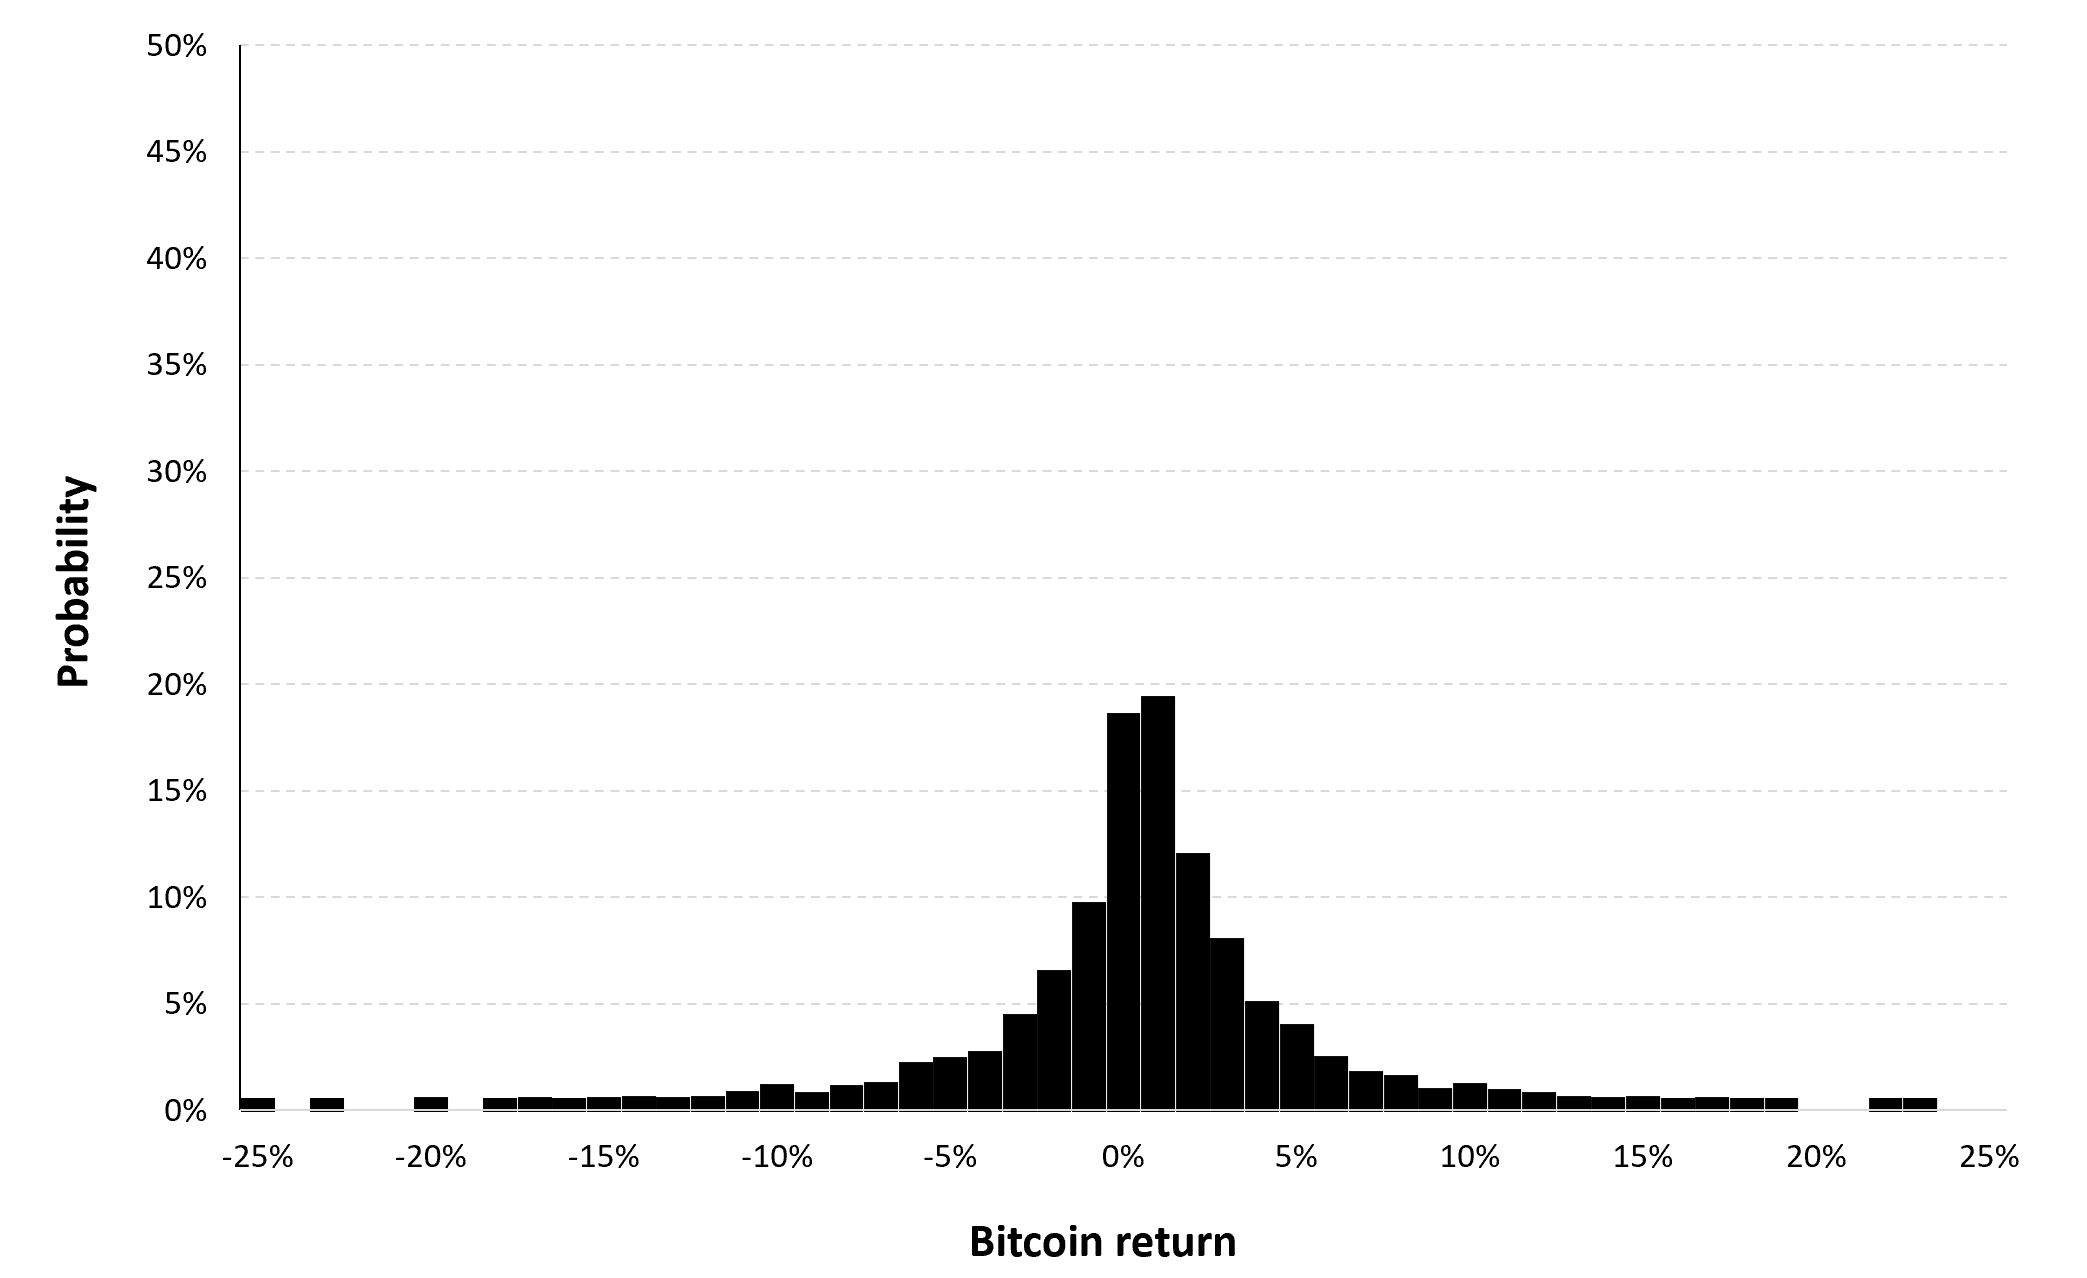
Figure 7 represents the historical distribution of the Ethereum daily returns for the period from November 09, 2017 to December 31, 2022.
Figure 7. Historical XRP distribution of the returns.
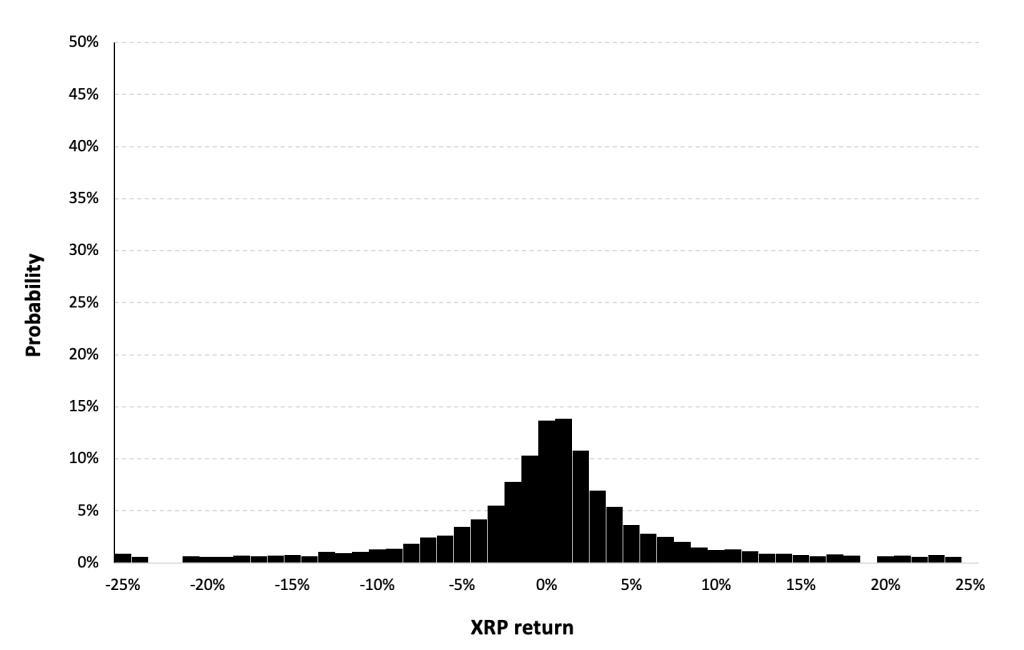
Source: computation by the author (data: Yahoo! Finance website).
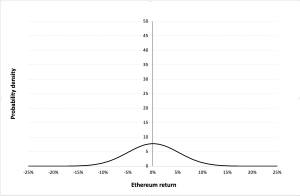
Gaussian distribution
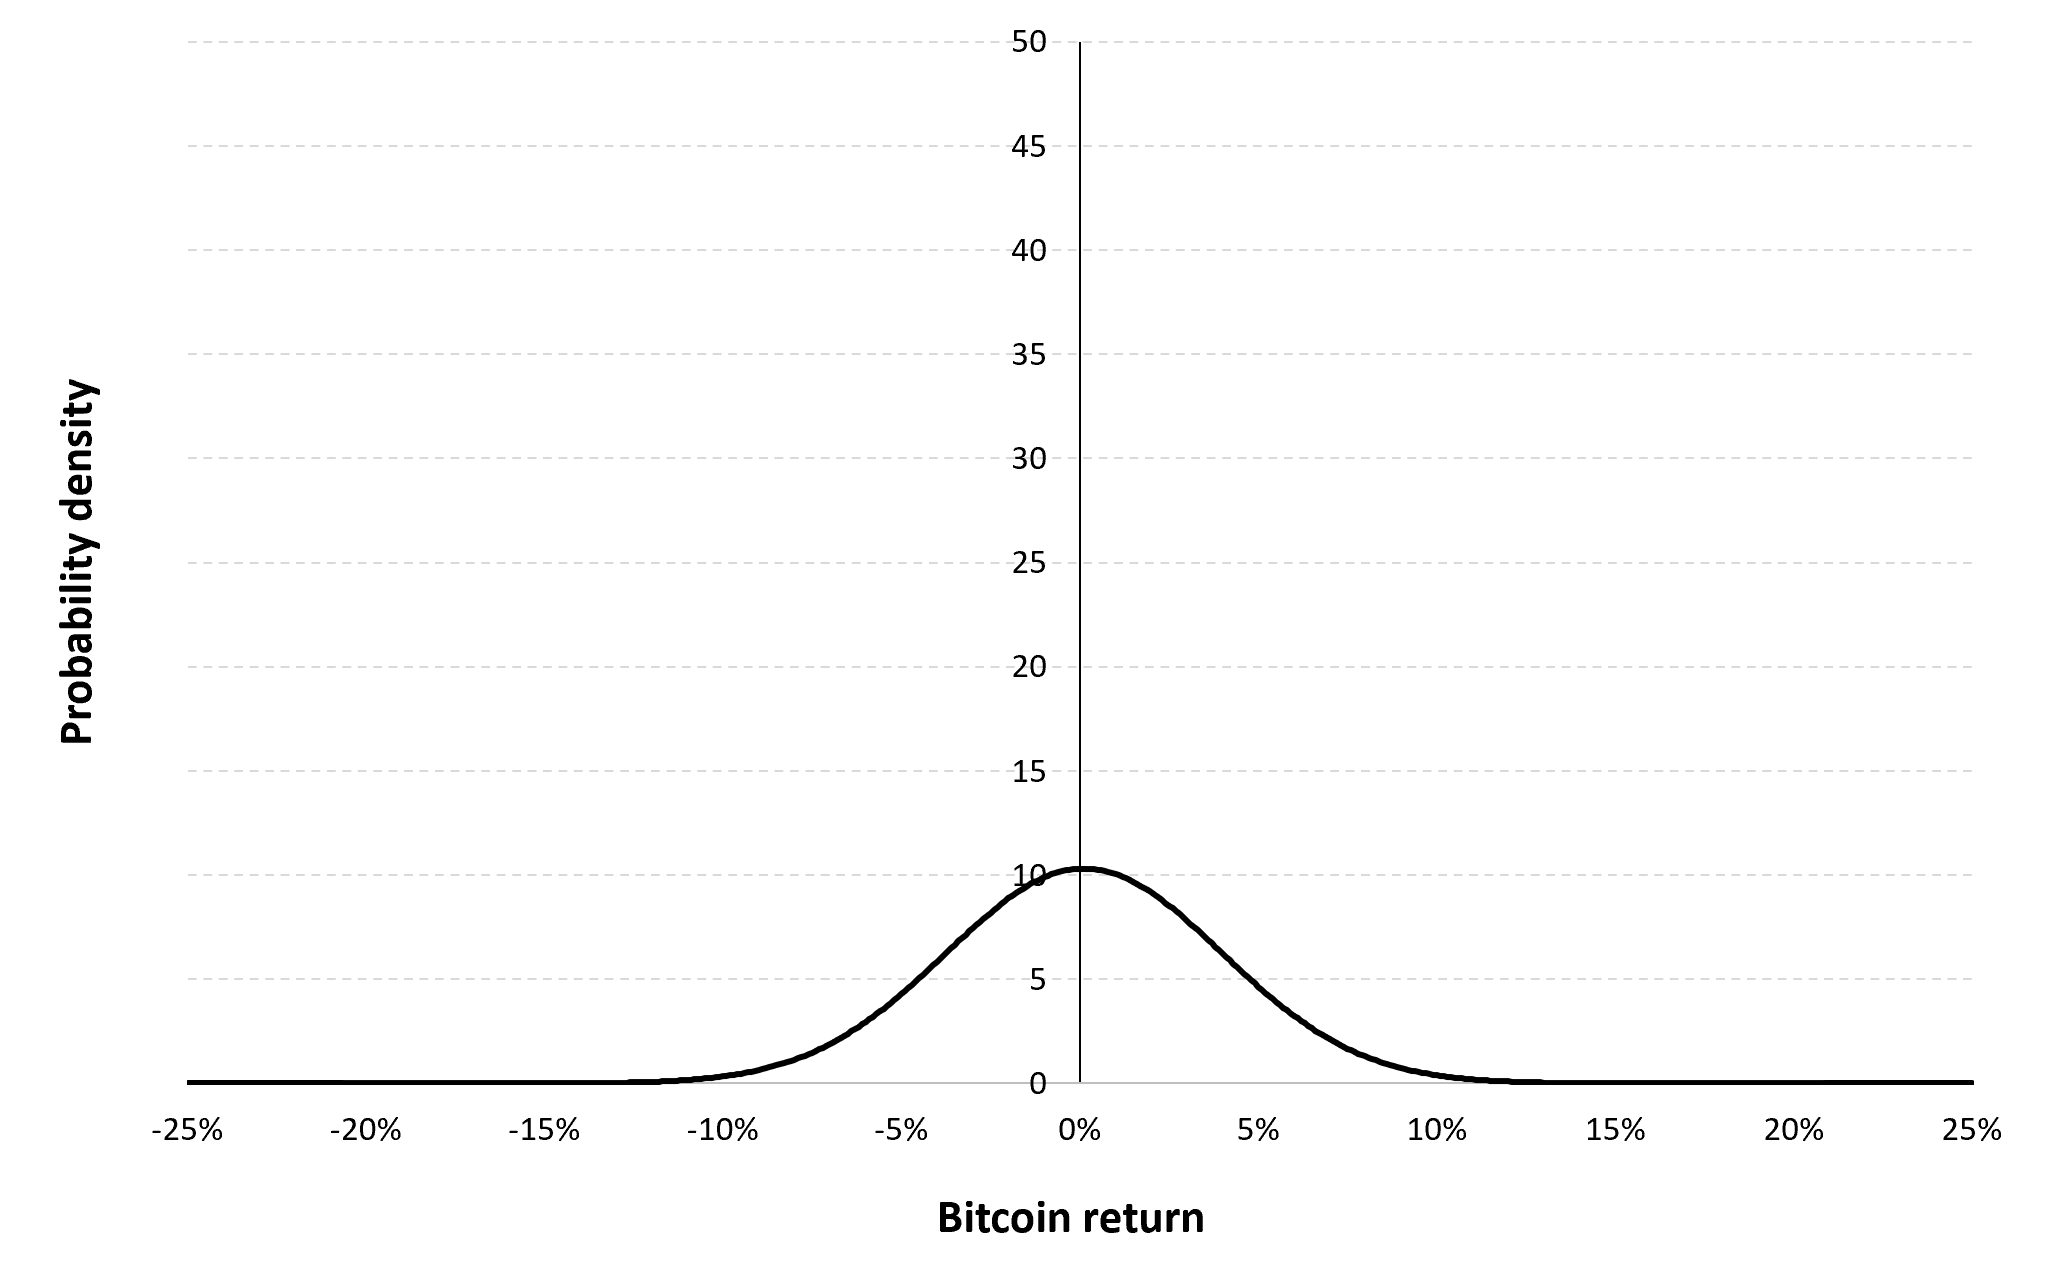
The Gaussian distribution (also called the normal distribution) is a parametric distribution with two parameters: the mean and the standard deviation of returns. We estimated these two parameters over the period from November 09, 2017 to December 31, 2022.
Figure 8 below represents the Gaussian distribution of the XRP daily returns with parameters estimated over the period from November 09, 2017 to December 31, 2022.
Figure 9. Gaussian distribution of the XRP returns.
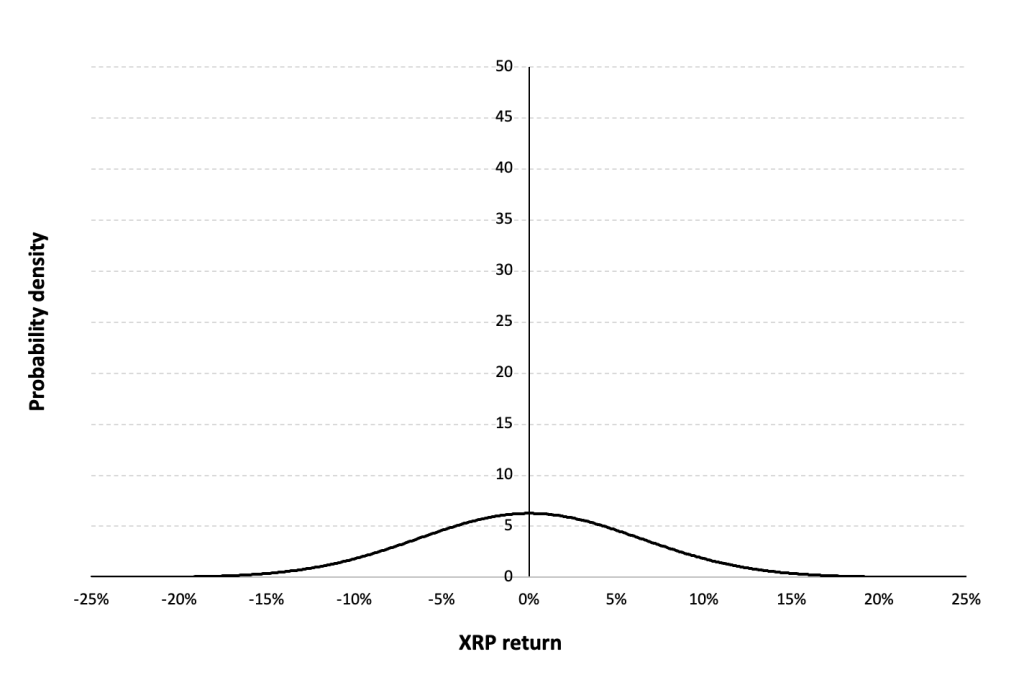
Source: computation by the author (data: Yahoo! Finance website).
Risk measures of the Ethereum returns
The R program that you can download above also allows you to compute risk measures about the returns of the Ethereum.
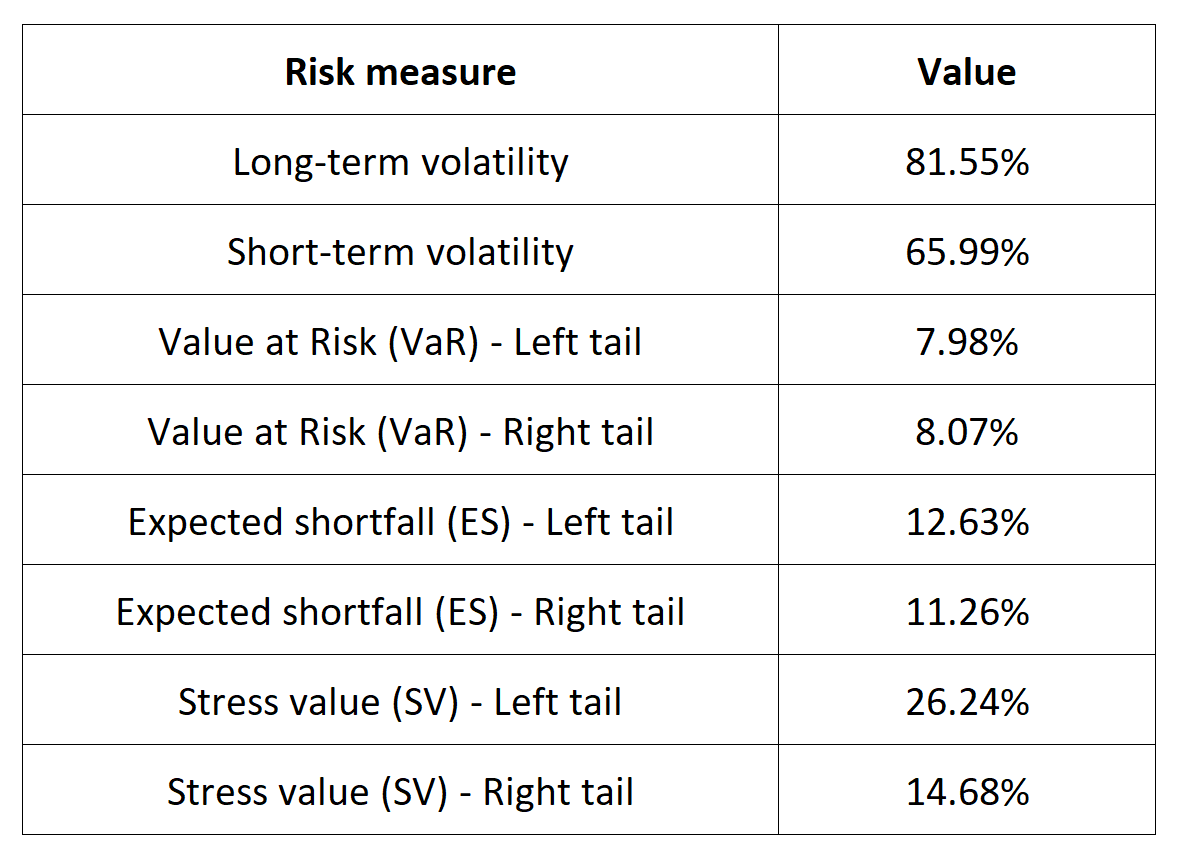
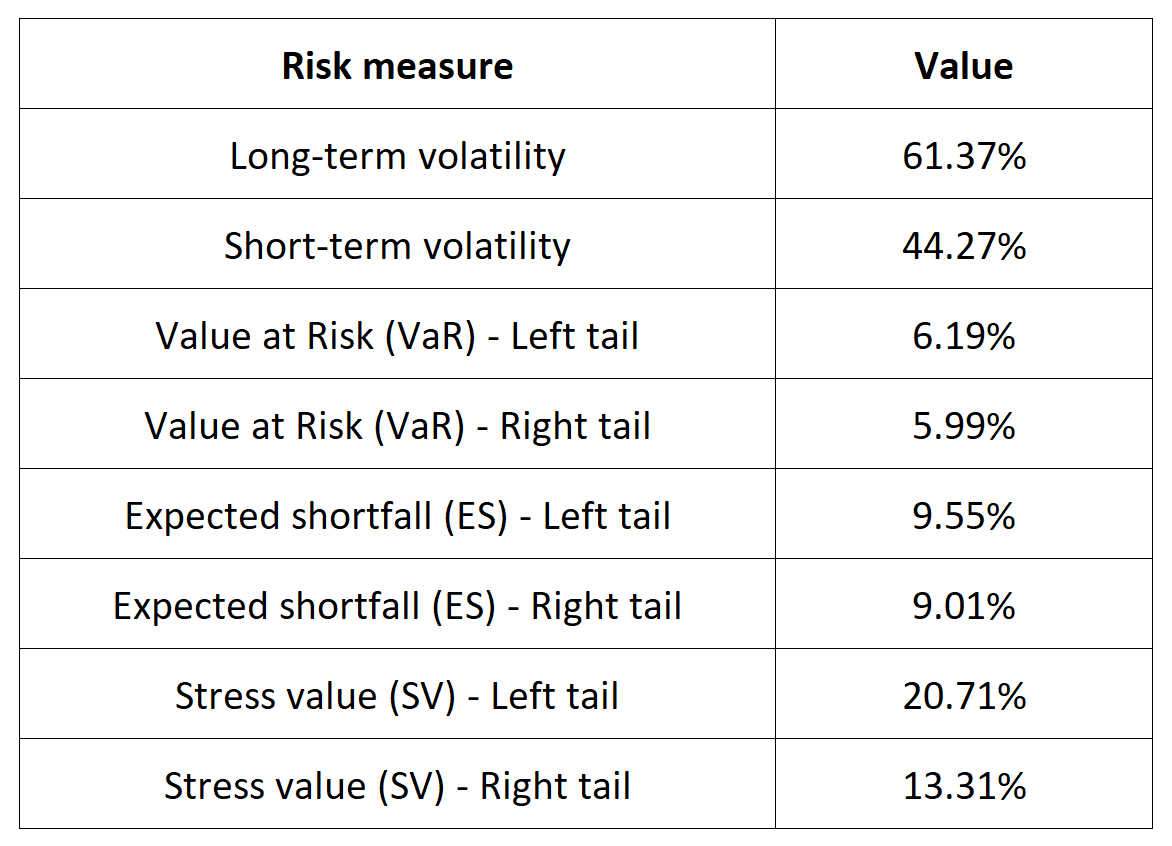
Table 5 below presents the following risk measures estimated for the Ethereum:
- The long-term volatility (the unconditional standard deviation estimated over the entire period)
- The short-term volatility (the standard deviation estimated over the last three months)
- The Value at Risk (VaR) for the left tail (the 5% quantile of the historical distribution)
- The Value at Risk (VaR) for the right tail (the 95% quantile of the historical distribution)
- The Expected Shortfall (ES) for the left tail (the average loss over the 5% quantile of the historical distribution)
- The Expected Shortfall (ES) for the right tail (the average loss over the 95% quantile of the historical distribution)
- The Stress Value (SV) for the left tail (the 1% quantile of the tail distribution estimated with a Generalized Pareto distribution)
- The Stress Value (SV) for the right tail (the 99% quantile of the tail distribution estimated with a Generalized Pareto distribution)
Table 5. Risk measures for the XRP.
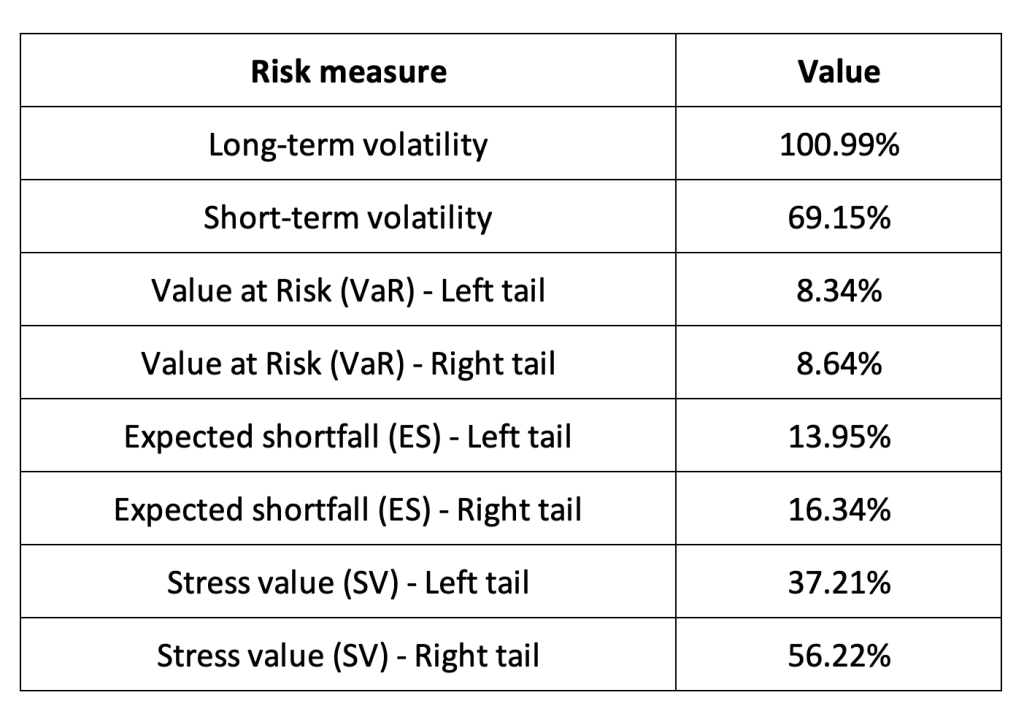
Source: computation by the author (data: Yahoo! Finance website).
The volatility is a global measure of risk as it considers all the returns. The Value at Risk (VaR), Expected Shortfall (ES) and Stress Value (SV) are local measures of risk as they focus on the tails of the distribution. The study of the left tail is relevant for an investor holding a long position in the XRP while the study of the right tail is relevant for an investor holding a short position in the XRP.
Why should I be interested in this post?
XRP, the cryptocurrency associated with Ripple, is a compelling subject for students, especially those in finance, economics, business, and technology. Ripple’s focus on revolutionizing cross-border transactions and its unique blockchain technology offer insights into innovations in financial technology. Exploring XRP provides a deeper understanding of blockchain, cryptocurrency markets, regulatory challenges, and the practical applications of decentralized systems. Students can gain valuable knowledge about market dynamics, investment opportunities, and the intersection of technology and finance by delving into the complexities of XRP and its impact on the financial industry.
Related posts on the SimTrade blog
About cryptocurrencies
▶ Snehasish CHINARA Bitcoin: the mother of all cryptocurrencies
▶ Snehasish CHINARA How to get crypto data
▶ Alexandre VERLET Cryptocurrencies
▶ Youssef EL QAMCAOUIDecentralised Financing
▶ Hugo MEYERThe regulation of cryptocurrencies: what are we talking about?
About statistics
▶ Shengyu ZHENG Moments de la distribution
▶ Shengyu ZHENG Mesures de risques
▶ Jayati WALIA Returns
Useful resources
Academic research about risk
Longin F. (2000) From VaR to stress testing: the extreme value approach Journal of Banking and Finance, N°24, pp 1097-1130.
Longin F. (2016) Extreme events in finance: a handbook of extreme value theory and its applications Wiley Editions.
Data
Yahoo! Finance Historical data for XRP
CoinMarketCap Historical data for XRP
About the author
The article was written in January 2024 by Snehasish CHINARA (ESSEC Business School, Grande Ecole Program – Master in Management, 2022-2024).