

In this article, Anirudh KUMAR (B.S. Economics, IIT Kanpur, with a minor in Artificial Intelligence and Machine Learning) shares his experience as a machine learning research intern. From February to August 2024, he worked under the supervision of Professor Swagato Chatterjee on a study of how people respond to Facebook communication about hydrogen fuel cell vehicles. The project later became a paper in IEEE Transactions on Engineering Management.
About the research project
The project examined a practical communication problem. When an organization posts about a sustainable technology, which parts of the message are associated with likes, comments, shares, and other interactions? We chose hydrogen fuel cell vehicles because the technology is promising but still unfamiliar to many people. Organizations therefore have to explain both its immediate uses and its longer-term potential.
A single subject can be framed in very different ways. A post about a hydrogen-powered bus might discuss lower tailpipe emissions, give technical details about fuel-cell efficiency, announce a government pilot project, or warn about the cost of delaying cleaner transport. The technology is the same, but the topic, readability, and emotional tone are different. Our job was to turn those differences into variables that we could test.
My internship
My missions
My mission was to help build a reproducible pipeline from raw Facebook posts to research findings. I worked on text cleaning, topic modelling, sentiment and emotion measures, model comparison, charts, and short research briefs. Each stage had to answer a specific question: what was measured, why was it measured that way, and could another researcher reproduce the result?
Figure 1. From Facebook posts to research findings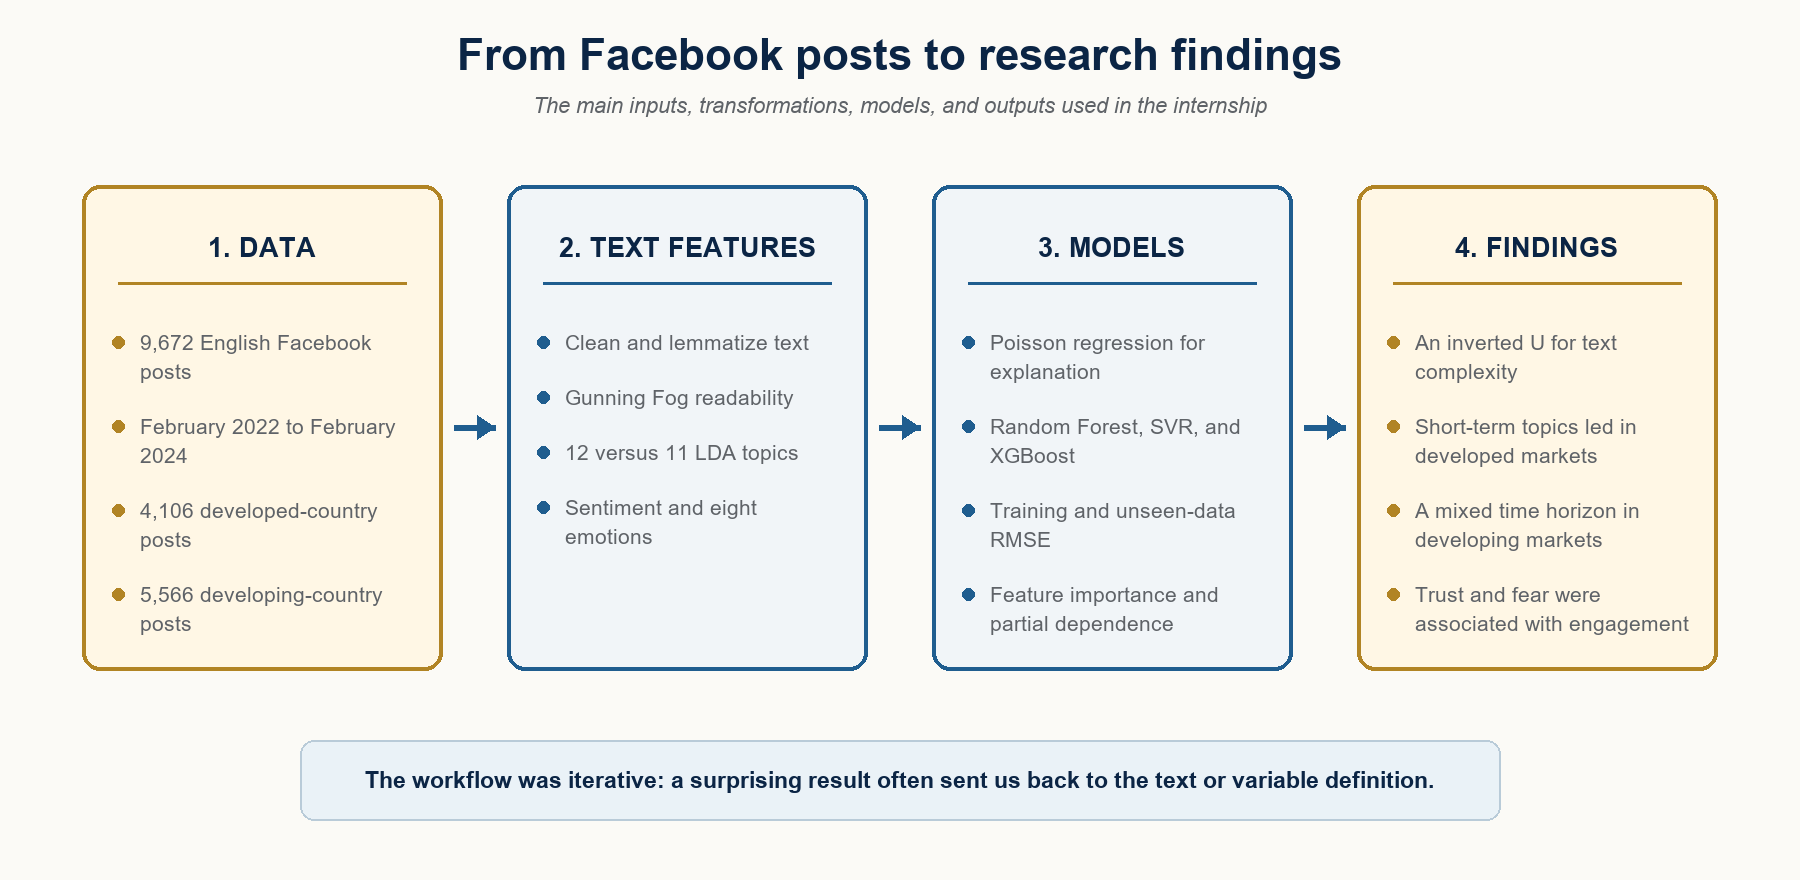
Source: Author’s own work.
The research workflow in practice
Step 1: collecting and structuring the data
The study used Facebook posts collected through CrowdTangle from February 2022 to February 2024. The search combined “hydrogen fuel” with terms such as vehicle, car, transport, train, airplane, traffic, and truck. We kept English-language posts and used the country of the page administrators to divide the sample.
The final dataset contained 9,672 posts: 4,106 observations from developed countries and 5,566 from developing countries. The developed-country sample was led by the United States, the United Kingdom, and Australia. The developing-country sample included India, China, the Philippines, South Africa, Pakistan, Myanmar, and observations from 72 other countries.
Our outcome variable was the total number of interactions with a post. We also recorded factors that could affect engagement even before considering the words, including the page’s followers and likes at the time of posting and whether the post was a photo, video, status update, or another format.
Step 2: cleaning the text with NLTK and spaCy
NLTK and spaCy are Python libraries for natural language processing. I used them to split text into tokens, remove material that did not help the analysis, and reduce related word forms to a common lemma. For example, lemmatization can map vehicles to vehicle and emissions to emission. This prevents the model from treating simple grammatical variations as unrelated ideas.
A simplified preprocessing example
Illustrative post before cleaning: “Hydrogen-powered buses are not yet cost competitive, but they can reduce urban emissions.”
Illustrative tokens after cleaning: “hydrogen”, “power”, “bus”, “not”, “yet”, “cost”, “competitive”, “reduce”, “urban”, “emission”.
The word not is important. If a standard stop-word list removed it, the sentence could appear more positive than the writer intended. I therefore did not treat preprocessing as a one-click operation. I inspected examples after URL and punctuation removal, after tokenization, after stop-word filtering, after lemmatization, and after the final features had been created. This is what I meant by checking the data after every major transformation.
Consistency mattered too. The forms EV, electric vehicle, and electric vehicles can refer to the same idea. If they are left as separate terms without review, topic frequencies and model inputs can become harder to interpret.
Step 3: finding topics with Latent Dirichlet Allocation
Latent Dirichlet Allocation, or LDA, is a topic model. It searches for groups of words that often occur together and represents each post as a mixture of those groups. I compared specifications with different numbers of topics and used coherence scores as one diagnostic. The final choice also had to produce topics that a reader could distinguish and name.
For developed countries, the model identified 12 topics. Examples included “Battery Technology and Toxicity” with words such as battery, lithium, toxic, electricity, EV, and metal; “Electric Aircraft and Aviation” with aircraft, plane, aviation, and flight; and “Electric Cars and Sustainable Transportation” with vehicle, electric, car, and powered. These three short-term topics had the strongest positive relationships with engagement relative to the reference topic in the final Poisson model.
For developing countries, the model identified 11 topics. Examples included “Government Green Energy Projects”, “Electric Vehicles and Battery Technology”, and “Future Energy Technologies”. The mix was different from the developed-country sample: immediate transport projects mattered, but longer-term energy planning also attracted attention.
This step taught me the difference between an output and a finding. LDA will always return word groups. The researcher still has to check whether those groups are stable, distinct, and useful for answering the research question.
Step 4: measuring sentiment and emotion
I used TextBlob and NLTK WordNet for sentiment measures and NRCLex for emotion categories. Sentiment summarizes whether the language is more positive or negative. NRCLex adds categories such as anticipation, trust, joy, surprise, fear, anger, disgust, and sadness.
The distinction matters because two negative messages can invite different reactions. A post expressing sadness about slow adoption may encourage passive reading, while a post warning about an urgent climate or energy risk may evoke fear and prompt comments or shares. In the final models, fear had the strongest positive relationship among the negative emotions in both country groups. Among positive emotions, anticipation was important in developed countries and trust was important in developing countries.
Dictionary-based scores are constructed variables, not direct readings of a person’s feelings. Negation, technical language, and context can change a sentence’s meaning. I therefore checked sample classifications instead of assuming that every automated label was correct.
Step 5: measuring readability
The study measured text complexity with the Gunning Fog Index. The index combines average sentence length with the share of complex words, usually words with three or more syllables:
Fog Index = 0.4 x [(words / sentences) + 100 x (complex words / words)]
Consider three ways to introduce the same subject. “Hydrogen cars are good” is easy to read but says little. “Hydrogen fuel cells produce electricity without tailpipe carbon emissions, although storage and refuelling remain costly” gives the reader both an accessible explanation and useful detail. A paragraph filled with unexplained terms such as proton-exchange membranes, electrochemical conversion, and volumetric energy density may be accurate but difficult for a general audience.
The results showed an inverted U-shaped relationship between the Fog Index and interactions. Engagement rose as messages became more informative, then fell when the text became too complex. The precise turning point differed by context. In the developing-country analysis, the partial-dependence curve reached its maximum near a Fog score of 20.
Step 6: comparing explanatory and predictive models
We used Poisson regression to explain how readability, topics, and emotions were associated with the count of interactions. We then compared Random Forest, Support Vector Regression, XGBoost, and Poisson-based predictive models. The predictive exercise used both in-sample and out-of-sample root mean squared error, or RMSE. A lower out-of-sample RMSE means the model predicted unseen posts more accurately.
The comparison also showed why the training score cannot be the only criterion. In the developed-country sample, XGBoost achieved a low in-sample error but showed signs of overfitting. Random Forest provided a better balance. Its out-of-sample RMSE fell from 4,898 in the baseline model to 3,056 after topic information was added. Adding emotion variables changed the error to 3,171, so the larger feature set was not automatically better.
What the study found
Message complexity has a middle ground
Posts that were very simple could lack useful information, while highly technical posts could demand too much effort from a general reader. The highest engagement appeared between those extremes. For an organization, the practical lesson is to explain the technology clearly without removing the detail that makes the message informative.
Relevant topics differ across markets
In developed countries, short-term topics such as electric vehicles, battery technology, and aviation were more engaging than distant or futuristic themes. In developing countries, the pattern was mixed. Government green-energy projects and battery technology mattered, but future energy technologies also resonated. A single global content plan would miss these differences.
Trust and fear both matter
Trust can make a new technology feel credible, while fear can draw attention to the consequences of inaction. Neither result means that organizations should exaggerate. It means the emotional tone of a message is measurable and should be considered alongside the topic and readability.
Communicating the results
I converted the analysis into topic tables, model-comparison charts, feature-importance plots, and three short research briefs. One chart compared the out-of-sample RMSE of the four predictive approaches. Another summarized the 12 developed-country topics and the 11 developing-country topics. The briefs translated those outputs into communication questions: how technical should a post be, which topics fit each market, and which emotional signals require careful interpretation?
This work exposed weak explanations quickly. If I could not explain why Random Forest was preferred to XGBoost, or what a topic coefficient meant relative to the reference topic, the figure was not ready for another reader.
Required skills and knowledge
The internship required Python, natural language processing, regression, machine learning, and model evaluation. My economics courses helped me define variables and separate association from causation. My AI and machine-learning coursework helped me build the pipeline and compare models.
The work also required careful records. I kept track of cleaning rules, exclusions, topic specifications, model versions, and evaluation results. I treated the code as shared work. A co-author should be able to see what changed and why.
From internship to publication
The project developed into the article Drivers of Social Media Engagement on Organizational Communication on Sustainable Technological Innovation: Insights from Developed and Developing Countries, published in 2026 in IEEE Transactions on Engineering Management.
The manuscript went through several rounds of revision. I learned to treat a changed result as information rather than as a setback. If a coefficient, topic, or model ranking changed after a reasonable specification check, we needed to understand the reason before keeping the claim.
What I learned
The question comes before the model.
I now write the research question in plain language before opening a notebook. In this project, the question was not simply which algorithm predicts engagement best. We also needed to understand which message characteristics were associated with engagement and whether the relationships differed across country groups.
Small decisions need a record.
A stop-word choice can change the meaning of a sentence. A different number of LDA topics can change the labels used in the regression. Weeks later, those decisions are difficult to reconstruct from memory, so I keep a short log of exclusions, transformations, and model changes.
Prediction and explanation are different tasks.
Poisson regression helped us interpret relationships between the features and interaction counts. Random Forest was more useful for prediction. Neither result replaced the other. A strong research design needed both an interpretable explanation and an honest test on unseen data.
Financial concepts related to my internship
Investor attention
Attention is scarce in financial markets as well as on social media. Investors cannot read every earnings call, filing, news article, and management post. Topic and engagement analysis can help researchers study which firms or themes receive attention and whether that attention is associated with trading activity.
Sentiment and textual analysis
Earnings calls, annual reports, and management commentary contain language that can be measured systematically. The internship taught me to inspect how a sentiment variable was built before treating it as a signal. A financial sentence with negation or technical terminology can confuse the same dictionary methods used for social-media text.
Model risk
The XGBoost result offered a direct example of model risk. A model can fit the training data closely and perform poorly on new observations. Out-of-sample tests, sensitivity checks, and readable documentation are essential when a model may influence an investment or business decision.
How I use these lessons now
In my current work as an AI Growth Intern at Pocket FM, I apply the same method to a different problem: a GenAI workflow that converts Hindi audio scripts into Marathi. I work with editors to define quality criteria for emotional beats, narrative hooks, and regional expressions. A fluent translation is not enough if it changes the scene’s intent.
The research internship taught me to make those criteria explicit, inspect intermediate outputs, and document recurring errors. The tools have changed, but the habit of testing each transformation remains useful.
Why should I be interested in this post?
A published paper can make research look linear. My experience was less tidy. A cleaning rule affected the topics, the topics affected the models, and the models sometimes sent us back to an earlier decision. The practical work was in those links.
For students interested in finance, data science, or AI, the project shows how researchers can turn raw language into evidence. Technical skill is necessary, but the result is easier to trust when the examples, assumptions, and out-of-sample performance are visible.
Related posts on the SimTrade blog
Looking for an internship or a research experience? You may find useful information in other posts where contributors describe their professional work:
▶ All posts about Professional experiences
▶ Haiyuan XU My professional experience as a financial research assistant in a green finance institute
▶ Anant JAIN My internship experience at Deloitte
Useful resources
Chatterjee, S., Ghatak, A., Meena, A. K. and Meena, P. (2026). Drivers of Social Media Engagement on Organizational Communication on Sustainable Technological Innovation: Insights from Developed and Developing Countries. IEEE Transactions on Engineering Management, 73. DOI: 10.1109/TEM.2026.3665711.
Blei, D. M., Ng, A. Y. and Jordan, M. I. (2003). Latent Dirichlet Allocation. Journal of Machine Learning Research, 3, 993-1022.
NLTK Project. Natural Language Toolkit documentation.
Explosion. spaCy usage documentation.
About the author
The article was written in July 2026 by Anirudh KUMAR, who completed a B.S. in Economics at IIT Kanpur with a minor in Artificial Intelligence and Machine Learning. He is an AI Growth Intern at Pocket FM and previously worked in product management at AryaVastra and machine-learning research under Professor Swagato Chatterjee. His interests include behavioral finance, empirical research, and AI applications in business.
▶ Discover all articles by Anirudh KUMAR.