In this article, Jayati WALIA (ESSEC Business School, Grande Ecole Program – Master in Management, 2019-2022) presents an overview of standard deviation and its use in financial markets.
Definition
The standard deviation is a measure that indicates how much data scatter around the mean. The idea is to measure how an observation deviates from the mean on average./p>
Mathematical formulae
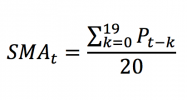
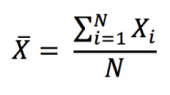
The first step to compute the standard deviation is to compute the mean. Considering a variable X, the arithmetic mean of a data set with N observations, X1, X2 … XN, is computed as:
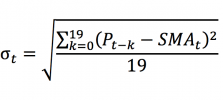
In the data set analysis, we also consider the dispersion or variability of data values around the central tendency or the mean. The variance of a data set is a measure of dispersion of data set values from the (estimated) mean and can be expressed as:
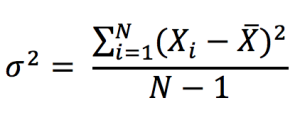
Note that in the above formula we divide by N-1 because the mean is not known but estimated (usual case in finance). If the mean is known with certainty (when dealing the whole population not a sample), then we divide by N.
A problem with variance, however, is the difficulty of interpreting it due to its squared unit of measurement. This issue is resolved by using the standard deviation, which has the same measurement unit as the observations of the data set (such as percentage, dollar, etc.). The standard deviation is computed as the square root of variance:
A low value standard deviation indicates that the data set values tend to be closer to the mean of the set and thus lower dispersion, while a high standard deviation indicates that the values are spread out over a wider range indication higher dispersion.
Measure of volatility
For financial investments, the X variable in the above formulas would correspond to the return on the investment computed on a given period of time. We usually consider the trade-off between risk and reward. In this context, the reward corresponds to the expected return measured by the mean, and the risk corresponds to the standard deviation of returns.
In financial markets, the standard deviation of asset returns is used as a statistical measure of the risk associated with price fluctuations of any particular security or asset (such as stocks, bonds, etc.) or the risk of a portfolio of assets (such as mutual funds, index mutual funds or ETFs, etc.).
Investors always consider a mathematical basis to make investment decisions known as mean-variance optimization which enables them to make a meaningful comparison between the expected return and risk associated with any security. In other words, investors expect higher future returns on an investment on average if that investment holds a relatively higher level of risk or uncertainty. Standard deviation thus provides a quantified estimate of the risk or volatility of future returns.
In the context of financial securities, the higher the standard deviation, the greater is the dispersion between each return and the mean, which indicates a wider price range and hence greater volatility. Similarly, the lower the standard deviation, the lesser is the dispersion between each return and the mean, which indicates a narrower price range and hence lower volatility for the security.
Example: Apple Stock
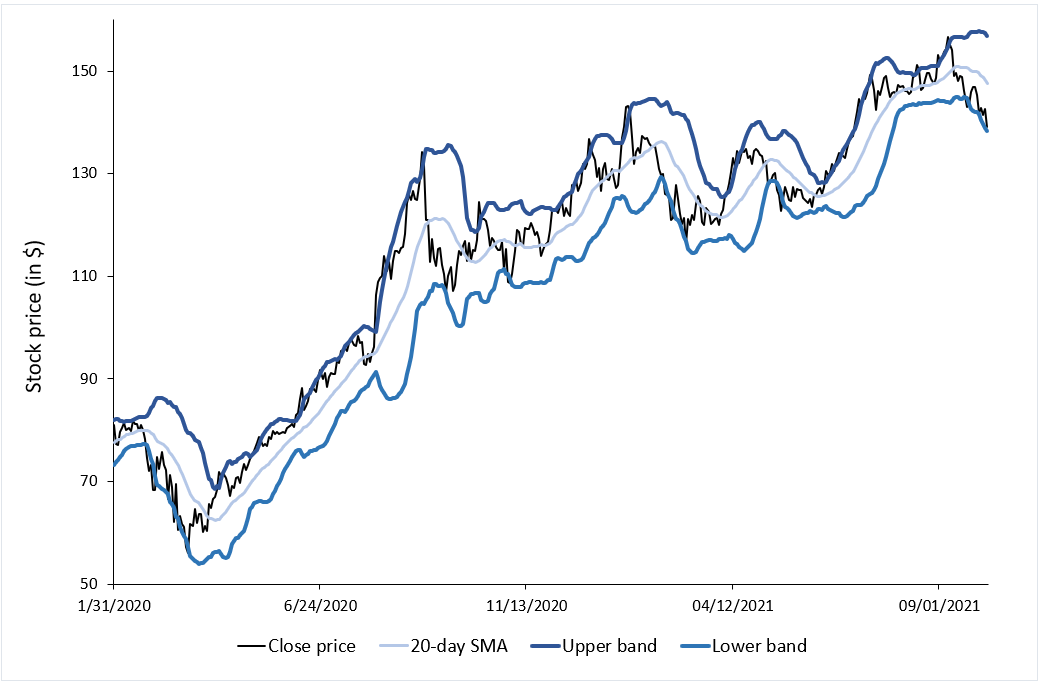
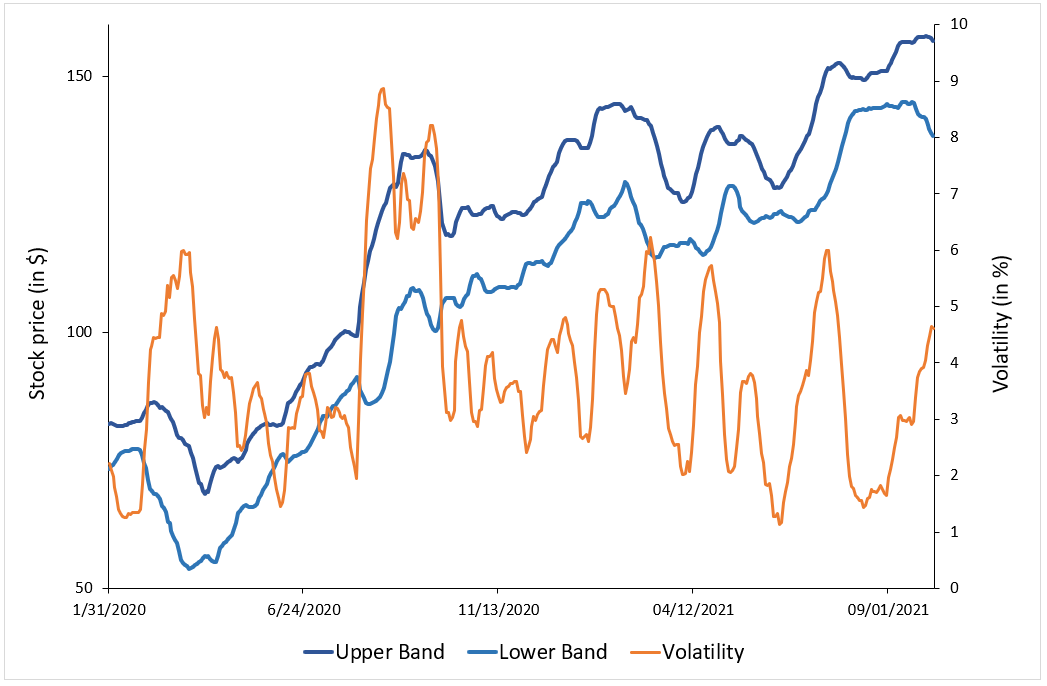
To illustrate the concept of volatility in financial markets, we use a data set of Apple stock prices. At each date, we compute the volatility as the standard deviation of daily stock returns over a rolling window corresponding to the past calendar month (about 22 trading days). This daily volatility is then annualized and expressed as a percentage.
Figure 1. Stock price and volatility of Apple stock.
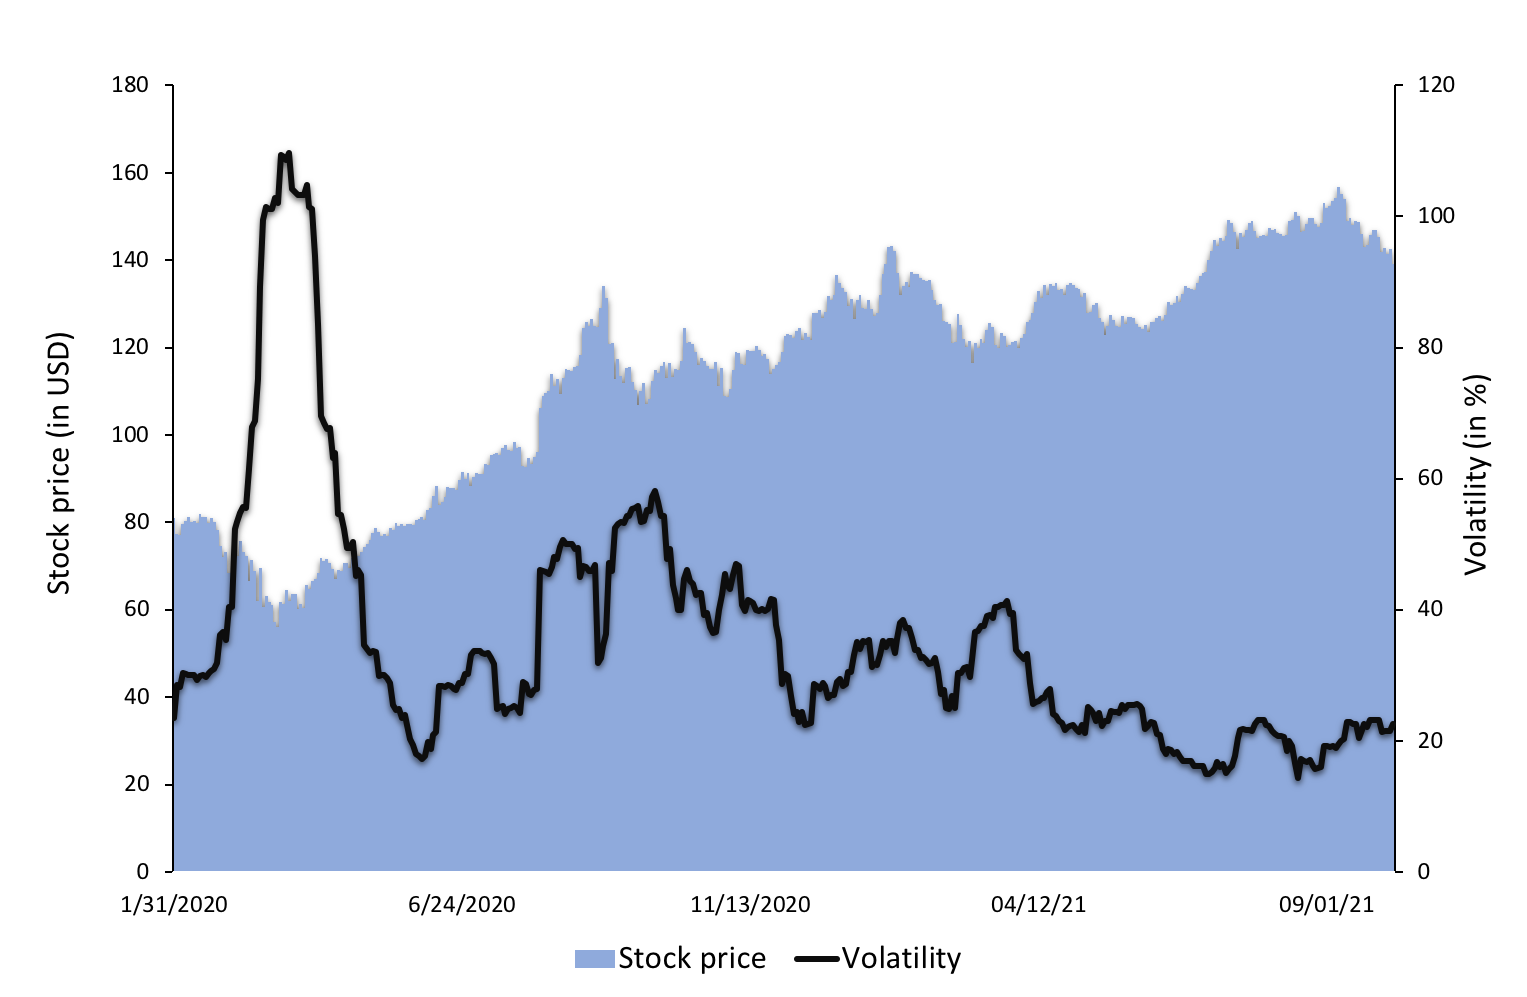
Source: computation by the author (data source: Bloomberg).
You can download below the Excel file for the calculation of the volatility of stock returns. The data used are for Apple for the period 2020-2021.

Related posts on the SimTrade blog
▶ Jayati WALIA Quantitative Risk Management
▶ Jayati WALIA Value at Risk
▶ Jayati WALIA Brownian Motion in Finance
Useful resources
Wikipedia Standard Deviation
About the author
The article was written in November 2021 by Jayati WALIA (ESSEC Business School, Grande Ecole Program – Master in Management, 2019-2022).