In this article, Nithisha CHALLA (ESSEC Business School, Grande Ecole Program – Master in Management (MiM), 2021-2024) This article presents a comprehensive understanding of how gold functions within the global economy and central banking strategies, reflecting historical significance, economic impacts, and future potential.
Introduction
Gold’s value as a reserve asset goes beyond its historical significance; today, central banks use it as a vital economic buffer and tool for financial stability. It has played a strategic role in the financial operations of central banks globally, serving as a hedge against inflation, a tool for reserve diversification, and a reliable store of value. This article explores the complex relationship between gold and central banks, highlighting historical significance, reserve strategies, economic impacts, and recent trends.
Historical Significance of Gold and Central banks
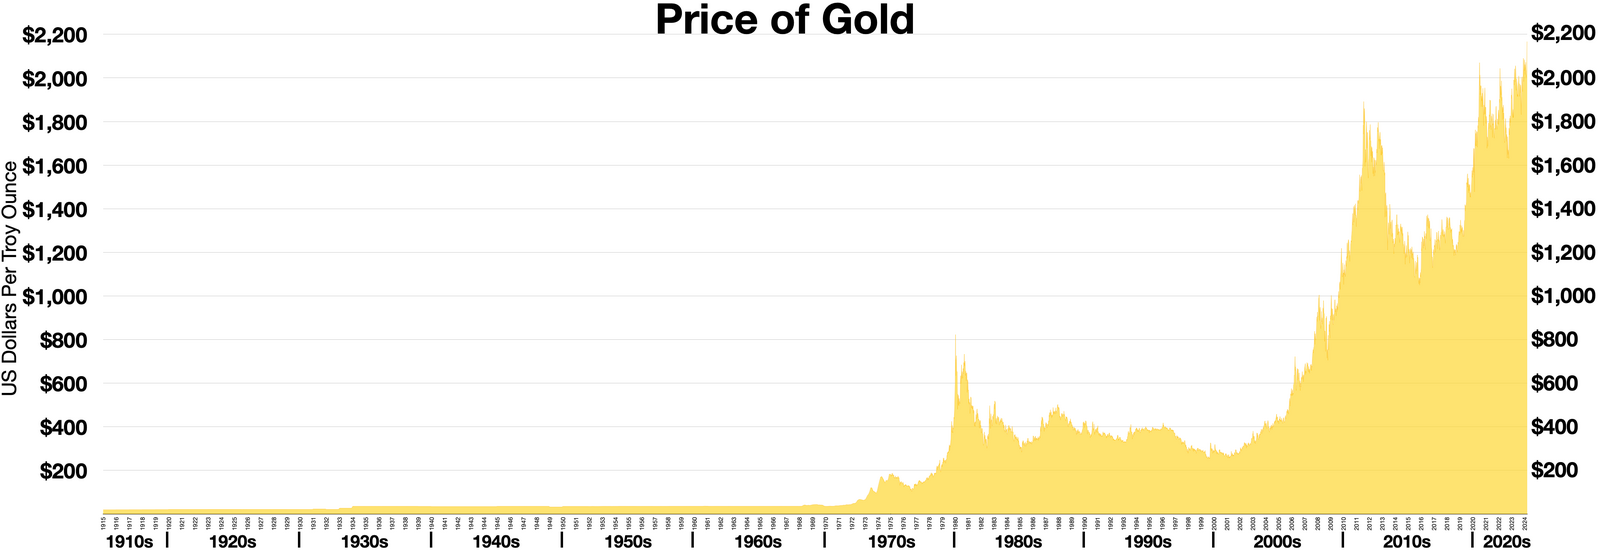
Using gold as a currency dates back thousands of years. For much of modern history, gold was the basis of the world’s monetary system, setting the standard for currency value.
Gold Standard
Until the mid-20th century, most major economies adhered to the gold standard, where each currency unit was pegged to a specific amount. Under the Bretton Woods Agreement (1944-1971), the U.S. dollar was directly convertible to gold, while other currencies were pegged to the dollar. This system solidified gold’s role in global monetary stability. However, the Bretton Woods system ended in 1971, transitioning central banks toward a floating exchange rate system.
Shift to Floating Exchange Rates
Although the gold standard was formally abandoned, gold continued to play a central role in monetary reserves for central banks worldwide, driven by its intrinsic value and historic stability in times of financial crisis.
The below figure shows the Top 10 countries with the highest gold reserves (US$ Million) in the second quarter of 2024.
Top 10 countries with highest gold reserves
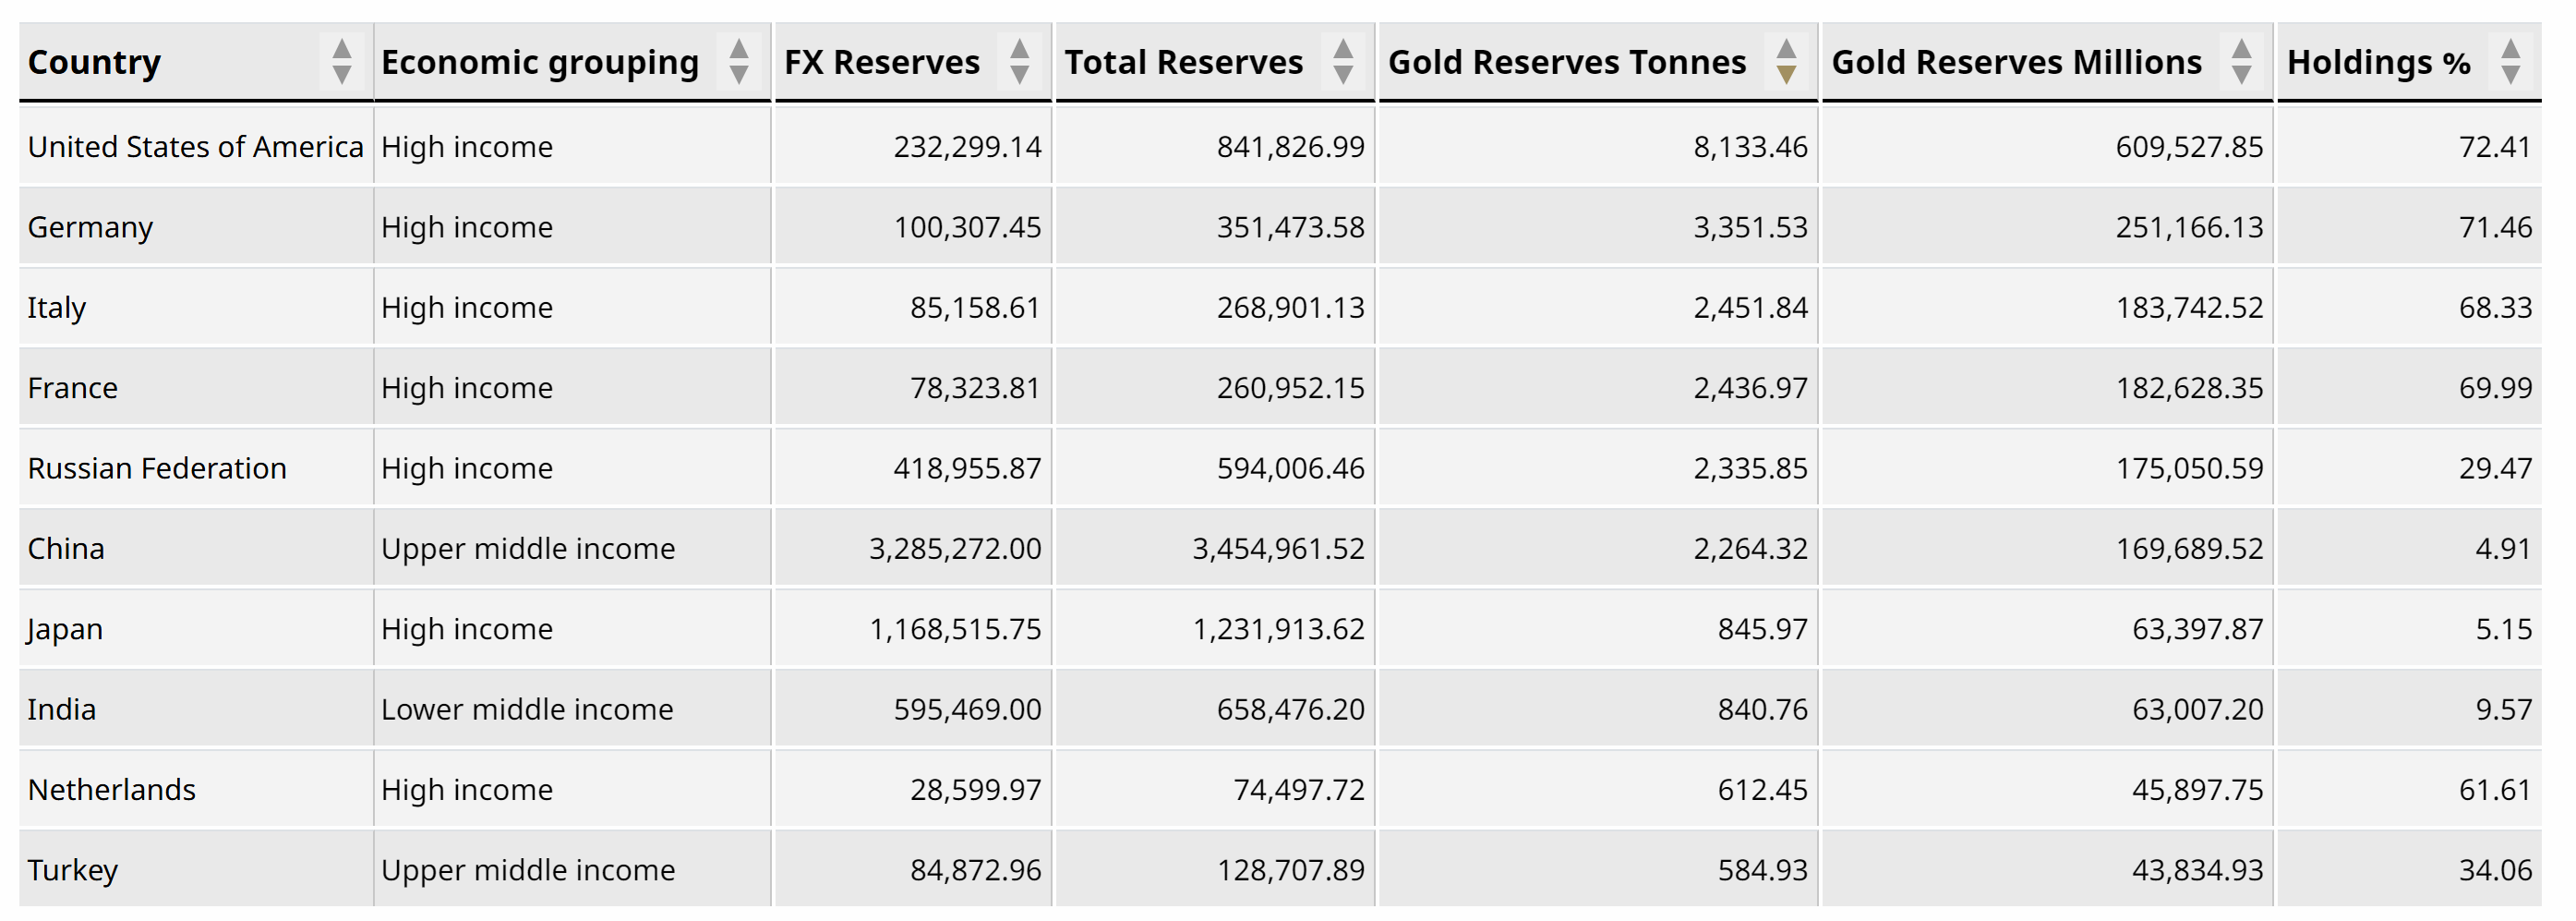
Source: Central Banks, Federal Reserve Bank of St. Louis, International Monetary Fund, World Bank, World Gold Council
Why Central Banks Hold Gold
Gold is a key asset for central banks due to its stability, independence from other economic assets, and ability to hedge against inflation and currency risk.
Diversification of Foreign Reserves
According to the World Gold Council (WGC), central banks hold gold as part of a diversified portfolio that includes foreign currencies, government bonds, and other assets. Gold’s low correlation with other assets helps reduce portfolio risk.
Inflation Hedge and Safe-Haven Asset
Gold’s value often rises in response to inflationary pressures, making it a popular hedge against currency devaluation. For instance, during periods of heightened inflation in the U.S. and Europe, central banks increased their gold reserves to stabilize national reserves.
Global Stability During Crises
Central banks increase gold holdings during geopolitical tensions and economic downturns. For instance, central banks acquired approximately 1,136 metric tons of gold in 2022 alone, marking the largest annual net gold purchases since 1967 (World Gold Council, 2023).
Leading Central Banks and Their Gold Holdings
Many countries prioritize gold in their reserve strategies, with the largest gold holdings concentrated among a few central banks. These top holders collectively hold around 60% of global central bank gold reserves, underscoring gold’s importance among the world’s most prominent economies.
- United States: The U.S. has the largest gold reserves, totaling 8,133.5 metric tons as of 2023 (World Gold Council). The U.S. Federal Reserve’s substantial gold reserves bolster the dollar’s stability, lending it a “safe-haven” currency status.
- Germany: The Deutsche Bundesbank holds around 3,355 metric tons of gold, focusing on economic stability and currency confidence.
- International Reserves: The International Monetary Fund (IMF) holds around 2,814 metric tons of gold, which it maintains as a “safety net” for international economic stability, intervening to support currency values in times of economic crisis.
Emerging Markets and Rising Demand for Gold Reserves
In recent years, emerging economies have increasingly turned to gold to reinforce their economic stability.
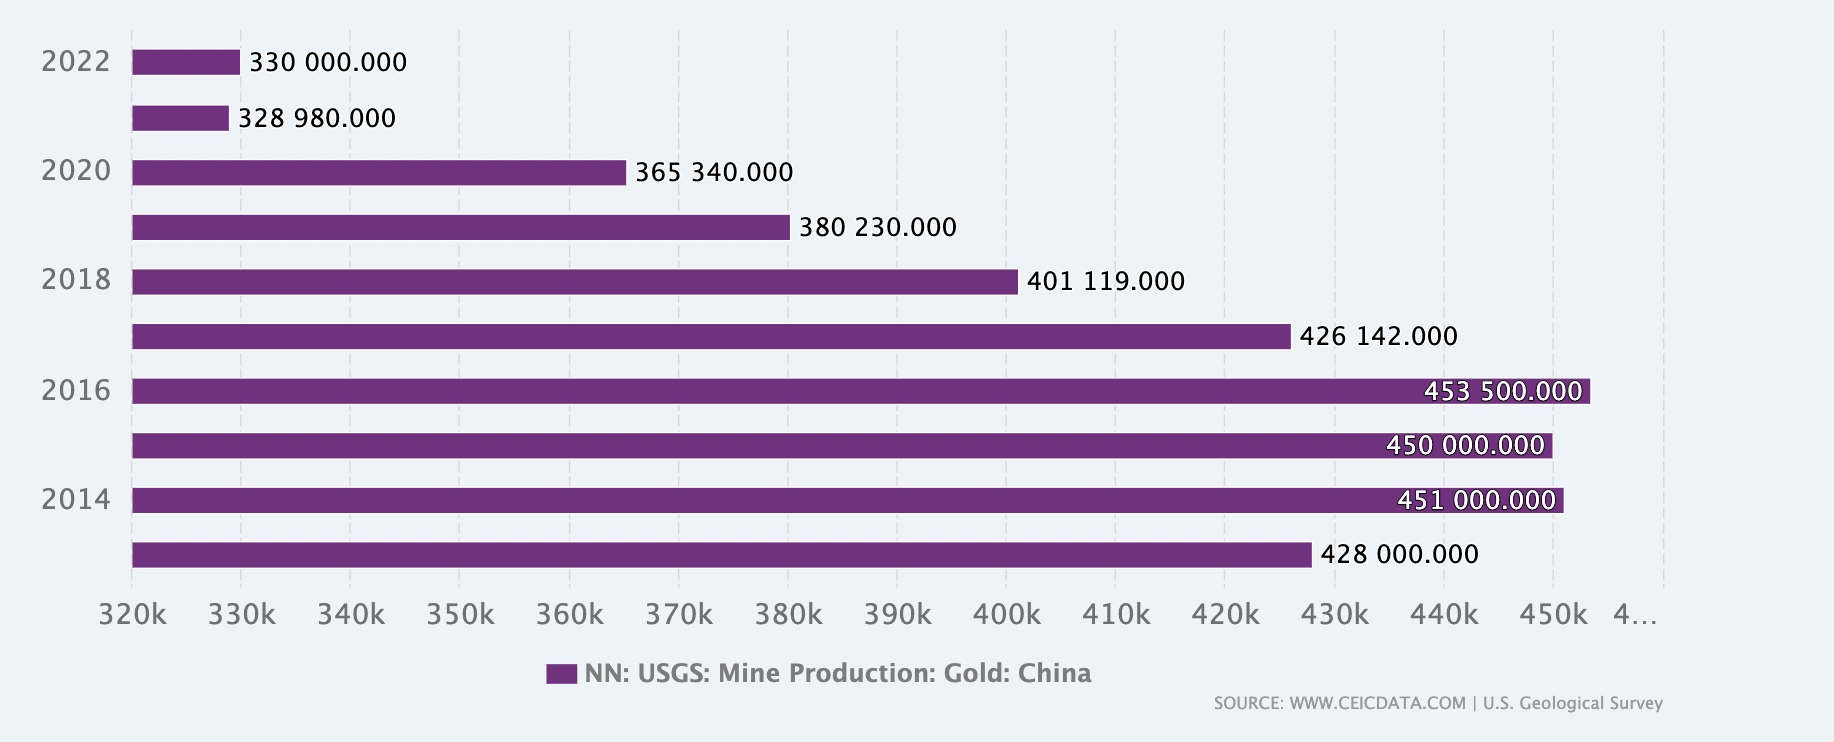
- China: As stated by the People’s Bank of China (PBoC), its gold reserves have rapidly expanded to approximately 2,010 metric tons as of 2023, part of China’s strategy to reduce dependence on the U.S. dollar and enhance the yuan’s position as a global currency.
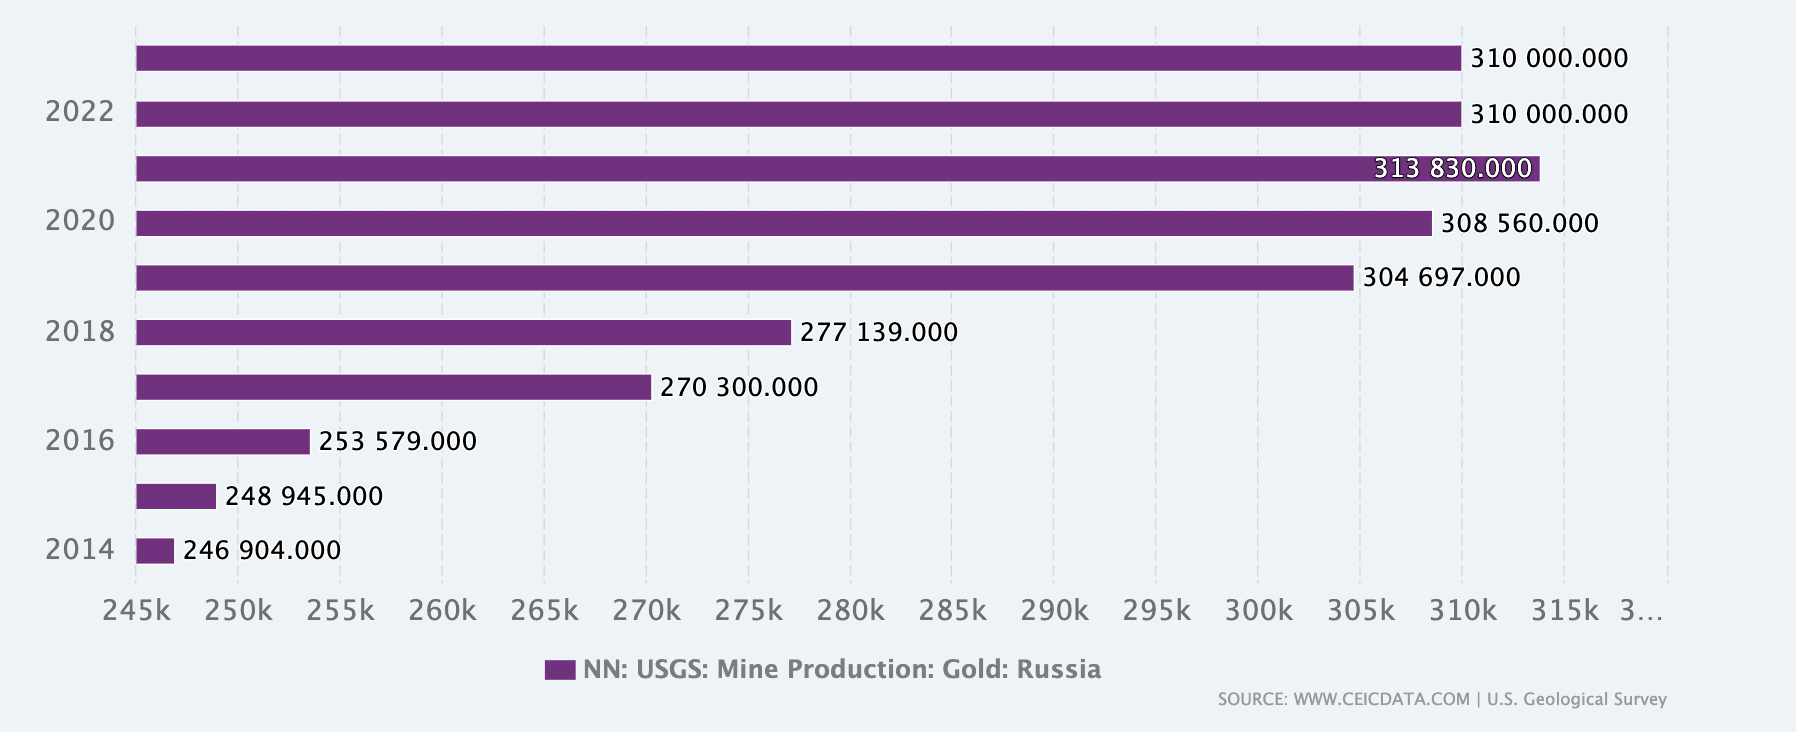
- Russia: The Central Bank of Russia actively grew its gold reserves to over 2,298 metric tons by 2022 (World Gold Council), emphasizing the importance of gold amid geopolitical tensions and economic sanctions.
- India: The Reserve Bank of India (RBI) also expanded its gold holdings, reaching approximately 795 tons in 2023. India uses gold as a hedge against currency volatility, particularly during inflationary cycles, aligning with its long-standing cultural and economic relationship with gold (World Gold Council, 2023).
Economic Impacts of Central Bank Gold Purchases
The actions of central banks significantly influence global gold markets, particularly in times of economic instability.
Price Stability and Market Demand: Central banks collectively account for about 10-20% of annual global gold demand, influencing gold prices and market stability. According to the World Gold Council, central bank purchases accounted for a record-breaking 1,136 metric tons in 2022, pushing global gold prices to multi-year highs.
Strengthening Currency Value: For many emerging markets, holding gold as a reserve asset bolsters currency credibility. Gold reserves help stabilize a nation’s economy by maintaining foreign reserves and serving as a collateralized asset during debt restructuring or financial assistance negotiations.
Inflation Control: Countries with high inflation rates, such as Turkey, have increased their gold reserves to combat domestic inflationary pressures. By 2023, Turkey’s central bank held around 550 tons of gold, partially insulating its economy from severe currency depreciation.
The Future of Gold in Central Bank Reserves
Shift from the Dollar-Centric System
Some central banks, especially in emerging markets, aim to diversify away from the dollar and other Western assets, driven by geopolitical concerns. Gold provides an attractive alternative due to its universal value and liquidity.
Increased Demand for Sustainable Financial Assets
Gold mining and sustainability are increasingly critical issues for central banks. Many central banks, led by European nations, have begun to prioritize sustainably sourced gold for their reserves, aligning with ESG (Environmental, Social, and Governance) commitments.
Potential for Digital Gold Reserves
As digital currencies evolve, some central banks are exploring digital gold or gold-backed digital currencies as potential financial assets. This shift could create new financial instruments, making gold an even more versatile and accessible asset class.
Conclusion
Gold remains a critical element of central bank reserves, valued for its stability, economic security, and inflation-hedging properties. With global gold demand on the rise, central banks are likely to continue viewing gold as an essential reserve asset. As emerging economies strengthen their reserves and geopolitical risks persist, gold’s importance within central banking strategies will only deepen, securing its status as a pillar of global economic stability.
Why should I be interested in this post?
Gold has been a key financial asset for centuries, acting as a store of value, a hedge against inflation, and a safe-haven asset during economic crises. With both developed and emerging economies increasing their gold reserves, understanding its role as a financial cornerstone for central banks helps students grasp fundamental market dynamics and investor behavior, especially during periods of economic uncertainty
Related posts on the SimTrade blog
▶ Nithisha CHALLA History of Gold
▶ Nithisha CHALLA Gold resources in the world
Useful resources
Academic research
Erb, C.B., and C.R. Harvey (2013) The Golden Dilemma. Financial Analysts Journal 69 (4): 10–42.
Erb, C.B., and C.R. Harvey (2024) Is there still a Golden Dilemma. Working paper.
Bogle, John C. (2007). The Little Book of Common Sense Investing. John Wiley & Sons.
Business
World Gold Council (WGC) Gold Demand Trends Full Year 2023
Federal Reserve System What central bank does?
Mining.com (August 7, 2024) China’s PBOC keeps gold buying on hold as prices hit record
International Monetary Fund (IMF) The role of gold
Other
Wikipedia Gold
About the author
The article was written in October 2024 by Nithisha CHALLA (ESSEC Business School, Grande Ecole Program – Master in Management (MiM), 2021-2024).