Hedging of the crude oil price

Youssef_Louraoui

In this article, Youssef Louraoui (Bayes Business School, MSc. Energy, Trade & Finance, 2021-2022) discusses the concept of hedging and its application in the crude oil market.

This article is structured as follow: we introduce the concept of hedging in the first place. Then, we present the mathematical foundation of the Minimum Variance Hedging Ratio (MVHR). We wrap up with an empirical analysis applied to the crude oil market with a conclusion.

Introduction

Hedging is a strategy that considers taking both positions in the physical as well as the futures market to offset market movement and lock-in the price. When an individual or a corporation decides to hedge risk using futures markets, the objective is to take the opposite position to neutralize the risk as far as possible. If the company is long on the physical side (say a producer), they will mitigate the hedging by taking a short exposure in the future market. The opposite is true for a market player who is short physical. He will seek to have a long exposure in the futures market to offset the risk (Hull, 2006).

Short hedge

Selling futures contracts as insurance against an expected decrease in spot prices is known as a short hedge. For instance, an oil producer might sell crude futures or forwards if they anticipate a decline in the price of the commodity.

Long hedge

A long hedge involves purchasing futures as insurance against an increase in price. For instance, an aluminum smelter will purchase electricity futures and forward contracts, allowing the business to secure its electricity needs in the event that the physical market rises in value.

Mathematical foundations

Linear regression model

We can consider the hedge ratio as the slope of the following linear regression representing the relationship between the spot and futures price changes:

doc_SimTrade_MVHR_formula_4

where

  • ∆St the change in the spot price at time t
  • β represents the hedging parameter
  • ∆Ft the change in the futures price at time t

The linear regression model above can also be expressed with returns instead of price changes:

doc_SimTrade_MVHR_formula_5

  • RSpot the return in the spot market at time t
  • RFutures the return in the futures market at time t

Hedge ratio

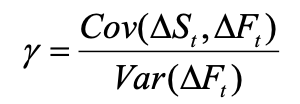
We can derive the following formula for the Minimum Variance Hedging Ratio (MVHR) denoted by the Greek letter beta β:
doc_SimTrade_MVHR_formula_3

where

  • Cov(∆St,∆Ft) the co movement of the change in spot price and futures price at time t
  • Var(∆Ft) represents the variance of the change in price of the future price at time t

The variance and covariance of spot and futures prices are time-varying due to the changing distributional features of these values across time. Accordingly, taking into consideration such dynamics in the variance and covariance term of asset prices is a more acceptable method of establishing the minimal variance hedge ratio. There is a number of different methods that account for the dynamic nature of the minimal variance hedge ratio estimation (Alizadeh, 2022):

  • Simple Rolling OLS
  • Rolling VAR or VECM
  • GARCH models
  • Markov Regime Switching
  • Minimising VaR and CVaR methods

Empirical approach to hedging analysis

Periods

We downloaded ten-year worth of weekly data for the WTI crude oil spot and futures contract from the US Energy Information Administration (EIA) website. We decompose the data into two periods to assess the effectiveness of the different hedging strategies: 1st period from 23rd March 2012 to 24th March 2017 and 2nd period from 31st March 2017 to 22nd March 2022.

First period: March 2012 – March 2017

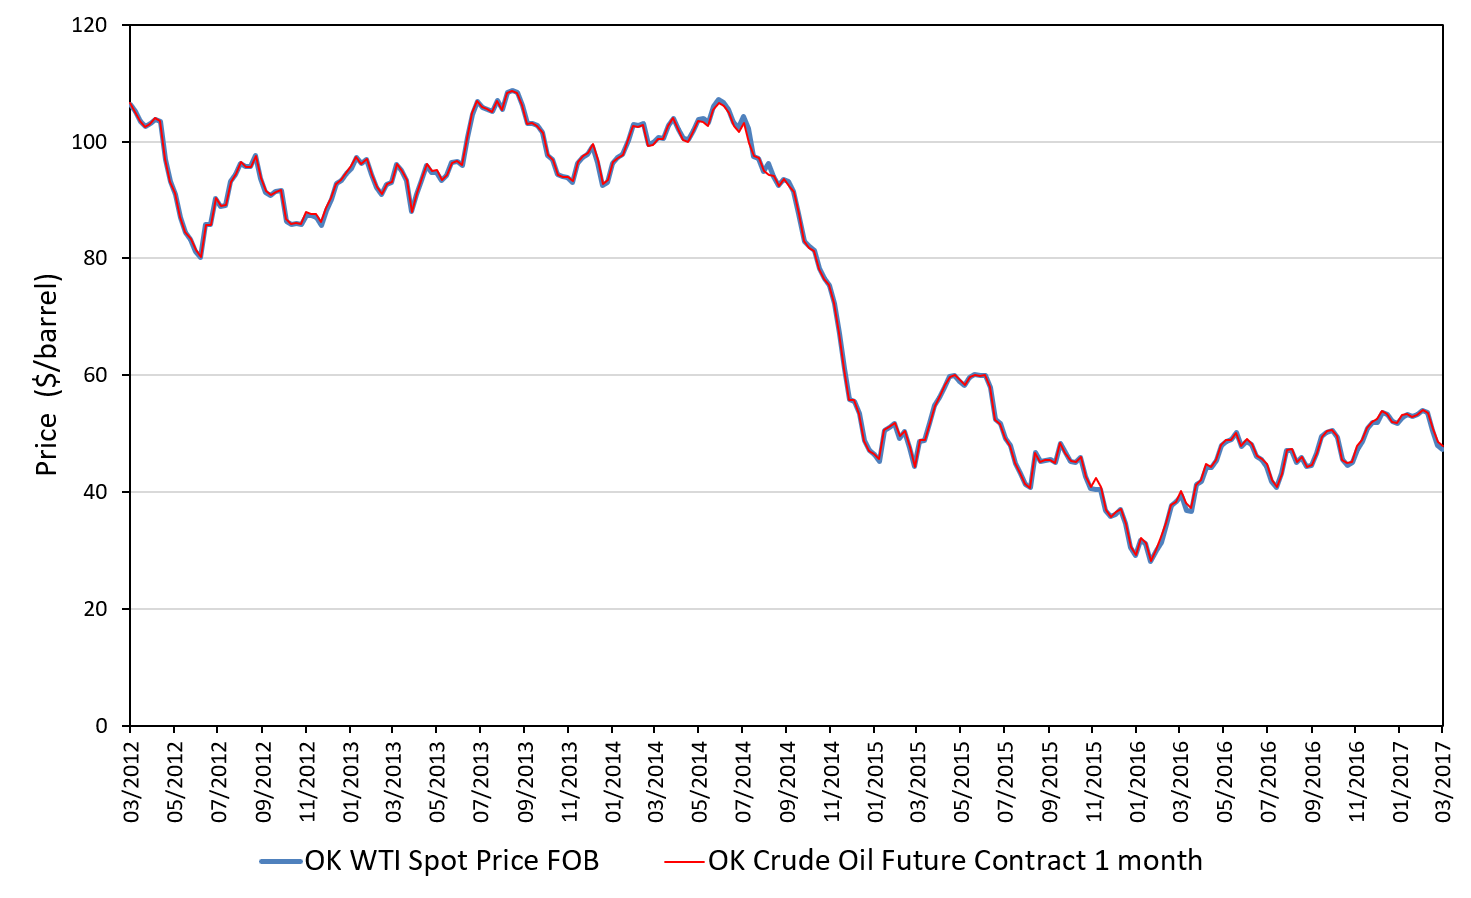
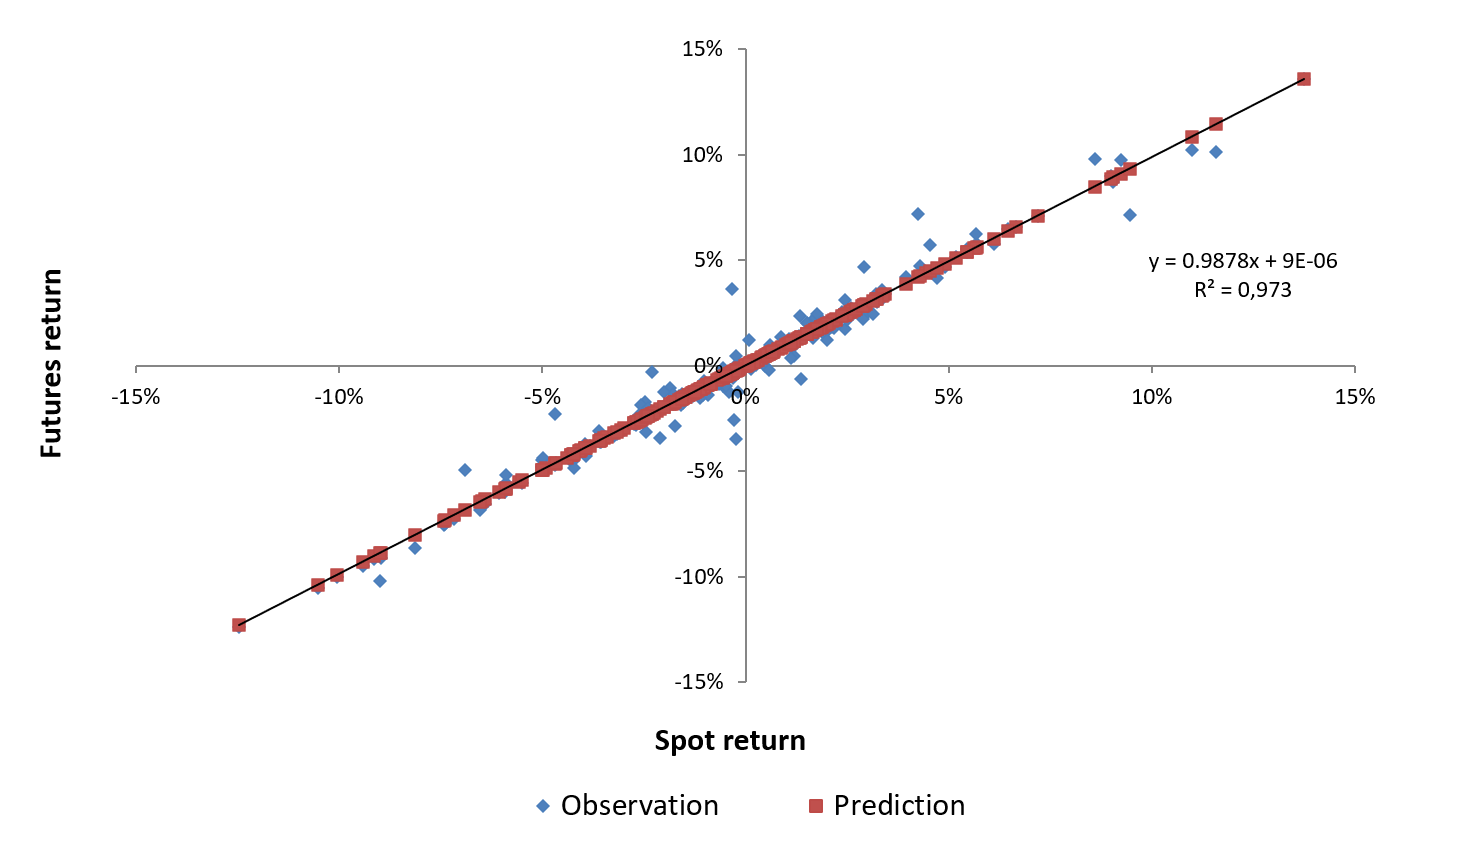
The first five years are used to estimate the Minimum Variance Hedging Ratio (Ederington, 1979). We can approach this question by using the “=slope(known_ys, known_xs)” function in Excel to obtain the gamma coefficient that would represent the MVHR. When computing the slope for the first period of the sample from 23rd March 2012 to 24th March 2017, we get a MVHR equal to 0.985. We obtain a correlation (ρ) using the Excel formula “=correl(array_1, array_2)” highlighting the logarithmic return of WTI spot and futures contract price, which yields 0.986. We can see from the figure 1 how the spot and futures prices converge closely and track each other in a very tight corridor, with very minor divergence. The regression plot between spot and futures contract returns for the first period is shown in Figure 2. This suggests that the hedger should take an opposite position in the futures market equal to 0.985 contract for each spot contract in order to minimise risk when using futures contracts as a hedging tool.

Figure 1. WTI spot and futures (1 month) prices
March 2012 – March 2017
WTI spot and futures prices
Source: computation by the author (data: EIA & Refinitiv Eikon).

Figure 2. Linear regression of WTI spot return on futures (1 month) return
March 2012 – March 2017
Linear regression of WTI spot return on futures (1 month) return
Source: computation by the author (data: EIA & Refinitiv Eikon).

A one-to-one hedge ratio (also known as naïve hedge) means that for every dollar of exposure in the physical market, we take one dollar exposure in the futures market. The effectiveness of this strategy is tied closely to how the spot/futures market correlation behaves. The effectiveness of this strategy would be equal to the correlation of the spot and the futures market prices in the second period.

Second period: March 2017 – March 2022

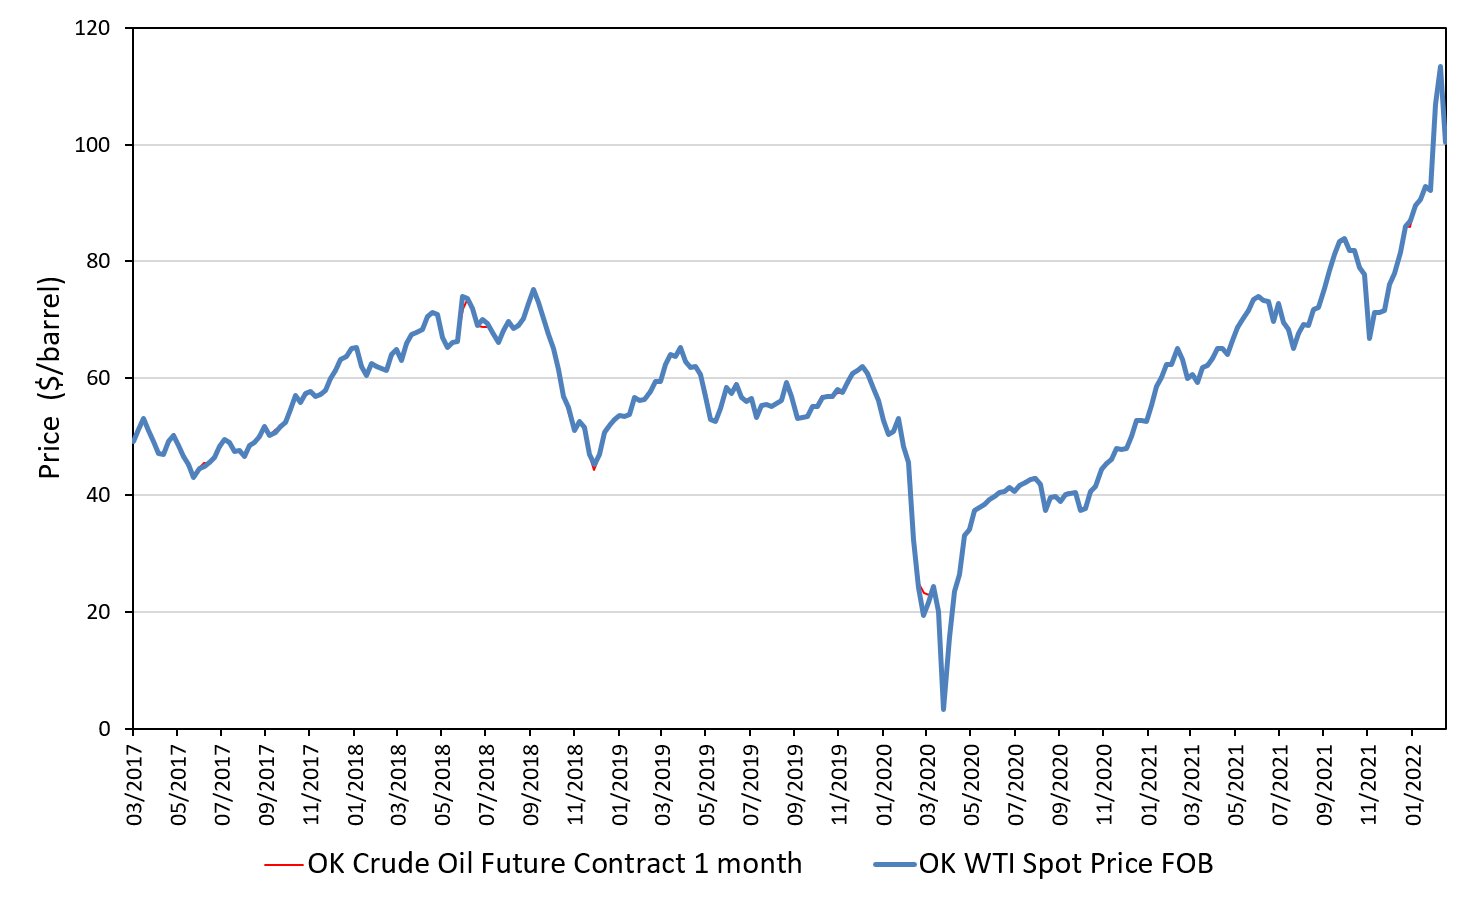
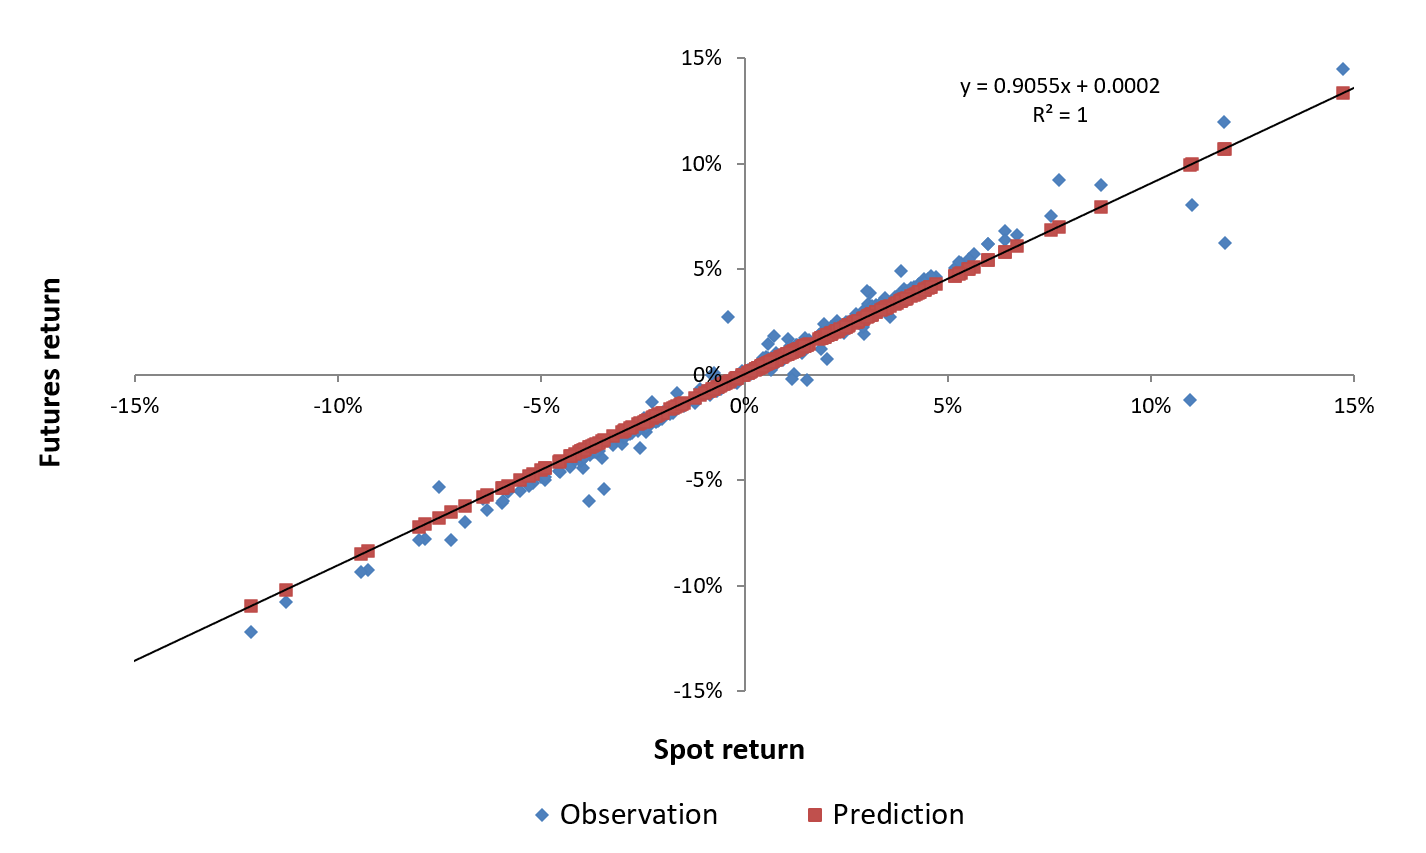
We compute the MVHR for the second period with the same approach retained in the first part by using the “=slope(known_ys, known_xs)” function in Excel to obtain the gamma coefficient that would represent the MVHR. When computing the slope for the first period of the sample from 23rd March 2017 to 24th March 2022, we get a MVHR equal to 1.095. This means that for every spot contract that we own, we need to buy 0.985 futures contracts to hedge our market risk. As previously stated, the same trend can be seen in figure 3, where spot and futures prices converge closely and track each other with just little deviation. Figure 4 represents the regression plot between spot and futures contract returns for the second period. This means that in order to reduce risk to the minimum possible amount when futures contract used as hedging instrument, for each spot contract the hedger should take an opposite position equivalent to 1.05 contract in the futures market.

Figure 3. WTI spot and futures (1 month) prices
March 2017 – March 2022.
WTI spot and futures prices
Source: computation by the author (data: EIA & Refinitiv Eikon).

Figure 4. Linear regression of WTI spot return on futures (1 month) return
March 2017 – March 2022
Linear regression of WTI spot return on futures (1 month) return
Source: computation by the author (data: EIA & Refinitiv Eikon).

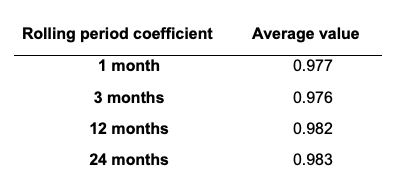
We can approach this hedging exercise in a time-varying framework. Some academics consider that covariance and correlation are not static parameters, so they came up with models to accommodate for the time-varying nature of these two parameters. We can compute the rolling regression as the rolling slope by changing the timeframe to allow for dynamic coefficients. For this example, we computed rolling regression for one month, three-month, one year and two years. We can plot the rolling regression in the graph below (Figure 5). We can average the rolling gammas and obtain an average for each rolling period (Table 1):

Table 1. Table capturing the rolling hedge ratio for WTI across different horizons.
 Hedging strategy
Source: computation by the author (data: EIA & Refinitiv Eikon).

Figure 5. WTI hedge ratio for different rolling window sizes.
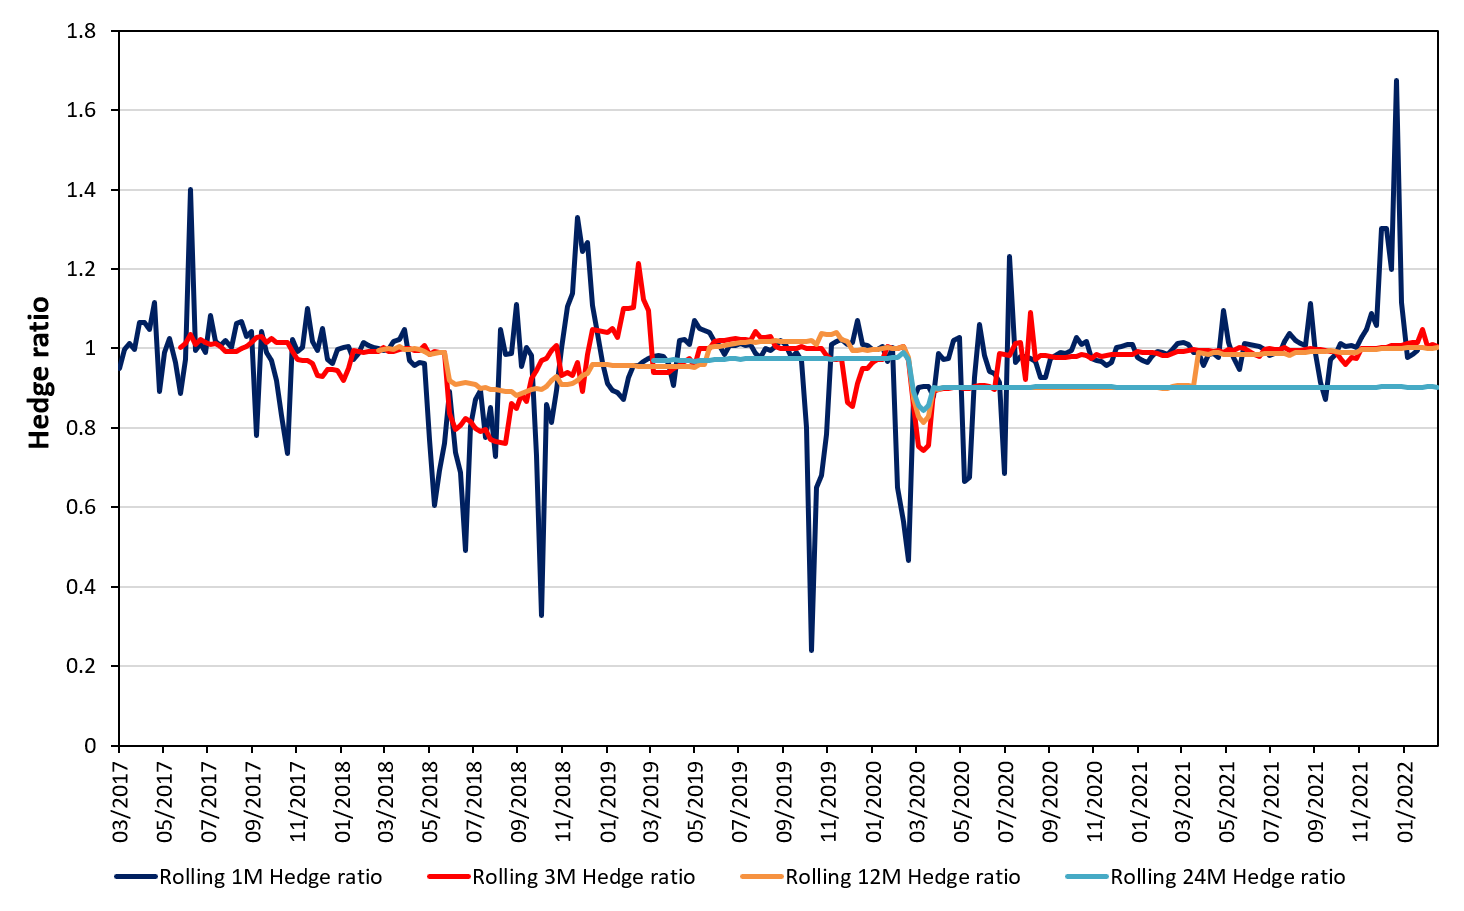
Hedge ratio for WTI for rolling window sizes
Source: computation by the author (data: EIA & Refinitiv Eikon).

Conclusion

In an realistic setting, these results may be oversimplified. In some instances, cross hedging is required to calculate this strategy. This technique is used to hedge an asset’s value by relying on another asset to replicate its behaviour. Let’s use an airline as an example of a corporation seeking to hedge its jet fuel expenditures. As there is currently no jet fuel futures contract, the airline can hedge its basis risk with heating oil (an equivalent product with a valid futures market). As stated previously, the degree of correlation between the spot price and the futures price impacts the precision of cross-hedging (and hedging in general). To get the desired results and avoid instances in which we overhedge or underhedge our exposure, hedging must finally be performed appropriately.

You can find below the Excel spreadsheet that complements the explanations about of this article.

 Hedging strategy on crude oil

Why should I be interested in this post?

Understanding hedging techniques can be a valuable tool to implement to reduce the downside risk of an investment. Implementing a good hedging strategy can help professionals to better monitor and modify their trading strategies based different market environments.

Related posts on the SimTrade blog

   ▶ Youssef LOURAOUI My experience as an Oil Analyst at an oil and energy trading company

   ▶ Youssef LOURAOUI Introduction to Hedge Funds

   ▶ Youssef LOURAOUI Global macro strategy

   ▶ Youssef LOURAOUI Minimum volatility factor

   ▶ Youssef LOURAOUI VIX index

   ▶ Jayati WALIA Black Scholes Merton option pricing model

   ▶ Jayati WALIA Implied volatility

   ▶ Youssef LOURAOUI Portfolio

Useful resources

Academic research

Adler M. and B. Dumas (1984) “Exposure to Currency Risk: Definition and Measurement” Financial Management 13(2) 41-50.

Alizadeh A. (2022) Volatility of energy prices: Estimation and modelling. Oil and Energy Trading module at Bayes Business School. 46-51.

Ederington L.H. (1979). The Hedging Performance of the New Futures Markets. Journal of Finance, 34(1) 157-170.

Hull C.J. (2006). Options, futures and Other Derivatives, sixth edition. Pearson Prentice Hall. 99-373.

Business

US Energy Information Administration (EIA)

About the author

The article was written in January 2023 by Youssef LOURAOUI (Bayes Business School, MSc. Energy, Trade & Finance, 2021-2022).

My experience as an Oil Analyst at an oil and energy trading company

Youssef_Louraoui

In this article, Youssef LOURAOUI (Bayes Business School, MSc. Energy, Trade & Finance, 2021-2022) shares his experience as an oil market analyst during a summer internship at Petroineos Trading Ltd.

About the company

Petroineos is a joint venture between PetroChina International London (PCIL) and the INEOS Group for refining and energy trading. PetroChina is one of the world’s major oil and gas enterprises and the INEOS is a refining and petrochemical group. This joint venture is a young and ambitious firm that was founded in 2011 with a dynamic approach to business and a strong ambition for long-term success.

In Petroineos, there are three sections which handle trading in different products: crude, refined products, and power and emissions. Petroineos’s annual trading volume exceeds 70 million tonnes, with assets worth around $6 billion and trading revenue in excess of $30 billion (Figure 1).

Its strategically positioned refineries in Grangemouth (Scotland) and Lavera (France), is among the oldest crude oil refineries in Europe. It provides gasoline to both domestic (Scotland and
France) and international markets, while also sustaining local economies. Every year, the two refineries process about 360,000 barrels of crude oil per day and create over 16 million tonnes of oil products.

Figure 1. Petroineos Trading Ltd. key numbers.
 Petroineos Trading Ltd. numbers
Source: Petroineos Trading Ltd. (2022)

My internship

I was affected along with seven other interns, each with their own specific project that had to be completed throughout the 12-week internship. The first days were intense because we had to deal with jargon, practitioners’ concepts, and the dynamic nature of the trading floor. Fortunately, I had the opportunity to be supervised by a seasoned analyst during the first month of the internship, which allowed me step up my skills and be up and running for the next two months. There was a healthy mix of autonomous work and fruitful discussions with the other colleagues. This forced me to be independent in my job while also working in groups when required, allowing for some flexibility in how I performed.

The highlight of this internship was the relationships created with my fellow interns. It really helped a lot to make this experience so enjoyable. The teamwork, the feedbacks, the help that was offered among interns was really amazing; it created a strong bond inside and outside the office. It was a blessing to meet and learn from them as they are all well accomplished individuals who have a bright future in front of them.

By the end of my internship, I felt that I improved significantly in terms of notions regarding crude oil market, time management, relationships with my colleagues and good memories overall.

Missions

During this internship, I was assigned to the analysis department, which was in charge of providing reports and market updates for the major commodity markets. I did my internship in extraordinary times for the oil and commodity markets as it was a few months after the beginning of the Ukrainian-Russian conflict. At that time, the world was experiencing a global energy crisis, a shock of extraordinary scope and complexity. This crisis reminded us of the events of the 1970s (Oil shocks 73-79). This crisis had many dimensions, including coal, oil, gas, food security, and climate change. Governments around the world are seeking for an equilibrium that would deliver a good energy mix while retaining affordable and secure resources for their people, not only reducing reliance on a single commodity.

Natural gas spot prices had reached unprecedented highs, the equivalent of USD 250 for a barrel of oil. Furthermore, the crisis had fueled inflationary pressures and raised the prospect of a recession, as well as a massive USD 2 trillion windfall for fossil fuel producers above their 2021 net revenue. In response to energy shortages and high costs, governments have invested well over USD 500 billion, primarily in industrialized nations, to protect consumers from the immediate consequences of inflation (especially in gas and oil).

Keeping this in mind, I was assigned coverage on the impact of Western sanctions on the Russian crude oil market. Every market participant seeked to predict the impact of the sanctions on the number of barrels shipped from Russia.

  • Is Russia going to reduce its crude oil export since Europe represented alone more than 80% of its exports volume before the war?
  • Who are the new market players that are profiting from this situation and capitalizing on a discounted Russian crude oil in the international crude oil market?
  • Are there any patterns that can help in better understanding the crude flows?

Those three questions captured the importance of the analysis that had to be conducted in order to give sound and well detailed answers in order to capitalize with trading strategies that could leverage this information.

The main task was the redaction of the report which was shared across the whole company. The basic idea of this report was to give a micro overview on a weekly basis on the main changes that can impact the Urals market. I was in charge of analysing the vessels movement from the main ports in Russia and capture their discharging patterns in order to extract valuable information into the main discharging regions that are profiting from this market.

I also collaborated on other analyses with another intern from the Data Science department, which involved analyzing alternative data to identify any interesting signals that may be used as a trading strategy. In addition, I shared two further quantitative analyses involving econometric relationships to analyze Russian and global oil demand in analysis to other factors of relevance. The projects were incredibly interesting, and the insights were also helpful in understanding the complexities of collecting insights in an environment where analysts are surrounded by noisy data that must be filtered in order to communicate valuable information.

The main conclusions of the Russian coverage:

India and China as the main actors profiting from the discounted price of Urals

Russia becomes the highest exporter of crude oil to India (Urals crude). The pattern change since the war unfolded. Historically, India imported oil from Irak and Saudi Arabia. This interest is based on the decision by the Asian countries to capitalise on a devaluated Russian oil price in the international crude oil market, which reached at some point of the war 30$/bbl difference with the main international oil benchmark (Brent). According to the Indian energy minister, they want to lock in the best price available in the international crude oil market (Figure 1).

According to US treasury Janet Yellen, this trend will continue, profiting from the western price cap on russian crude oil. G7 countries agreed in September to implement the price cap, which the US government hopes will be in place by December 5 when an EU embargo on the shipment of Russian crude comes into force. Under the mechanism, European companies will be permitted to transport and insure shipments of Russian oil to third countries as long as it is sold below a fixed price — an effort to limit the impact of the sanctions on global oil flows but ensure Russia’s earns less from the trade.

Dislocation of the market between Europe and Asia

Europe decreased importantly its dependence from Russian crude oil after the war in Ukraine. There is a shifting of actors in this market, with Asia skyrocketing demand compared to previous years because of the attractivity of the Urals in the international crude oil market. Also, if we shrink oil price volatility to its components, we see that:

  • External factors, other than supply and demand, play a more important role now specifically policy issues are more important than ever, accounting for more than 25% of oil volatility
  • 20 years ago we could explain 90% of oil volatility by supply and demand, now this rate dropped to 65%.

Required skills

I would mention two main skills: market understanding and programming expertise. It is very beneficial to stay on top of market news, as it is good industry practice (especially for an analyst position) to understand the many market events that affect the specific commodity covered. As most businesses strive for automation, acquiring and mastering a programming language can only benefit future analysts. It has become a wider pre-requirement for most analyst positions.

Key learning

Key numbers

Some key numbers to have in mind to understand the crude oil market:

  • Estimation according to a reliable source: 1.43 trillion barrels left in the ground (2022)
  • Estimated part of oil consumption in most developed economies (around 30-45% of crude oil in the energy mix)
  • Estimated daily production per day in the world: around 100mb/d
  • Russia produce approximately 10% of the world daily crude oil demand. Urals production (the most traded grade of crude in the Russian oil market) was fluctuating on average around the 2mb/d threshold

Refinery margins

Refinery margin is derived from the difference between the refinery cost (buying crude) and the profit (selling refined product).

Refinery margin and crack spread

Crack spread represents the differential between the price of crude oil and the price of products refined. It is an industry specific metric to assess refining profitability. Crack refers also to the chemical process of decomposing the crude oil into different petroleum products. As different variables affect the price of crude oil and its refined products, this has an implication for refining margins.

Implementation of a crack strategy

  • Single product crack: Differential of one barrel of crude with one barrel of refined product
  • Multi product crack: Use of different refined products to secure a margin

Trading the crack spread

  • Either long or short crack: If long crack, confident view that refinery margins will strengthen (either crude oil price decreasing or products demand increasing)
  • If short crack, confident view that refinery margins are worsening, either because crude oil price increase or decrease of products demand

Reading crack spread as market signal

  • If crack widens, refined products more expensive than crude oil price, market expects that crude oil price will increase (to tighten back the spread to historical norm)
  • If crack tightens, refined products are sold cheaper than the price of crude oil, market expects that refined products (will reduce production) in order to get more expensive to widen the spread

Why should I be interested in this post?

This post will help any student looking to break into the work of oil or energy trading, but more generally for any analyst position, to have a grasp of the main concepts and skills that are required in the market and have a better understanding of the energy industry.

Related posts on the SimTrade blog

   ▶ All posts about Professional experiences

   ▶ Youssef LOURAOUI My experience as a portfolio manager in a central bank

   ▶ Aastha DAS My experience during a summer internship as an investment banking analyst at G2 Capital Advisors

   ▶ Aamey MEHTA My experience as a credit analyst at Wells Fargo

Useful resources

Business Analysis

Petroineos

Financial Times (2022) Russia becomes India’s top oil supplier as sanctions deflate price.

About the author

The article was written in December 2022 by Youssef LOURAOUI (Bayes Business School, MSc. Energy, Trade & Finance, 2021-2022).