

In this article, Alexandre LANGEVIN (ESSEC Business School, Global Bachelor in Business Administration (BBA), 2022-2026) explains the Shiller P/E ratio, also known as the CAPE ratio: a valuation tool that adjusts for the business cycle to give a more reliable picture of whether equity markets are cheap or expensive.
Introduction
Every investor knows the price-to-earnings (P/E) ratio: divide the current market price by earnings per share and you get a simple measure of how much the market is paying for each dollar of profit. It is one of the most widely quoted metrics in equity analysis. But it has a structural flaw: earnings are cyclical. In a recession, they collapse, making the P/E look artificially inflated even when prices have barely moved. In a boom, they surge, making markets appear cheap when they may not be. A single year of earnings is a poor basis for a long-term valuation judgment.
Robert Shiller, a Yale professor and 2013 Nobel laureate in economics, proposed a simple fix. His ratio replaces one year of earnings with the average of the past ten years, adjusted for inflation. The result is a smoother, more stable measure of valuation that filters out the noise of the business cycle and allows for meaningful comparisons across time.
The Problem with Standard P/E
Consider the S&P 500 in 2009, shortly after the financial crisis. Prices had fallen sharply, but earnings had fallen even further, with many companies reporting losses. Standard P/E spiked above 100 at certain points, not because markets were expensive, but because the denominator had collapsed. An investor reading that number at face value might have concluded the market was dangerously overvalued, when it was near a generational buying opportunity.
The opposite problem occurs at cycle peaks. Strong earnings in boom years compress P/E ratios, making markets look reasonable just before a downturn. Standard P/E captures both price and the cyclical position of earnings simultaneously, making it hard to separate valuation from timing.
The CAPE Ratio: Construction and Formula
Shiller’s solution is to replace single-year earnings with the average of real earnings over the previous ten years. A ten-year window spans a full business cycle, smoothing out both recessions and booms. The formula is:
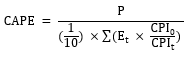
where P is the current market price, Et are reported earnings in year t, CPI0 is the current price index, and CPIt is the price index in year t. The inflation adjustment ensures that past earnings are expressed in today’s dollars, making them directly comparable to recent figures.
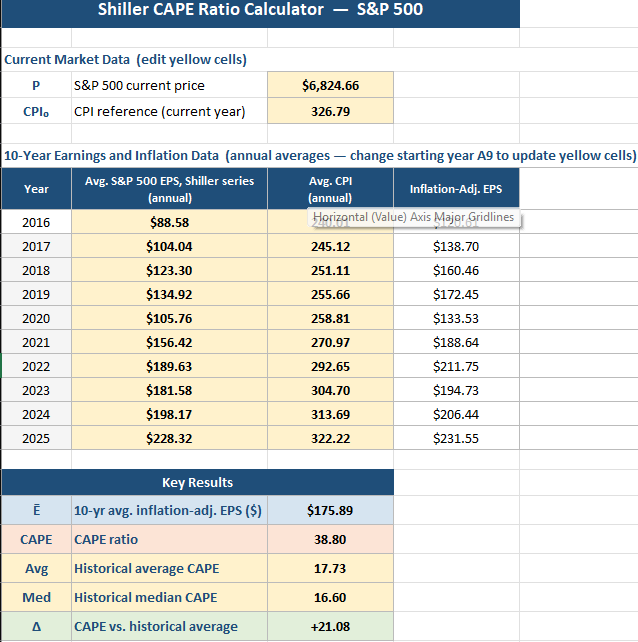
In the Excel model, each annual earnings figure is the average of the 12 monthly observations in Shiller’s dataset. Shiller himself constructs monthly earnings by interpolating S&P four-quarter totals, so the monthly series is a smooth continuous estimate rather than actual reported monthly results. The current S&P 500 price used is the April 9, 2026 closing price of $6,824.66, sourced from Yahoo Finance. The CPI reference is the February 2026 release from the U.S. Bureau of Labor Statistics.
Historical Record and Market Signals
Shiller’s dataset goes back to 1871, giving the ratio an exceptionally long historical record. The average CAPE over that full period is approximately 17.7 and the median around 16.6. These serve as rough benchmarks: readings significantly above the average suggest the market is expensive relative to long-run earnings capacity, while readings well below suggest the opposite.
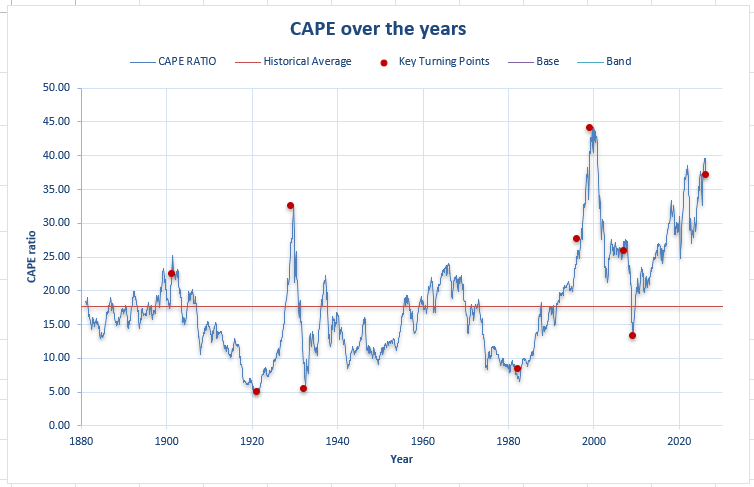
The ratio’s most cited applications came before two of the largest crashes of the modern era. In December 1999, at the peak of the dot-com bubble, the S&P 500 CAPE reached 44.2, more than double its historical average. Shiller published Irrational Exuberance that same year, arguing on the basis of CAPE that US equities were severely overvalued. The S&P 500 subsequently fell by nearly 50% over the following two years. In August 2007, CAPE rose above 26 before the financial crisis and another major decline.
At the other extreme, CAPE dropped to around 8.5 in August 1982, one of its lowest post-war readings, preceding one of the strongest bull markets in US history. As of April 9, 2026, our model gives a CAPE of approximately 38.8, well above the historical average.
Figure 1. CAPE ratio at key historical market turning points (S&P 500, selected monthly readings). Source: Robert J. Shiller, econ.yale.edu; computation by the author.
Source: computation by the author.
Excel Model
The Excel model below computes the CAPE ratio from Shiller’s raw data. It contains four sheets: a source data sheet copied directly from Shiller’s dataset, a CAPE Calculator that pulls ten-year annual averages and applies the inflation adjustment, a Historical Context sheet with key turning points, and a Read Me. The starting year of the ten-year window is adjustable, and the model updates automatically when price or CPI inputs are changed.
Figure 2. CAPE Calculator: ten-year window of inflation-adjusted earnings and resulting CAPE ratio.
Source: computation by the author.

Interpretation and Limitations
What CAPE tells you. Shiller’s own research found a strong negative relationship between starting CAPE and subsequent 10-year real returns for the S&P 500: high CAPE tends to precede lower decade-long returns, and low CAPE tends to precede higher ones. The relationship is not mechanical and does not predict timing, but it is one of the more robust long-run return predictors in the academic literature.
The interest rate objection. The most common criticism is that CAPE ignores the level of interest rates. When rates are structurally low, investors rationally accept higher valuations because the alternatives offer little return. Some analysts argue that elevated CAPE readings since 2010 partly reflect lower rates rather than pure overvaluation. This debate is unresolved.
Accounting changes. Reporting standards for earnings have evolved significantly since the 1870s, particularly around goodwill and write-offs. Some researchers argue that modern reported earnings are not strictly comparable to historical figures, making century-long CAPE comparisons imperfect.
Not a timing tool. Investors who sold equities in 1996 because CAPE was already above its long-run average missed four more years of exceptional gains before the dot-com peak. CAPE is a signal about long-run expected returns, not a predictor of short-term price moves.
Why should I be interested in this post?
Valuation metrics appear in equity research, asset allocation decisions at investment managers, and macro discussions at private banks. The CAPE ratio is referenced in strategy notes, central bank research, and academic papers on return predictability. Understanding what it measures, how it is built, and what its limits are is practical knowledge for anyone working in equities or asset management — and one of the cleaner examples of how academic research translates directly into a practitioner tool.
Related posts on the SimTrade blog
▶ Hadrien PUCHE “The stock market is filled with individuals who know the price of everything, but the value of nothing.” – Philip Fisher
▶ Jorge KARAM DIB Multiples valuation method for stocks
▶ Bijal GANDHI Earnings per share
▶ All posts about Financial techniques
Useful resources
Academic research
Campbell, J.Y. and Shiller, R.J. (1988) Stock Prices, Earnings, and Expected Dividends, Journal of Finance, 43(3), 661-676. Available at scholar.harvard.edu.
Bunn, O. and Shiller, R.J. (2014) Changing Times, Changing Values: A Historical Analysis of Sectors within the US Stock Market 1872-2013, NBER Working Paper No. 20370. Available at nber.org.
Data sources
Shiller, R.J. Online Data, Yale University. S&P 500 price, earnings, CPI, and CAPE data from 1871 to present.
S&P 500 current price: Yahoo Finance.
CPI reference: U.S. Bureau of Labor Statistics, Consumer Price Index release.
SimTrade
SimTrade Courses
About the author
The article was written in April 2026 by Alexandre LANGEVIN (ESSEC Business School, Global Bachelor in Business Administration (BBA), 2022-2026).
▶ Discover all articles by Alexandre LANGEVIN.