

In this article, Anant JAIN (ESSEC Business School, Grande Ecole – Master in Management, 2019-2022) explain the debt ratio and its importance in firm valuation.
Introduction
In financial analysis, calculating and even evaluating a company’s debt ratio is essential for assessing its financial stability and valuation. The debt ratio provides insights into how a company finances its assets—through debt or equity—and reveals critical information about its risk profile. This article explores the debt ratio in detail, including real-life examples, and discusses its implications for company valuation.
Defining Debt Ratio
The debt ratio is a financial metric that represents the proportion of a company’s assets that are financed by debt.
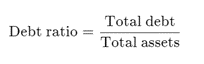
- Total Debt: This includes all short-term and long-term debt/liabilities. Short-term debt includes financial commitments due within one year, such as accounts payable, commercial paper and short-term loans. Long-term debt consists of liabilities such as bank loans and bonds with repayment periods extending beyond one year.
- Total Assets: This includes all resources owned by the company, such as cash, inventory, property, and equipment.
Sometimes, the debt will include financial debt only (accounts payable being include to the working capital).
Understanding Debt Ratio Values
High Debt Ratio
A high debt ratio indicates that a large portion of a company’s assets is financed through debt. For instance, a debt ratio of 0.70 means that 70% of the company’s assets are debt-financed. High leverage can heighten financial risk, as the probability to repay the capital of the loan and interest is higher, and then the probability of bankruptcy is higher. During economic downturns or revenue drops, companies with high debt ratios might face challenges in maintaining financial stability and avoiding default.
Low Debt Ratio
A low debt ratio suggests that the company relies more on equity financing. For instance, debt ratio of 0.3 implies that 30% of the assets are financed by debt. While this indicates lower financial risk and greater stability, it may also suggest that the company is conservative in leveraging debt (to minimize the cost of bankruptcy).
Implications for Company Valuation
Risk Assessment
The debt ratio can be a valuable metric to assess a company’s risk level. High leverage increases financial risk, which can affect the company’s stock price and valuation. Investors often seek higher returns to compensate for higher risk, potentially leading to a lower stock price if the company is perceived as too risky. This issue has been extensively studied in the academic literature (see the seminal works of Modigliani and Miller (1958 and 1963).
Cost of Capital
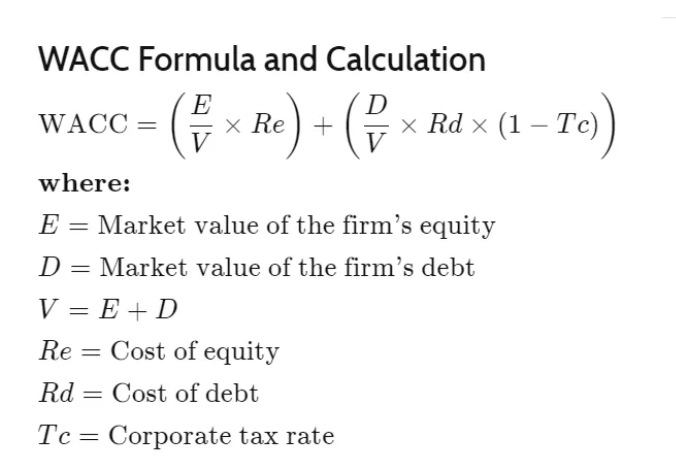
WACC (weighted average cost of capital) is the average rate that a business pays to finance its assets. The debt ratio affects a company’s WACC. A higher proportion of debt can reduce the WACC due to the tax benefits associated with interest payments. Lower WACC can increase the company’s valuation by increasing the present value of future cash flows. However, excessive debt might raise the cost of equity as investors demand higher returns to offset increased risk, which could diminish the benefits of a lower WACC.
Figure 2. Calculation Of WACC.
Creditworthiness and Borrowing Capacity
The debt ratio impacts a company’s credit rating and borrowing ability. High debt levels can lead to lower credit ratings, resulting in higher borrowing costs and reduced financial flexibility. This can negatively affect the company’s valuation due to increased financial costs and operational constraints.
Growth Potential
Companies with manageable debt levels may be better positioned to pursue growth opportunities. Effective use of debt can enable investments in expansion, technology, and acquisitions. A moderate debt ratio can suggest that the company is leveraging debt effectively to drive growth without overextending itself. This positive outlook can boost investor confidence and increase the company’s valuation.
Industry Context
Debt ratios should be assessed within the context of industry standards. Different industries have varying norms for acceptable debt levels based on capital requirements, revenue stability, and growth potential. For example:
- Capital-Intensive Industries: Sectors such as utilities, telecommunications, and manufacturing often have higher debt ratios due to substantial capital needs for infrastructure and equipment. In these industries, higher leverage is often necessary and accepted.
- Service and Technology Industries: Companies in service and technology sectors typically have lower capital requirements and may operate with lower debt ratios. High debt levels in these industries could signal potential financial risk or overextension.
Real-Life Examples
Tesla, Inc.
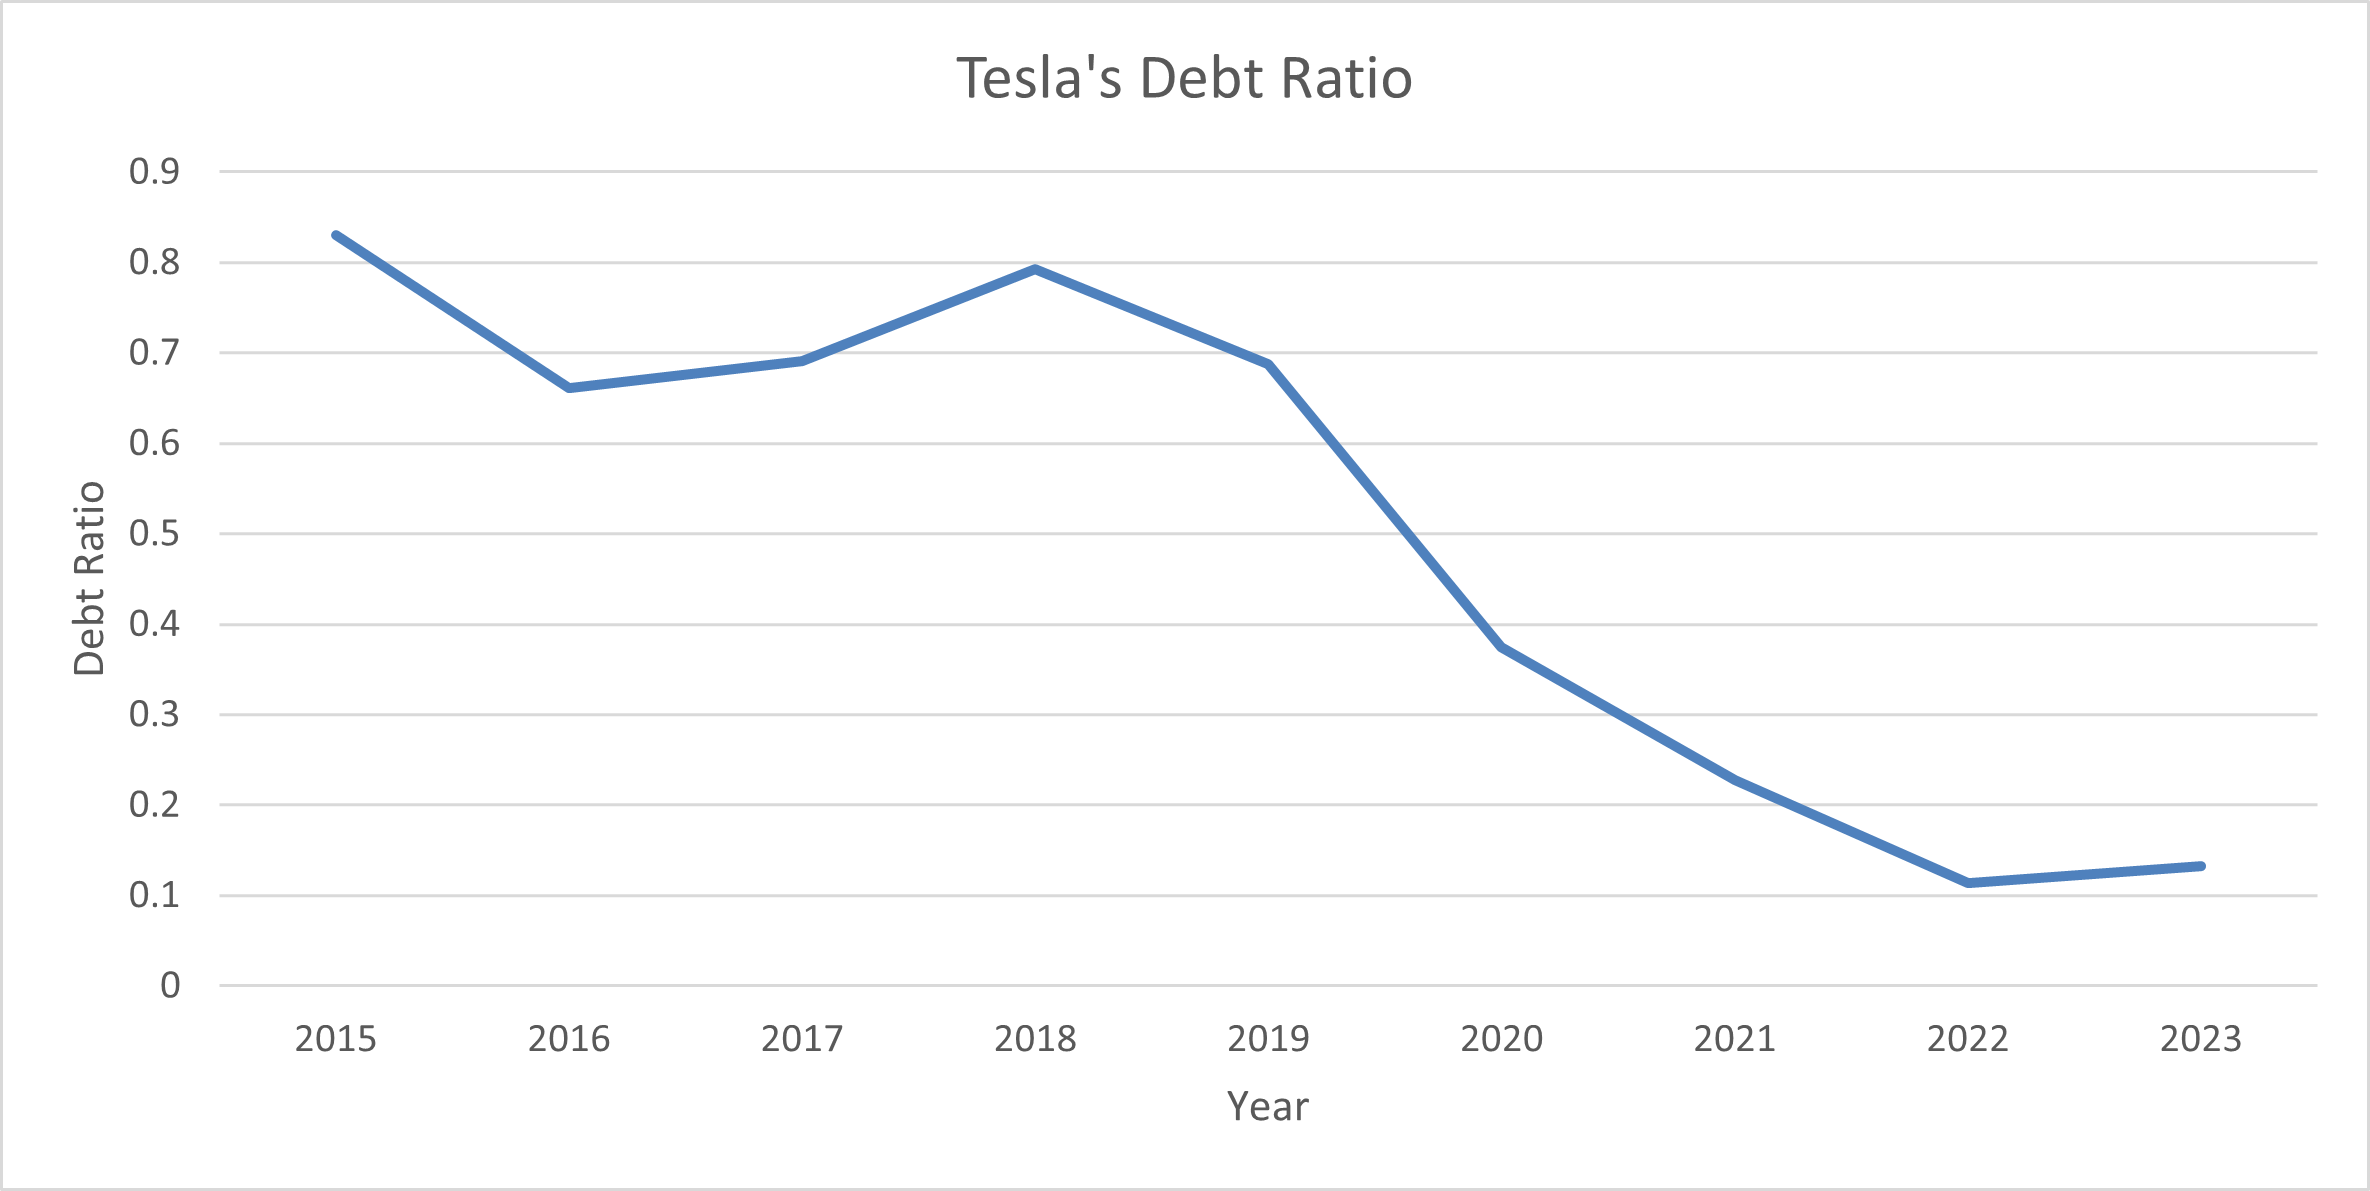
Tesla, renowned for its electric vehicles and energy products, has historically maintained a high debt ratio. For example, Tesla’s debt ratio has been around 0.70 in late 2010s, indicating that 70% of its assets are financed by debt. This high leverage reflects Tesla’s aggressive growth strategy and significant investments in technology and infrastructure. Despite the elevated debt ratio, Tesla’s robust revenue growth and innovative position have led to a high valuation, illustrating that high leverage can be manageable if the company demonstrates strong financial performance and growth potential.
Figure 3. Tesla’s Debt Ratio From 2015 – 2023.
Apple Inc.
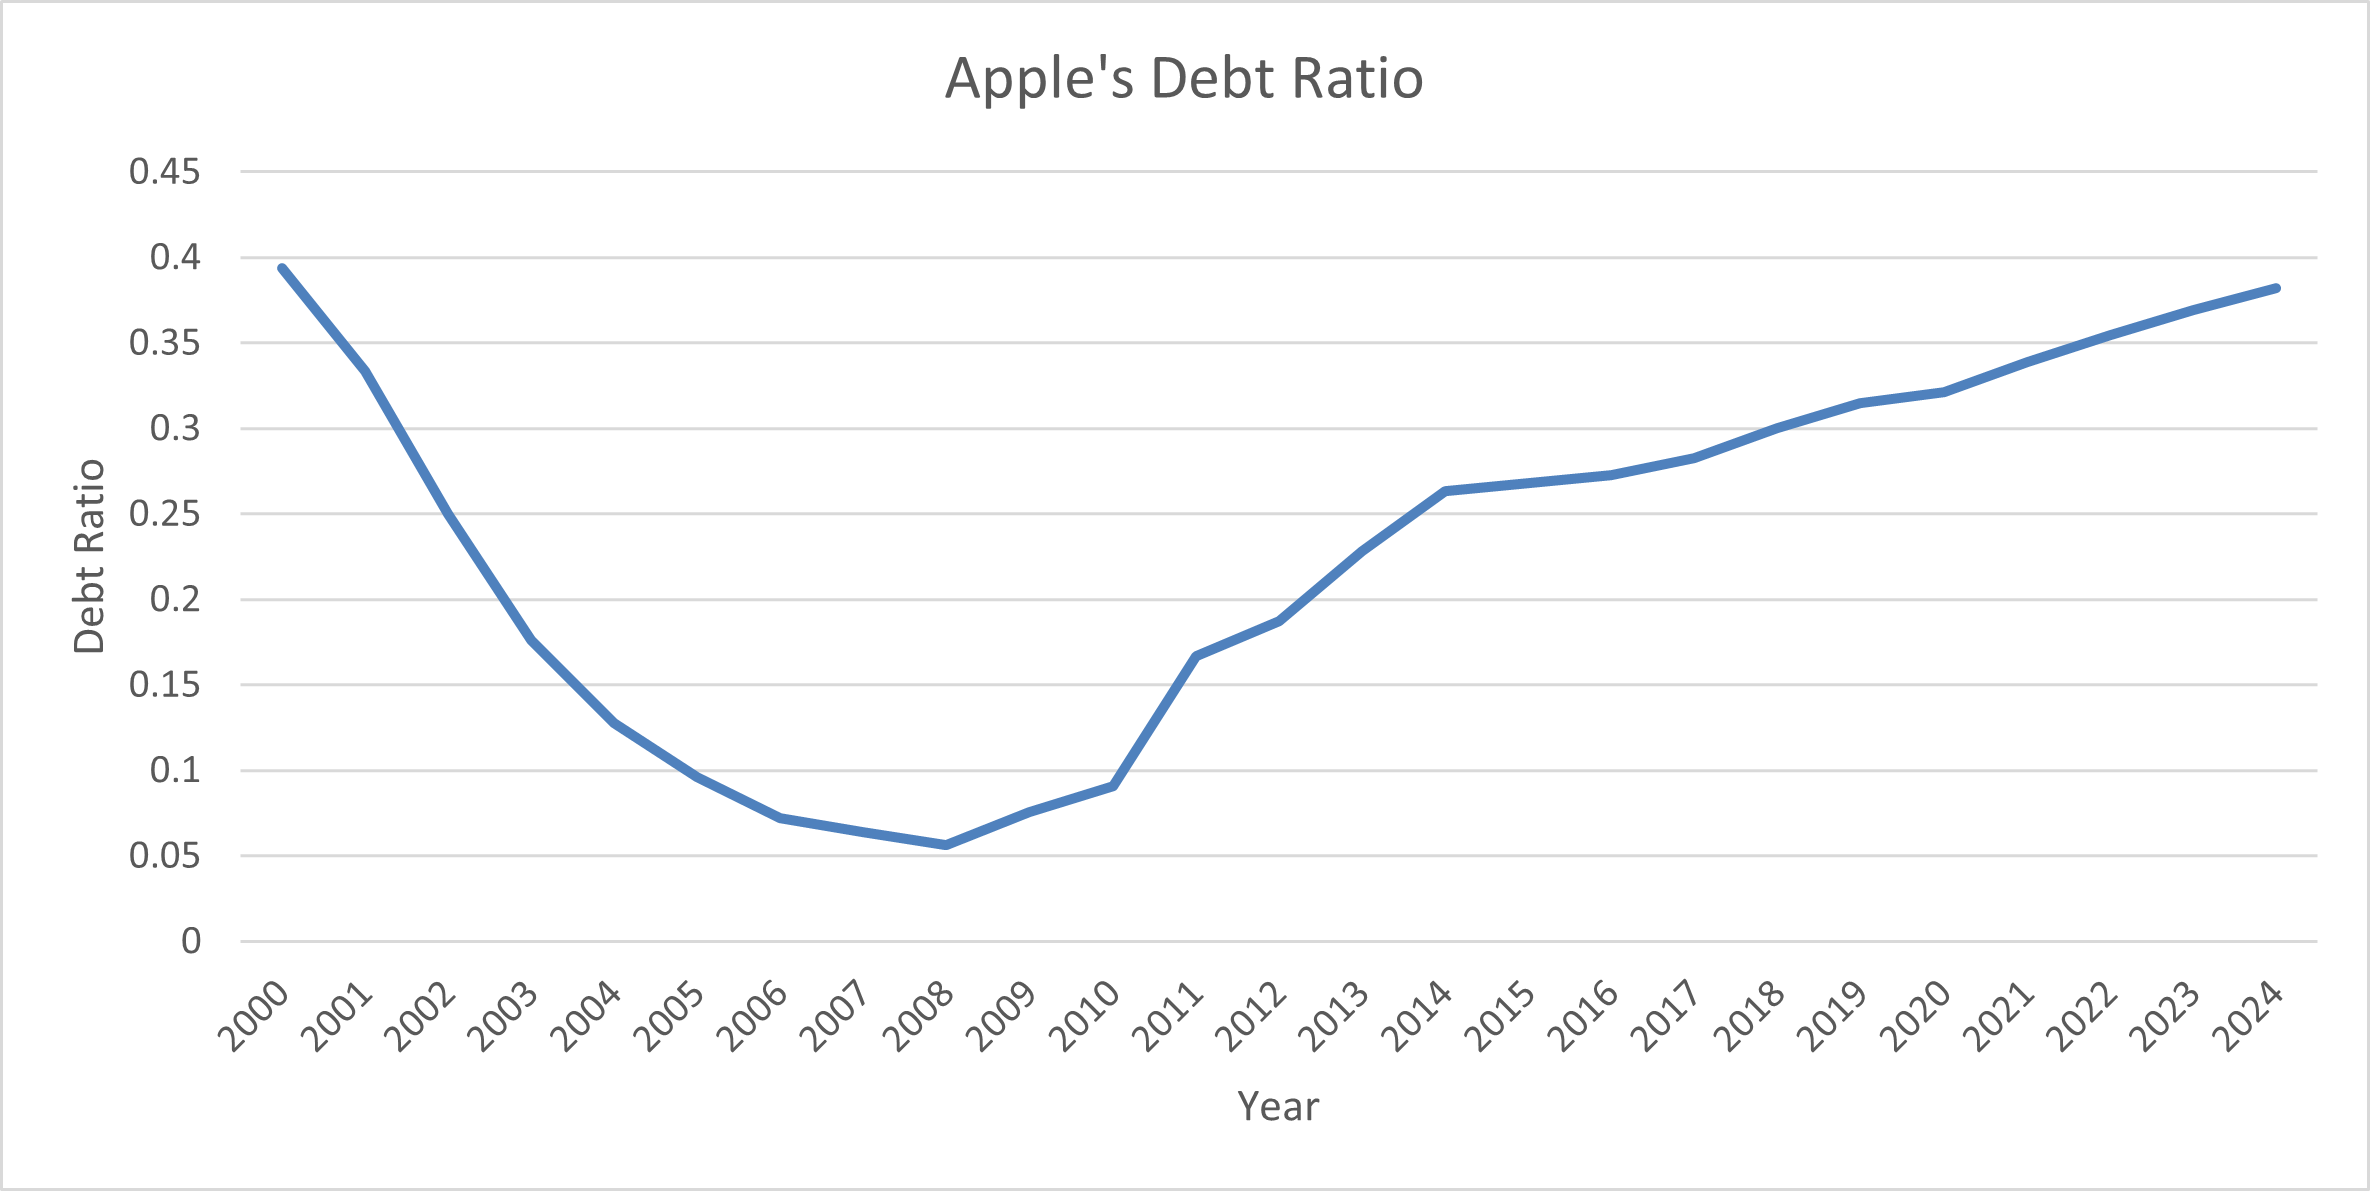
Apple, a leading technology company, has a lower debt ratio compared to Tesla. As of its latest financial disclosures in 2024, Apple’s debt ratio stands at almost 0.40. This lower ratio indicates that Apple relies more on equity financing and has a solid balance sheet. Apple’s cautious approach to debt and substantial cash reserves contribute to its high valuation and perceived financial stability. Investors value Apple’s lower risk profile and consistent cash flow generation, which supports a high valuation.
Figure 4. Apple’s Debt Ratio From 2000 – 2024.
General Electric (GE)
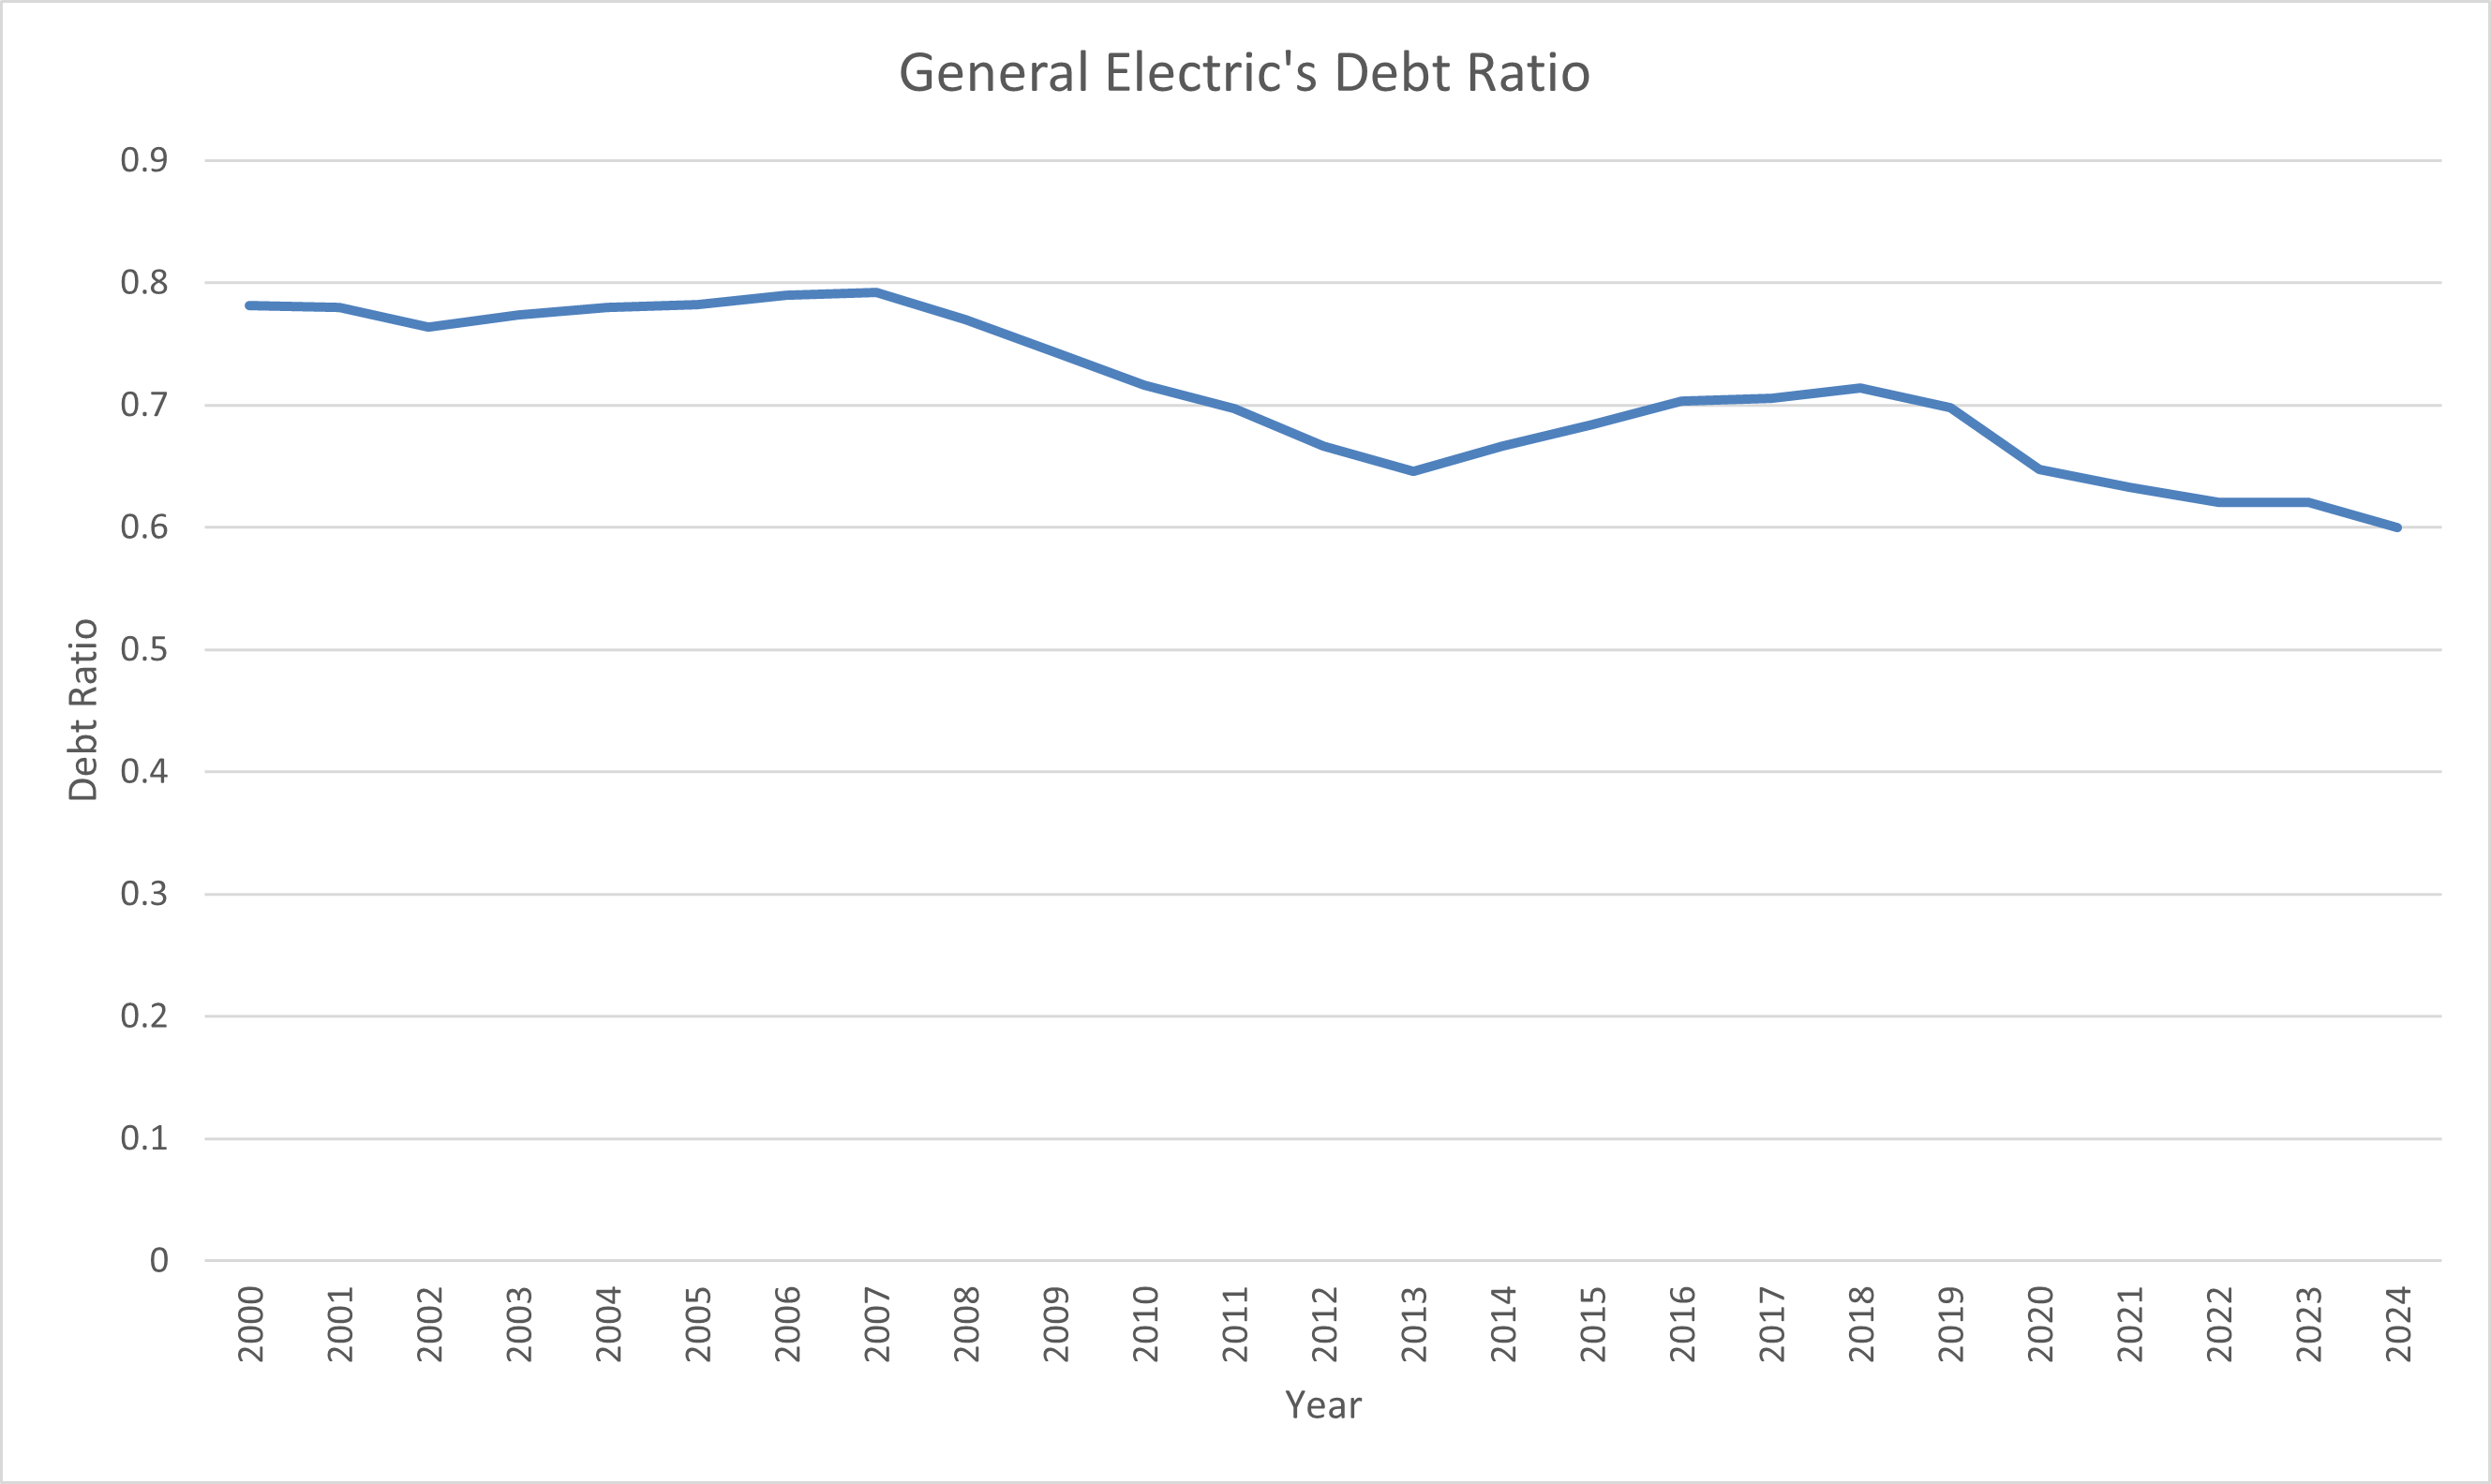
General Electric, a large multinational conglomerate, has experienced varying debt ratios over time. Historically, GE has had a high debt ratio, such as in 2000 when it was approximately 0.8. As of 2024, it stands at 0.6. This high leverage was partly due to significant capital investments and acquisitions. During its restructuring phase, the high debt ratio contributed to financial difficulties and a lower stock price (cost due to the restructuring). This example underscores how excessive leverage can impact a company’s valuation and financial health.
Figure 5. General Electric’s Debt Ratio From 2000 – 2024.
Conclusion
The debt ratio is a vital metric for understanding a company’s financial structure and risk profile. Its implications for company valuation are substantial, affecting perceptions of risk, cost of capital, creditworthiness, and growth potential. By analysing the debt ratio alongside other financial indicators and industry benchmarks, investors and analysts can develop a comprehensive understanding of a company’s financial health and make more informed valuation decisions.
Real-world examples, such as Tesla’s high debt ratio versus Apple’s conservative approach, illustrate how different debt levels can influence a company’s valuation and investor perception. A thorough analysis of the debt ratio enables stakeholders to assess a company’s stability, growth prospects, and financial strategy, leading to more accurate and insightful evaluations.
Related Posts On The SimTrade Blog
▶ Georges WAUBERT Why do companies issue debt?
▶ Georges WAUBERT Corporate debt
▶ Georges WAUBERT The rise in corporate debt
▶ Bijal GANDHI Credit Rating
▶ Jayati WALIA Credit risk
▶ Louis DETALLE A quick review of the DCM (Debt Capital Market) analyst’s job…
Useful Resources
Academic references
Modigliani, F., M.H. Miller (1958) “The Cost of Capital, Corporation Finance and the Theory of Investment.” American Economic Review, 48(3), 261-297.
Modigliani, F., M. H. Miller (1963) “Corporate Income Taxes and the Cost of Capital: A Correction.” American Economic Review, 53(3), 433-443.
Business resources
About The Author
The article was written in October 2024 by Anant JAIN (ESSEC Business School, Master in Management, 2019-2022).
▶ Read all articles by Anant JAIN.