Exchange-traded funds and Tracking Error

Exchange-traded funds and Tracking Error

Micha FISHER

In this article, Micha FISHER (University of Mannheim, MSc. Management, 2021-2023) explains the concept of Tracking Error in the context of exchange traded funds (ETF).

This article will offer a short introduction to the concept of exchange-traded funds, will then describe several reasons for the existence of tracking errors and finish with a concise example on how tracking error can be calculated.

Exchange-traded funds

An exchange-traded fund is conceptionally very close to classical mutual funds, with the key difference being, that ETFs are traded on a stock exchange during the trading day. Most ETFs are so-called index funds and thus they try to replicate an existing index like the S&P 500 or the CAC 40. This sort of passive investing is aimed at following or tracking the underlying index as closely as possible. However, actively managed ETFs with the aim of outperforming the market do exist as well and typically come with higher management fees. There are several types of ETFs covering equity index funds, commodities or currencies with classical equity index funds being the most prominent.

The total volume of global ETF portfolios has increased substantially over the last two decades. At the beginning of the century total asset volume was in the low triple digit billions measured in USD. According to research by the Wall Street Journal total assets in ETF investments surpassed nine trillion USD in 2021.

The continuing attractiveness of exchange-traded index funds can be explained with the very low management fees, the clarity of the product objective, and the high liquidity of the investment vehicle. However, although especially the market leaders like BlackRock, the Vanguard Group or State Street offer products that come extremely close to mirroring their underlying index, exchange-traded funds do not perfectly track the evolution of the underlying index. This phenomenon is known as tracking error and will be discussed in detail below.

Theoretical measure of the Tracking Error

Simply speaking, the tracking error of an ETF is the difference in the returns of the underlying index (I for index) and the returns of the ETF itself (E for ETF). For a specific period, it is computed by taking the standard deviation of the differences between the two time-series.

Formula for tracking error

Theoretically, it is possible to fully replicate an index in a portfolio and thus reach a tracking error of zero. However, there are several reasons why this is not achievable in practice.

Origins of the Tracking Error

The most important and obvious reason is that the Net Asset Value (NAV) of index funds is necessarily lower than the NAV of its underlying index. An index itself has no liabilities, as it is strictly speaking an instrument of measurement. On the other hand, even a passively managed index fund comes with expenses to pay for infrastructure, personnel, and marketing. These liabilities decrease the Net Asset Value of the fund. In general, a higher tracking error could indicate that the fund is not working efficiently compared to products of competitors with the same underlying index.

Another origin of tracking error can be found in specific sector ETFs and more niche markets with not enough liquidity. When the trading volume of a stock is very low, buying / selling the stock would increase / decrease the price (price impact). In this case an ETF could buy more liquid stocks with the aim to mirror the value development of the illiquid stock, which in turn could lead to a higher tracking error.

Another source of tracking error that occurs more severely in dividend-focused ETFs is the so-called cash drag. High dividend payments that are not instantly reinvested drag down the fund performance in contrast to the underlying index.

Of course, transaction fees of the marketplaces can reduce the fund performance as well. This is especially true if large rebalancing efforts are necessary due to a change of the index composition.

Lastly, there are also ways to reduce the effects described above. Funds can engage in security lending to earn additional money. In this case, the fund lends individual assets within the portfolio to other investors (mostly short sellers) for an agreed period in return for lending fees and possible interest. It should be noted, that while this might reduce tracking error, it also exposes the fund to additional counterparty risk.

Tracking Error: An Example

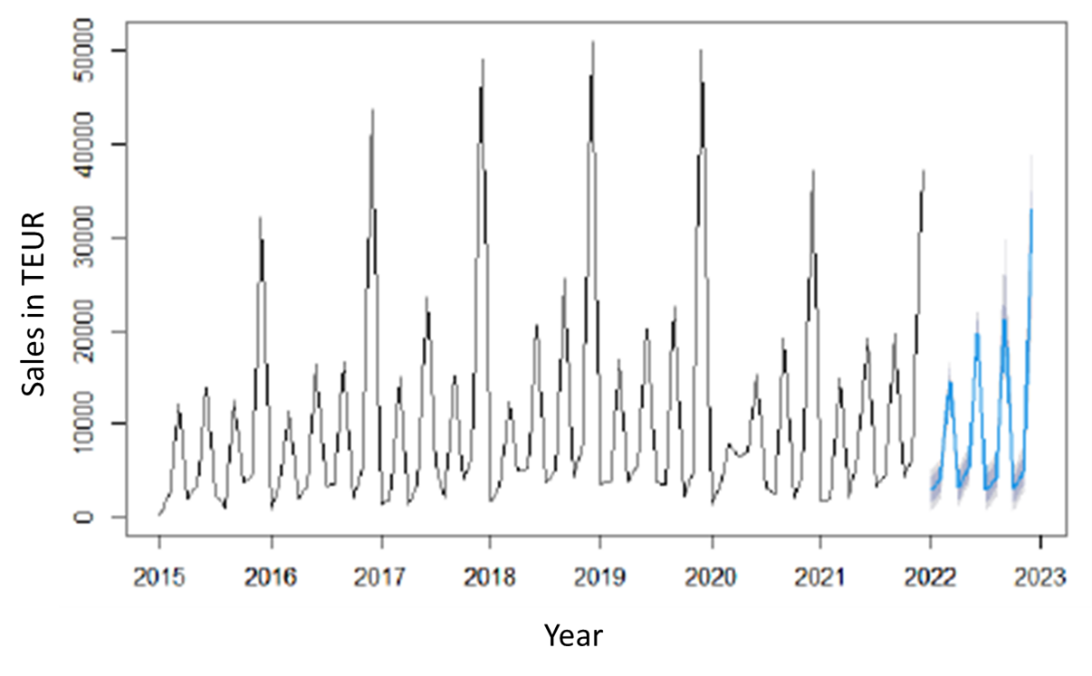
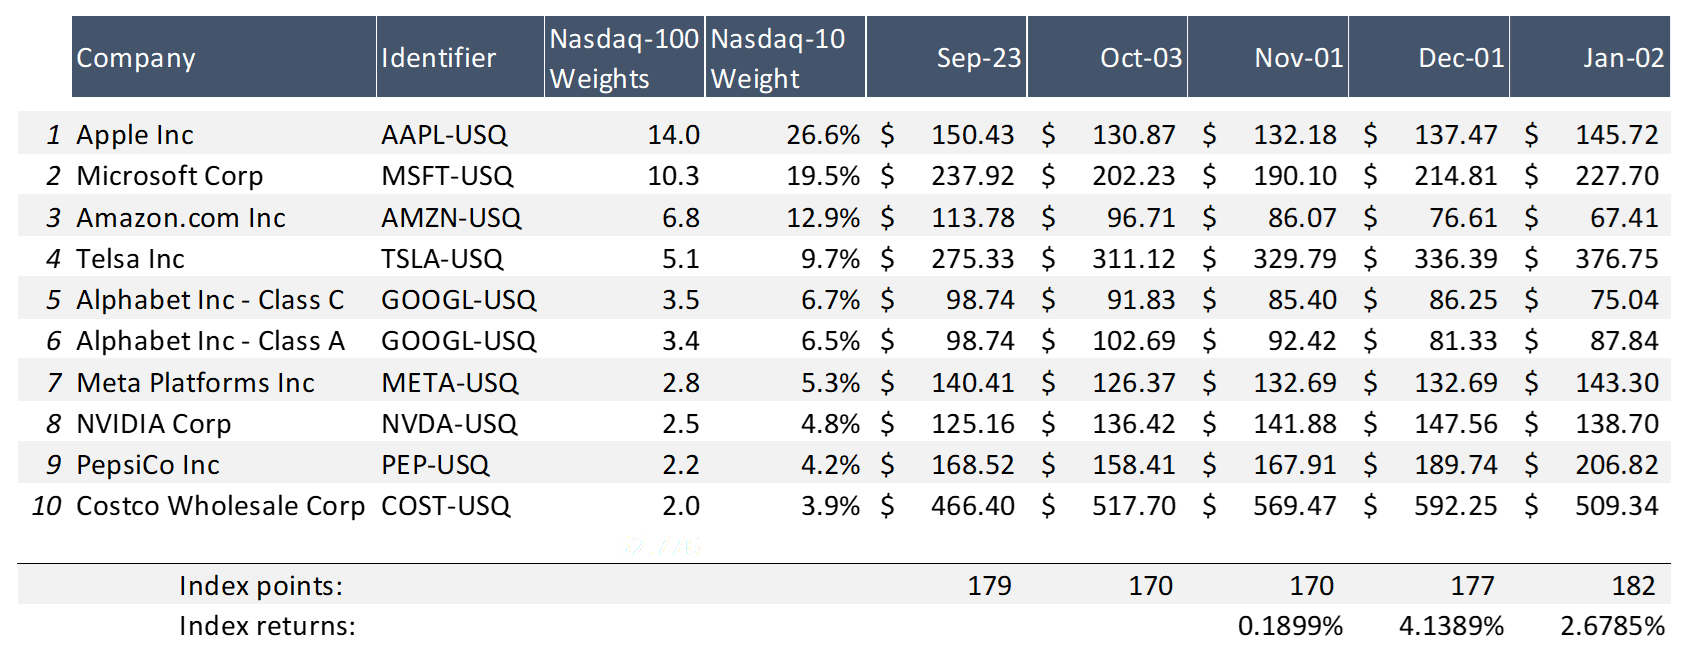
The sheet posted below shows a simple example of how the tracking error can be computed. To not include hundreds of individual shares, the example transformed the top ten positions within the Nasdaq-100 index into an artificial “Nasdaq-10” index. Although the data for the 23rd of September is accurate, the future data is of course randomly simulated.

By using the individual weights of the index components and their corresponding weights, the index returns for the next three months can be computed.

Figure 1: Three-months simulation of “Nasdaq-10” index.
Three-months simulation of Nasdaq-10 index
Source: computation by the author.

At this point our made-up ETF is introduced with an initial investment of 100 million USD. This ETF fully replicates the Nasdaq-10 index by holding shares in the same proportion as the index. In this example only the management and marketing fees are incorporated. Security lending, index changes and transaction fees and dividends are omitted. Also, all the portfolio shares are highly liquid and allow for full replication. The fund works with small expenses for personnel of only ten thousand USD per month. Additionally, once per quarter, a marketing campaign costs additionally fifty thousand USD.

Figure 2: Computation of ETF return and tracking error.
Computation of ETF-return and Tracking Error
Source: computation by the author.

Calculating the net asset value (NAV) gives us the monthly returns of the fund which in turn allows us to calculate the three-month standard deviation of the tracking difference. Additionally, the Total Expense Ratio can be calculated as the percentage of expenses per year divided by the total asset value of the fund.

This example gives us a Total Expense Ratio of nearly 0.3 percent per annum which is within the competitive area of real passive funds. Vanguard is able to replicate the FTSE All-World index with 0.2 percent. However, the calculated tracking error is obviously smaller than most real tracking errors with only 0.0002, as only management fees were considered. Exemplary, Vanguards FTSE All-World ETF had an historical tracking error of 0.042 in 2021, due to the reasons mentioned in the section above.

Excel file for computing the tracking error of an ETF

You can also download below the Excel file for the computation of the tracking error of an ETF.

Download the Excel file to compute the tracking error of an ETF

Why should I be interested in this post?

ETFs in all forms are one of the major developments in the area of portfolio management over the last two decades. They are also a very interesting option for private investments.

Although they are conceptually very simple it is important to understand the finer metrics that vary between different service providers as even small differences can have a large impact over a longer investment period.

Related posts on the SimTrade blog

   ▶ Youssef LOURAOUI ETFs in a changing asset management industry

   ▶ Youssef LOURAOUI Passive Investing

   ▶ Youssef LOURAOUI Markowitz Modern Portfolio Theory

Useful resources

Academic articles

Roll R. (1992) A Mean/Variance Analysis of Tracking Error, The Journal of Portfolio Management, 18 (4) 13-22.

Business

ET Money What is Tracking Error in Index Funds and How it Impacts Investors?

About the author

The article was written in November 2022 by Micha FISHER (University of Mannheim, MSc. Management, 2021-2023).

Time Series Forecasting: Applications and Artificial Neural Networks

Time Series Forecasting: Applications and Artificial Neural Networks

Micha FISHER

In this article, Micha FISHER (University of Mannheim, MSc. Management, 2021-2023) discusses on the applications of time series forecasting and the use of artificial neural networks for this purpose.

This article will offer a short introduction to the different applications of time-series forecasting and forecasting in general, will then describe the theoretical aspects of simple artificial neural networks and finish with a practical example on how to implement a forecast based on these networks.

Overview

The American economist and diplomat John Kenneth Galbraith once said: “The function of economic forecasting is to make astrology look respectable”. Certainly, the failure of mainstream economics to predict several financial crises is testimony to this quote.

However, on a smaller scale, forecast can be very useful in different applications and this article describes several use cases for the forecasting of time series data and a special method to perform such analyses.

Different Applications of Time Series Forecasting

Different methods of forecasting are used in various settings. Central banks and economic research institutes use complex forecasting methods with a vast amount of input factors to forecast GDP growth and other macroeconomic figures. Technical analysts forecast the evolution of asset prices based on historical patterns to make trading gains. Businesses forecast the demand for their products by including seasonal trends (e.g., utility providers) and economic developments.

This article will deal with the latter two applications of forecasting that is focused on the analysis of historical patterns and seasonality. Using different input factors to come up with a prediction, like for example a multivariate regression analysis does, can be a successful way of making prediction. However, it also inherently includes the problem of determining those input factors as well in the first place.

The practical methods described in this article circumvent this problem by exclusively using historical time series data (e.g., past sales per month, historical electricity demand per hour of the day, etc.). This makes the use of those methods easy and both methods can be used to predict helpful input parameters of DCF models for example.

Artificial neural networks

Artificial Intelligence (AI) is a frequently used buzzword in the advertising of products and services. However, the concept of artificial intelligence is going back to the 1940s, when mathematicians McCulloch and Pitts first presented a mathematical model that was based on the neural activity of the human brain.

Before delving into the practical aspects of an exemplary simple artificial neural network, it is important to understand the terminology. These networks are one – although not the only one – of the key aspects of “Machine Learning”. Machine Learning itself is in turn a subtopic of Artificial Intelligence, which itself employs different tools besides Machine Learning.

Figure 1. Neural network.
Neural network
Source: internet.

To give a simple example of an artificial neural network we will focus on a so-called feedforward neural network. Those networks deliver and transform information from the left side to the right side of the schematic picture below without using any loops. This process is called Forward Propagation. Historic time series data is simply put into the first layer of neurons. The actual transformation of the data is done by the individual neurons of the network. Some neurons simply put different weights on the input parameter. Neurons of the hidden layers then use several non-linear functions to manipulate the data given to them by the initial layer. Eventually the manipulated data is consolidated in the output layer.

This sounds all very random and indeed it is. At the beginning, a neural network is totally unaware of its actual best solution and the first computations are done via random weights and functions. But after a first result is compiled, the algorithm compares the result with the actual true value. Of course, this is not possible for values that lye in the future. Therefore, the algorithm divides the historic time series into a section used for training (data that is put into the network) and into a section for testing (data that can be compared to the transformed training data). The deviation between compiled value and true value is then minimized via the process of so-called backpropagation. Weights and functions are changed iteratively until an optimal solution is reached and the network it sufficiently trained. This optimal solution then servers to compute the “real” future values.

This description is a very theoretical presentation of such an artificial neural network and the question arises, how to handle such complex algorithms. Therefore, the last part of this article focuses on the implementation of such a forecasting tool. One very useful tool for statistical forecasting via artificial neural networks is the programming language R and the well-known development environment RStudio. RStudio enables the user to directly download user-created packages, to import historical data from Excel sheets and to export graphical presentations of forecasts.

A very easy first approach is the nnetar function of R. This function can be simply used to analyze existing time series data and it will automatically define an artificial neural network (number of layers, neurons etc.) and train it. Eventually it also allows to use the trained model to forecast future data points.

The chart below is a result of this function used on simulated sales data between 2015 and 2021 to forecast the sales of 2022. In this case the nnetar function used one layer of hidden neurons and correctly recognized a 12-month seasonality in the data.

Figure 2. Simulated sales data.
Simulated sales data
Source: internet.

Why should I be interested in this post?

Artificial neural networks are a powerful tool to forecast time-series data. By using development environments like RStudio, even users without a sophisticated background in data science can make apply those networks to forecast data they might need for other purposes like DCF models, logistical planning, or internal financial modelling.

Useful resources

RStudio Official Website

Rob Hyndman and George Athanasopoulos Forecasting: Principles and Practice

Related posts on the SimTrade blog

   ▶ All posts about financial techniques

   ▶ Jayati WALIA Logistic regression

   ▶ Daksh GARG Use of AI in investment banking

About the author

The article was written in October 2022 by Micha FISHER (University of Mannheim, MSc. Management, 2021-2023).

My job in the Investors Relations department at SAP

My job in the Investors Relations department at SAP

Micha FISHER

In this article, Micha FISHER (University of Mannheim, MSc. Management, 2021-2023) shares his experience as an employee in the Investors Relations department at SAP, Europe’s largest software company.

SAP

SAP is a curious case within the DAX 40 index. Unlike many of the well-known German enterprises, it is not a company built around the automotive sector, machinery, or chemicals. Instead, SAP is one of the very few European software companies, that can match the dominant players from the USA.

SAP
Logo SAP
Source: SAP.

However, SAP is not known for its consumer products, and its business is purely focused on the business-to-business (B2B) sector. As one of the leading providers of Enterprise Resource Planning (ERP) systems, SAP provides other companies with the opportunity to transform themselves into intelligent enterprises with integrated processes. Applications cover all possible business processes from supply-chain management to finance through supporting functions like human resources.

In the 2020s, SAP’s current main challenge is to transform its business and its large and international client base from mainly locally managed systems (on premise) to remotely managed systems (cloud services). This presents a great opportunity and comes with many benefits not only for SAP’s customers but also for SAP shareholders, as cloud contracts provide the business with stable and more recurring revenues.

My Work Experience

As a multinational enterprise, SAP offers various jobs in areas like development, consulting, or sales. Due to my proclivity for Finance and Communication, I choose to work for SAP’s Investor Relations department. This department works closely with the CFO and CEO of the company to facilitate an ongoing dialogue with the investor community, to prepare the publication of quarterly results and to manage the annual general meeting of shareholders.

While some colleagues deal with matters of retail shareholders or with matters of ESG investors specifically, I was mostly supporting the institutional side of the team. This means listening to the sell-side analysts of the large investments firms that are covering the company (UBS, GS, JPM, etc.), preparing meetings with those analysts or with portfolio managers and in general keeping an eye on the current sentiment of the market.

Knowledge and skills needed

A good Investor Relations Officer should have a diverse and broad background. Of course, financial knowledge and the skills to analyze financial statements is key, as those topics are part of the daily discussions with external analysts as well as with internal stakeholders.

However, a good general understanding of the industry and of the product landscape is necessary as well. And finally, sufficient communication skills are a must: it is not enough to advertise the company to future potential shareholders, it is also critical to listen to the concerns of existing shareholders and to relay this information back into the board room of the company.

What I learned

The market is always right. This is a very confrontative statement and I suppose not everyone would agree with this initially. However, in my experience, an honest and transparent approach to financial communication is the most successful one in the long term. Investor Relations should not sugarcoat its messages to the market. At the end, the value of the company is fundamentally decided by its potential to generate cash flows (and especially cash flows for shareholders with dividends). Changing the messaging can only delay a change of the stock price. One of my colleagues with a lot of experience loves to quote President Abraham Lincoln on this matter (although nobody knows if he really said that): “You can fool some of the people all of the time, and all of the people some of the time, but you cannot fool all of the people all of the time.”.

Financial concepts

To work in Investor Relations, you should be aware of several financial concepts: Firm valuation and modelling are at the heart of the job. General knowledge about M&A activities and divestitures can also be very helpful. But the most important concept is to understand the different players on the equity market:

Sell side

The sell side represents all the third-party analysts from investment banks or independent research firms that do not actually trade the stock of the company but sell their reports and insights to those who do. These analysts have a very deep understanding of the industry and the business model and there are excellent at modelling firm valuations.

Buy side

The buy side consists of large private funds, insurance companies and sovereign state funds. These are the actual shareholders of the company and often the portfolio managers of these companies are generalists with various industries in their portfolios. They are a diverse group of firms and while some of them are very passive investors, others are actively trying to influence the decision processes within the company.

Proxy advisors

Proxy advisors provide advisory services to institutional investors. They advise the buy side investors on how to vote during the annual general meeting of a corporation. As the market for proxy advisory is heavily concentrated, it is of utmost importance for Investor Relations to keep an ongoing dialogue with these firms. Well-known proxy advisors are “Glass, Lewis & Co” and “Institutional Shareholder Services (ISS)”.

Why should I be interested in this post?

Investor Relations is a developing function in public companies and the discipline must be better studied in the academic field. It is a key function within every publicly traded company to minimize the information asymmetries between investors and management and thus in my opinion a very interesting area to work in.

Related posts on the SimTrade blog

   ▶ All posts about Professional experiences

   ▶ Anna BARBERO Career in finance

   ▶ Alexandre VERLET Classic brain teasers from real-life interviews

Useful resources

SAP

SAP Investor Relations

National Investor Relations Institute (US-focused association)

About the author

The article was written in October 2022 by Micha FISHER (University of Mannheim, MSc. Management, 2021-2023).