

In this article, Jayati WALIA (ESSEC Business School, Grande Ecole – Master in Management, 2019-2022) presents an overview of logistic regression and its application in finance.
Introduction
Logistic regression is a predictive analysis regression method that is used in classification to determine whether an output that is categorical, belongs to a particular class or category. Mathematically, this means that the dependent variable in regression is dichotomous or binary i.e., it can take the values 0 or 1. Logistic regression is used to describe data and explain the relationship between one dependent binary variable and one or more nominal, ordinal, interval or ratio-level independent variables.
For instance, consider a weather forecasting situation. If we wish to predict the likelihood of whether it will rain or not on a particular day, linear regression is not going to be of use in this scenario because our outcome or value of dependent variable is unbounded. On the other hand, a binary logistic regression model will provide with a classified outcome (1: it will rain; 0: it will not rain).
Logistic regression analysis is valuable for predicting the likelihood of an event. It helps determine the probabilities between any two classes. In essence, logistic regression helps solve probability and classification problems.
Logistic Function
Logistic regression model uses the sigmoid function to map the output of a linear equation between 0 and 1. The sigmoid function is an S-shaped curve and can be expressed as:
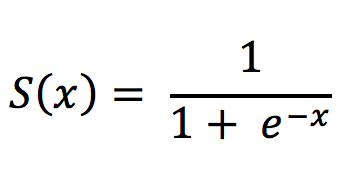
Figure 1. Sigmoid function curve.
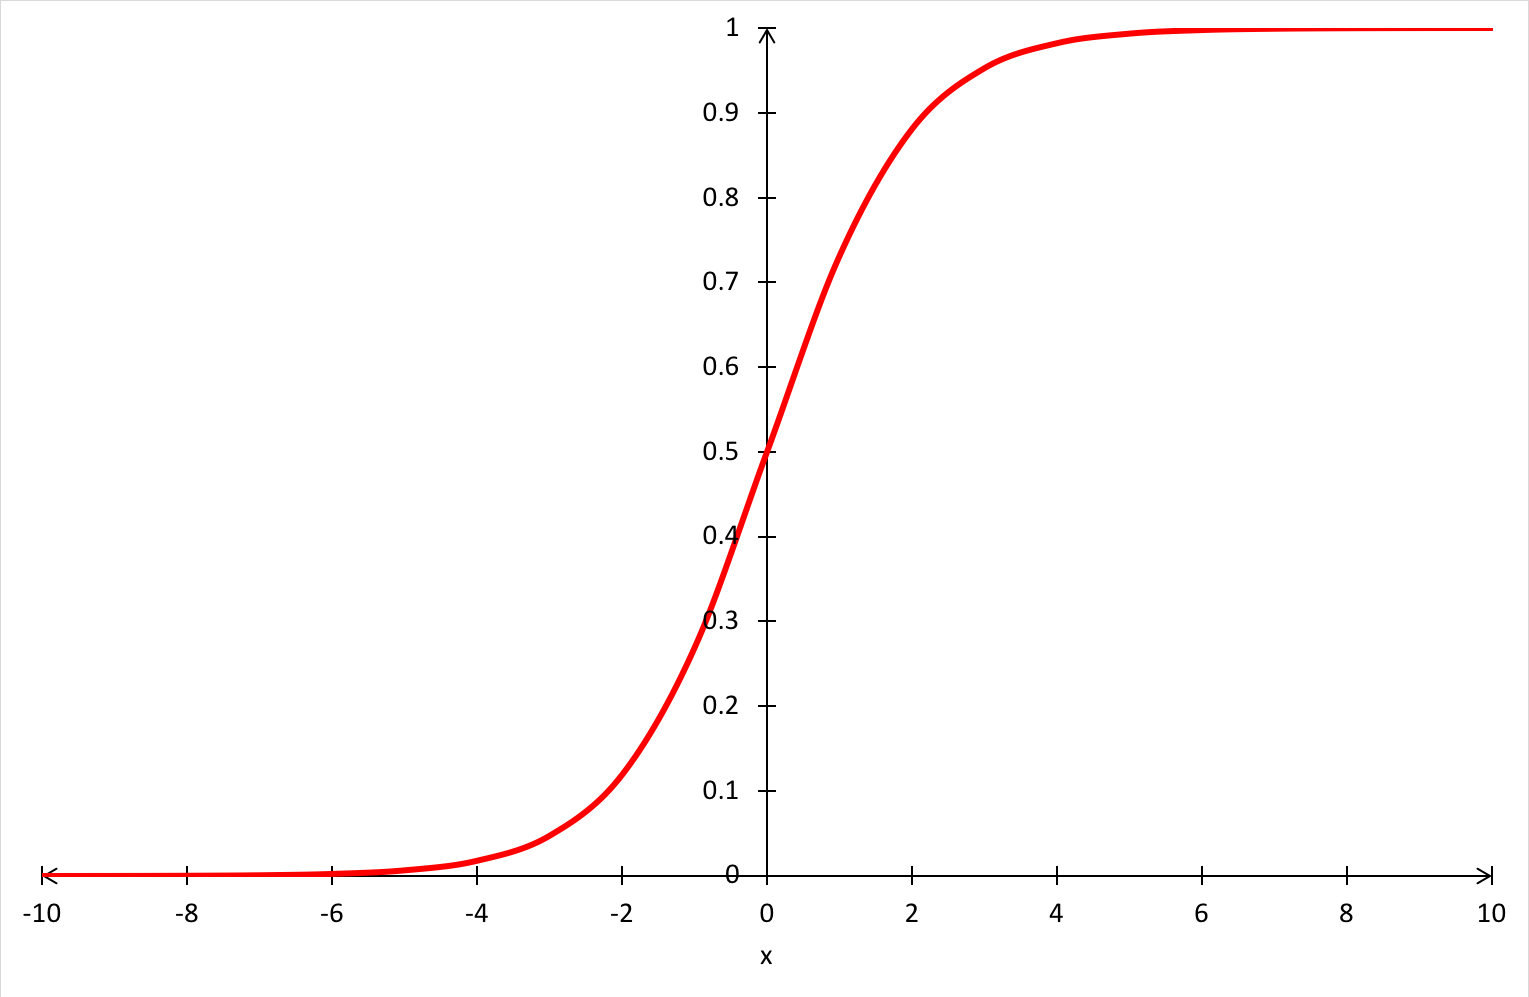
Source: computation by the author.
For logistic regression, we initially model the relationship between the dependent and independent variables as a linear equation as follows:
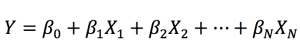
wherein Y is the dependent variable (i.e., the variable we want to predict) and X is the explanatory variables (i.e., the variables we use to predict the dependent variable). β0, β1, β2… βN are regression coefficients that are generally estimated using the maximum likelihood estimation method.
This equation is mapped to the sigmoid function to squeeze the value of the outcome (Y) from a large scale to within the range 0 – 1. We get our logistic regression equation as:
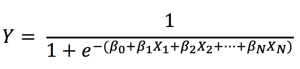
The dependent variable Y is assumed to follow a Bernoulli distribution with parameter p defined as p = Probability(Y = 1). Thus, the main use-case of a logistic model is that with given observations of the variables (X1,X2 …, XN) we estimate the probability p that the outcome Y is equal to 1.
Note that the logistic regression model is sensitive to outliers and the number of explanatory variables should be less than the total observations to avoid overfitting. The logistic regression model is generally combined with artificial neural networks to make it more suitable to assess complex relationships. In practice, it is performed using programming languages like Python and R which possess powerful libraries (packages) to evaluate the models.
Applications
Logistic regression is a relatively simple and efficient method for binary classification problems. It is a classification model that achieves very good performance with linearly separable classes or categories and is extensively employed in various industries such as medicine, gaming, hospitality, retail, etc.
In finance, the logistic regression model is commonly used to model the credit risk of individuals and small and medium enterprises. For companies, this model is used to predict their bankruptcy probability. Such a method is called credit scoring. To construct a logistic regression model for credit scoring of corporate firms, the independent variables are usually financial ratios computed with the information contained in financial statements: EBIT margin, return on equity (RoE), debt to equity (D/E), liquidity ratio, EBIT/Total Assets, etc. Further predictive statistical metrics like p-value and correlation test for multicollinearity can be used to narrow down to the variables with most contribution to the model.
Related posts on the SimTrade blog
▶ Jayati WALIA Linear Regression
▶ Jayati WALIA Credit risk
▶ Jayati WALIA Programming Languages for Quants
Useful resources
Wikipedia Maximum Likelihood Estimation
Towards Data Science Logistic Regression
About the author
The article was written in November 2021 by Jayati WALIA (ESSEC Business School, Grande Ecole Program – Master in Management, 2019-2022).