In this article, Anant JAIN (ESSEC Business School, Grande Ecole Program – Master in Management, 2019-2022) talks about the hyperinflation in Hungary during the period 1945-46.
Introduction
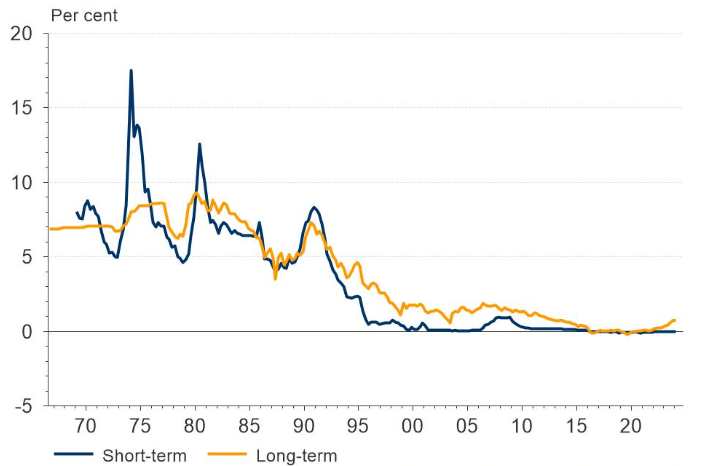
Hungary was affected by one of the most severe hyperinflation episodes ever seen, which was caused by the aftermath of World War II. During this time, from August 1945 to July 1946, the monthly inflation rate exceeded 19,000 percent as prices skyrocketed.
Causes Of Hyperinflation
Certain factors contributed to the economic and social catastrophe the country experienced:
War Devastation
The Economy of Hungary was in a very poor place due to the physical damage experienced in World War II. The war resulted in lost factories, bridges, railways, as well as the land that was destroyed rendered the supply chain and industrial output even further crippled. Many farms were also affected as huge portions of the land went wild and a lot of the required equipment was decimated as well.
Reparations & Occupation
Hungary was obligated to pay reparations to the Soviet Union, placing a significant strain on its economy. The Soviet occupation further exacerbated the situation by extracting resources, including raw materials and industrial goods, which were sent to the Soviet Union.
Excessive Money Printing
As a response to the economic issues, the Hungarian government drastically increased the money supply in an attempt to address economic concerns, which worsened the situation revealing the deficiencies of the Hungarian pengő. The central government continuously introduced bigger and bigger banknotes into the economy, but this only made the situation worse. The peak of this chaos ended in the introduction of the 100 quintillion pengo banknote which happened at the end of the hyperinflation period.
Figure 1. Banknotes In Circulation 1945-1946.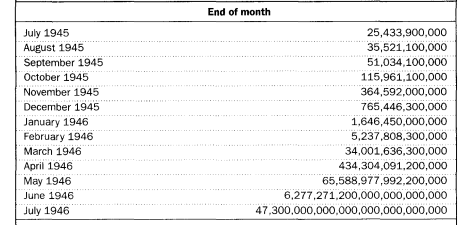
Source: Peter Z. Grossman – Butler Digital Commons
The Extent of Hyperinflation
Hyperinflation peaked in July 1946, with prices doubling approximately every 15 hours. The highest inflation rate was estimated to be at 350% in the worst day and in its course, the value of the pengo began to lessen and when this era came to an end, it meant that 1 dollar was almost equivalent to 59 billion pengos. The sad case was that inflation bred poverty, this cycle would leave the masses struggling.
Impact on Society
The hyperinflation had devastating effects on Hungarian society:
Savings Wiped Out
People’s life savings were rendered worthless almost overnight. Many individuals who had saved diligently for years found themselves destitute. The middle class, in particular, was hit hard, as their financial security evaporated in a matter of months.
Barter System
The trade of products and services through the bartering system saw a massive resurgence. All sorts of markets began to trade items such as foodstuff, clothing and tools directly, thus avoiding the worthless currency. In this way, the barter system remained inefficient and further made daily life more difficult to manage.
Economic Instability
Businesses struggled to operate in such an unpredictable economic environment, leading to widespread closures and unemployment. Employers could not pay their workers in stable currency, and many businesses went bankrupt. The lack of a stable currency also hindered investment and economic planning.
Efforts To Stabilize The Situation
On August 1, 1946, the Hungarian government attempted to curb hyperinflation by introducing forint currency, substituting pengõ at rate of four hundred octillion pengos per unit of forint. The introduction of this currency was a major step towards the reclamation of the economy, yet it must be noted that the currency was coupled with other very important factors of the economy as well.
Monetary Reform
Through monetary reform, the government put in place restrictions that were aimed at minimizing the money supply, and thereby inflation. This included an end to printing money to the extreme and guaranteeing that the new currency is fully backed by tangible assets. These were necessary conditions for enhancing public confidence in the currency and in managing inflation.
Pengő tax reform
In the hyperinflationary context, a temporary measure, designated “tax pengő index,” was implemented. Operating on a daily basis, this system served to smoothen the conversion rates with the changes in the prices which helped the transactions to be adequately organized and the control over the economy to some extent restored.
Economic Reforms
In combination with the monetary reform, the government undertook much more comprehensive measures with the goal of directing the rebuilding of the economy. It included actions intended to boost industrial output, increase agricultural production and restore hidden economy. These reforms were significant in setting the stage for enduring and efficient economic policies.
4. International Aid and Cooperation
Hungary also received assistance from international organizations and allied nations. This aid was vital in providing the necessary resources for economic recovery and in supporting the stabilization efforts. International cooperation played a significant role in Hungary’s ability to overcome the hyperinflation crisis.
Impact On Today’s Hungarian Economy
The hyperinflation that went through Hungary in the years of 1945-46 shaped the country turning it into what can be viewed as today’s Hungary, and many of those changes became more obvious.
A. Key Economic Takeaway
1. Monetary Policy Awareness
The onslaught of hyperinflation was a serious lesson learnt by Hungary in managing the basics of monetary policy. Even this single historical experience of the country has changed how it thinks about inflation and more so about currency stability as it makes them very conscious about the chances of inflation and printing of money beyond acceptable limits.
2. Economic Reforms and Stability
The time of hyperinflation masqueraded the need for deep economic reforms including the inception of the new currency the forint and monetary dispensations. These reforms transformed the prospects of the Hungarian economy as one seeking sound management and policy measures to avert crises.
3. Institutional Strengthening
The lesson from the crisis was strong financial institutions and supervision is essential. In the last decades, Hungary has tried to create such capable institutions in order to cope with future economic shocks and secure their economy.
B. Social and Cultural Aspects
1. Public Trust In Currency
The hyperinflation phase notably diminished public confidence in its domestic currency, a sentiment that was difficult to restore. Such memories of history have made Hungarians very sensitive to episodes of inflation and depreciation of their currency. This makes Hungarians have an unpredictable attitude regarding policies concerning economic aspects and management of money.
2. Economic Resilience
The economic culture prevailing in Hungary after hyperinflation shows understanding economics and having a variety of ways to adjust in the economy. These experiences of the past are helping an entire generation in restructuring their businesses and household models.
C. Modern Economic Policies
1. Inflation Targeting
The central bank of Hungary ‘Magyar Nemzeti Bank’ (MNB) has adopted an approach of inflation targeting which has become part of its monetary policy framework. This was aimed at maintaining inflation at or between specified levels and focused also on maintaining other aspects of economic growth as well.
2. Fiscal Discipline
Hyperinflation has made Hungarians economically sound. They did learn after the painful experience of economic chaos. The nation is careful to prevent these situations from occurring again by first approaching the problem of balancing the budget while ensuring their public debt stays low.
Conclusion
The hyperinflation which took place in Hungary between 1945 and 1946 is perhaps the single most striking example of what can happen when economic management techniques are not employed and more pertinently how consequential the effects of war can be. While it is often recognized as one of the most severe cases of hyperinflation, only a handful of other instances throughout the world rival it. The key point to be understood from this episode is the significance of having a sound economic policy framework as well as international coordination, particularly for post-war rebuilding purposes.
The years 1945-1946 will be marked in history as the years of hyperinflation in Hungary, and it was devastating for the economy of Hungary. The memories of these years are still fresh and remain close to the countries monetary and fiscal policies. The cost of hyperinflation is now taken care of as many years have gone past, but the impact of hyperinflation can still be seen as ravage in the economy of Hungary. Hungary seems to have adopted a very watchful and strategic approach towards its economy.
Related Posts On The SimTrade Blog
▶ Anant JAIN Understanding Hyperinflation
▶ Anant JAIN The Ongoing Hyperinflation In Turkey And Its Ripple Effects On European Union
Useful Resources
JSTOR: The Hungarian Hyperinflation
Nuremberg Media: Hungary’s Hyperinflation
About The Author
The article was written in May 2025 by Anant JAIN ESSEC Business School, Grande Ecole Program – Master in Management, 2019-2022).
▶ Read all articles by Anant JAIN.