In this article, Ian DI MUZIO (ESSEC Business School, Master in Finance (MiF), 2025–2027) discusses how valuation practitioners use trading comparables and precedent transactions when no truly “perfect” peers exist, and how to build a defensible valuation framework in Mergers & Acquisitions (M&A) for hybrid or niche sectors.
Context and objective
In valuation textbooks, comparable companies and precedent transactions appear straightforward: an analyst selects a sector in a database, obtains a clean peer group, computes an EV/EBITDA range, and applies it to the target. In practice, this situation is rare.
In real M&A mandates, the target often operates at the intersection of several activities (e.g. media intelligence, marketing technology, and consulting), across multiple geographies, with competitors that are mostly private or poorly disclosed.
Practitioners typically rely on databases such as Capital IQ, Refinitiv, PitchBook or Orbis. While these tools are powerful, they often return peer groups that are either too broad (mixing unrelated business models) or too narrow (excluding relevant private competitors). Private peers, even when strategically closest, usually cannot be used directly because they do not publish sufficiently detailed or standardized financial statements.
The objective of this article is therefore to provide an operational framework for valuing companies in such conditions. It explains:
- What trading comparables and precedent transactions really measure;
- Why “perfect” peers almost never exist in practice;
- How to construct and clean a comps set in hybrid sectors;
- How to use precedent transactions when listed peers are scarce;
- How to combine these tools with discounted cash-flow (DCF) analysis and professional judgment.
The target reader is a student or junior analyst who already understands the intuition behind EV/EBITDA (enterprise value divided by earnings before interest, taxes, depreciation and amortisation), but wants to understand how experienced deal teams reason when databases do not provide obvious answers.
Trading comparables: what they measure in practice
Trading comparables rely on the idea that listed companies with similar risk, growth and operating characteristics should trade at comparable valuation multiples.
The construction of trading multiples follows three technical steps.
First, equity value is converted into enterprise value (EV):
Enterprise Value = Equity Value + Net Debt + Preferred Equity + Minority Interests – Non-operating Cash and Investments.
This adjustment ensures consistency between the numerator (EV) and the denominator (operating metrics such as EBITDA), which reflect the performance of the entire firm.
Second, the denominator is selected and cleaned. Common denominators include LTM or forward revenue, EBITDA or EBIT. EBITDA is typically adjusted to exclude non-recurring items such as restructuring costs, impairments or exceptional litigation expenses.
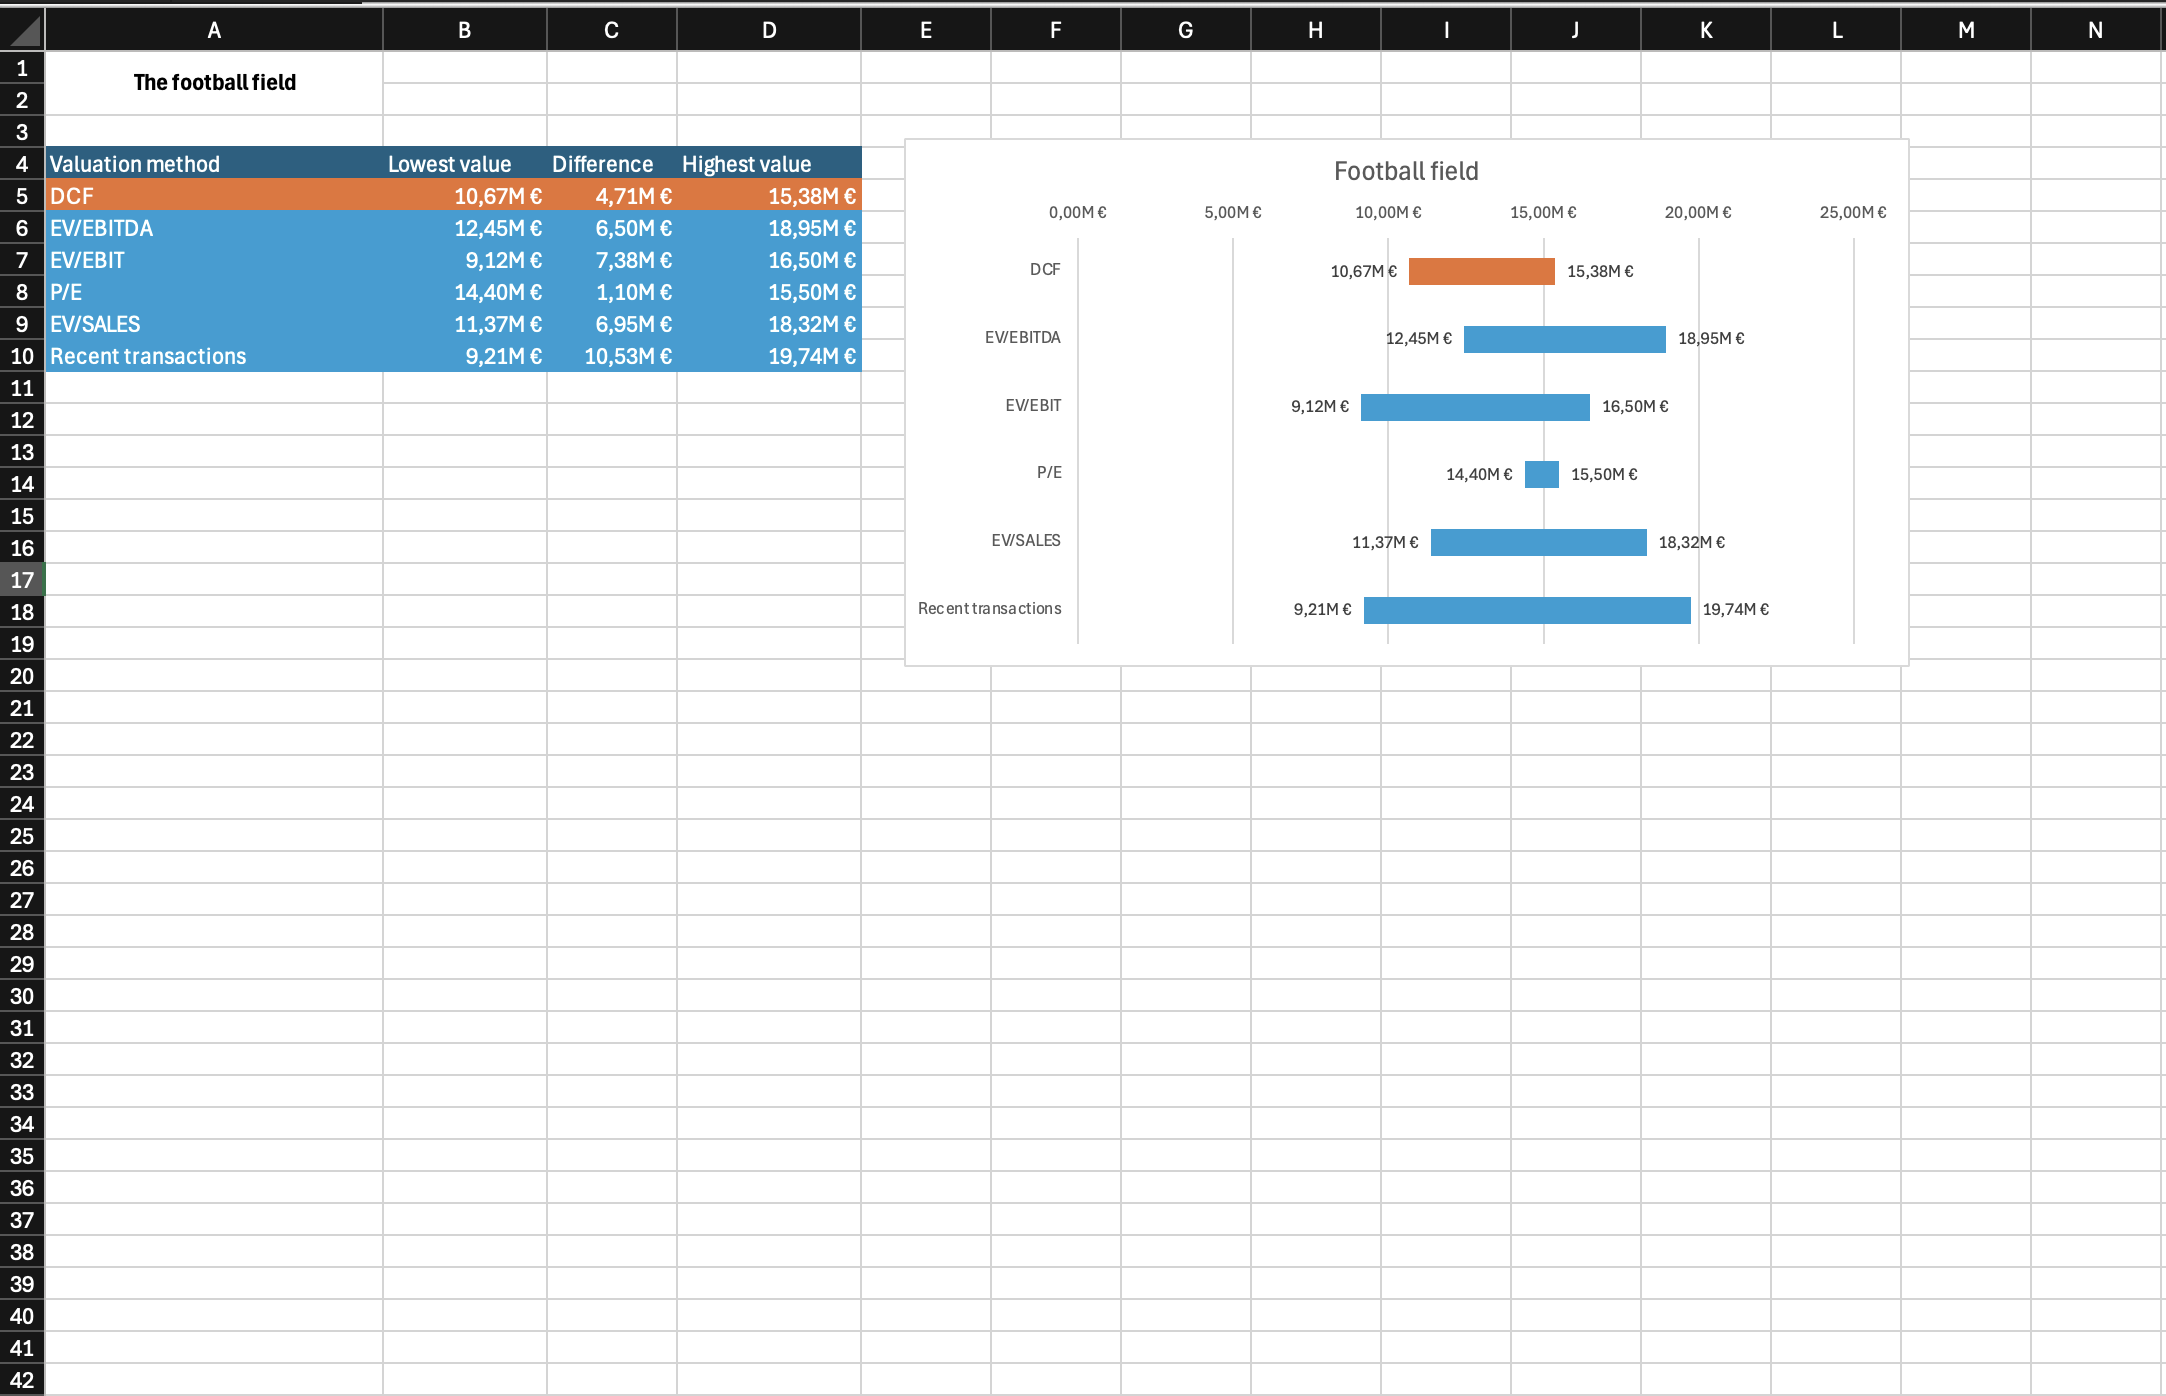
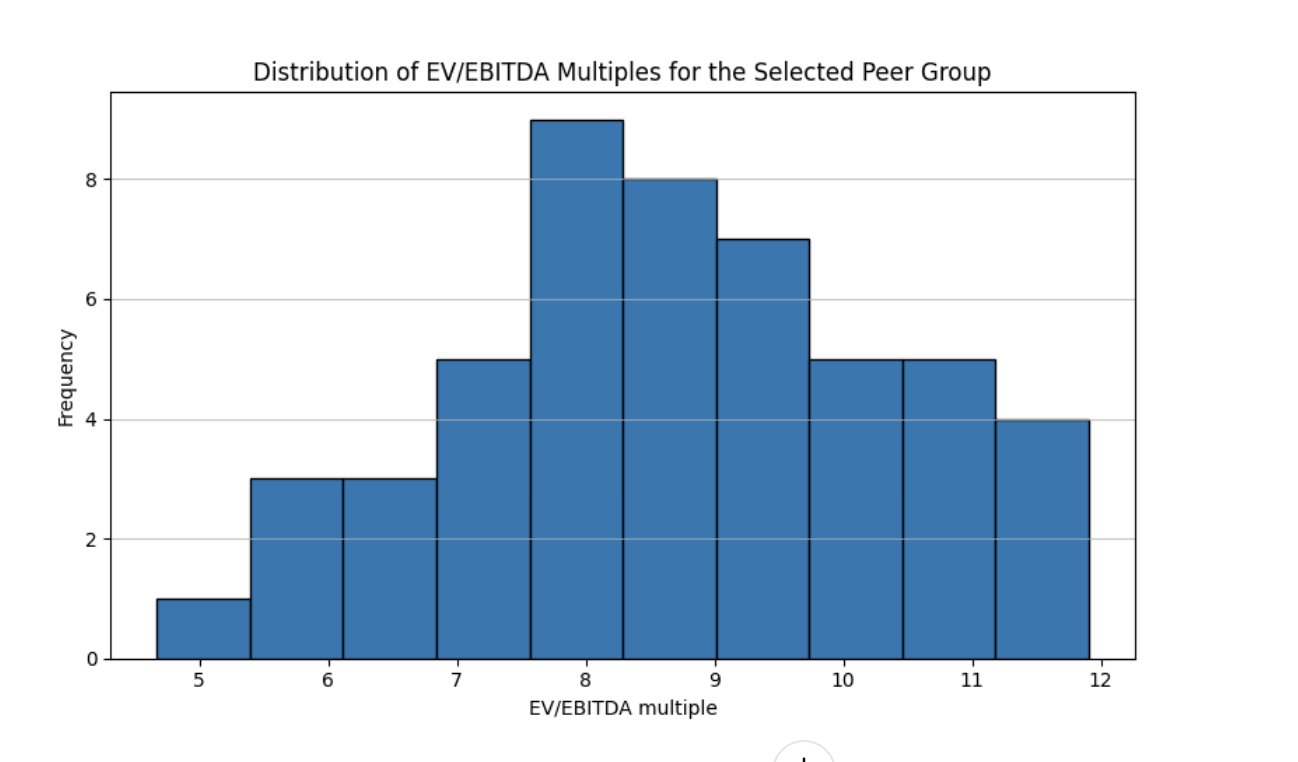
Third, analysts interpret the distribution of multiples rather than relying on a simple average. Dispersion reflects differences in growth, margins, business quality and risk. When peers are imperfect, this dispersion becomes a key analytical input.
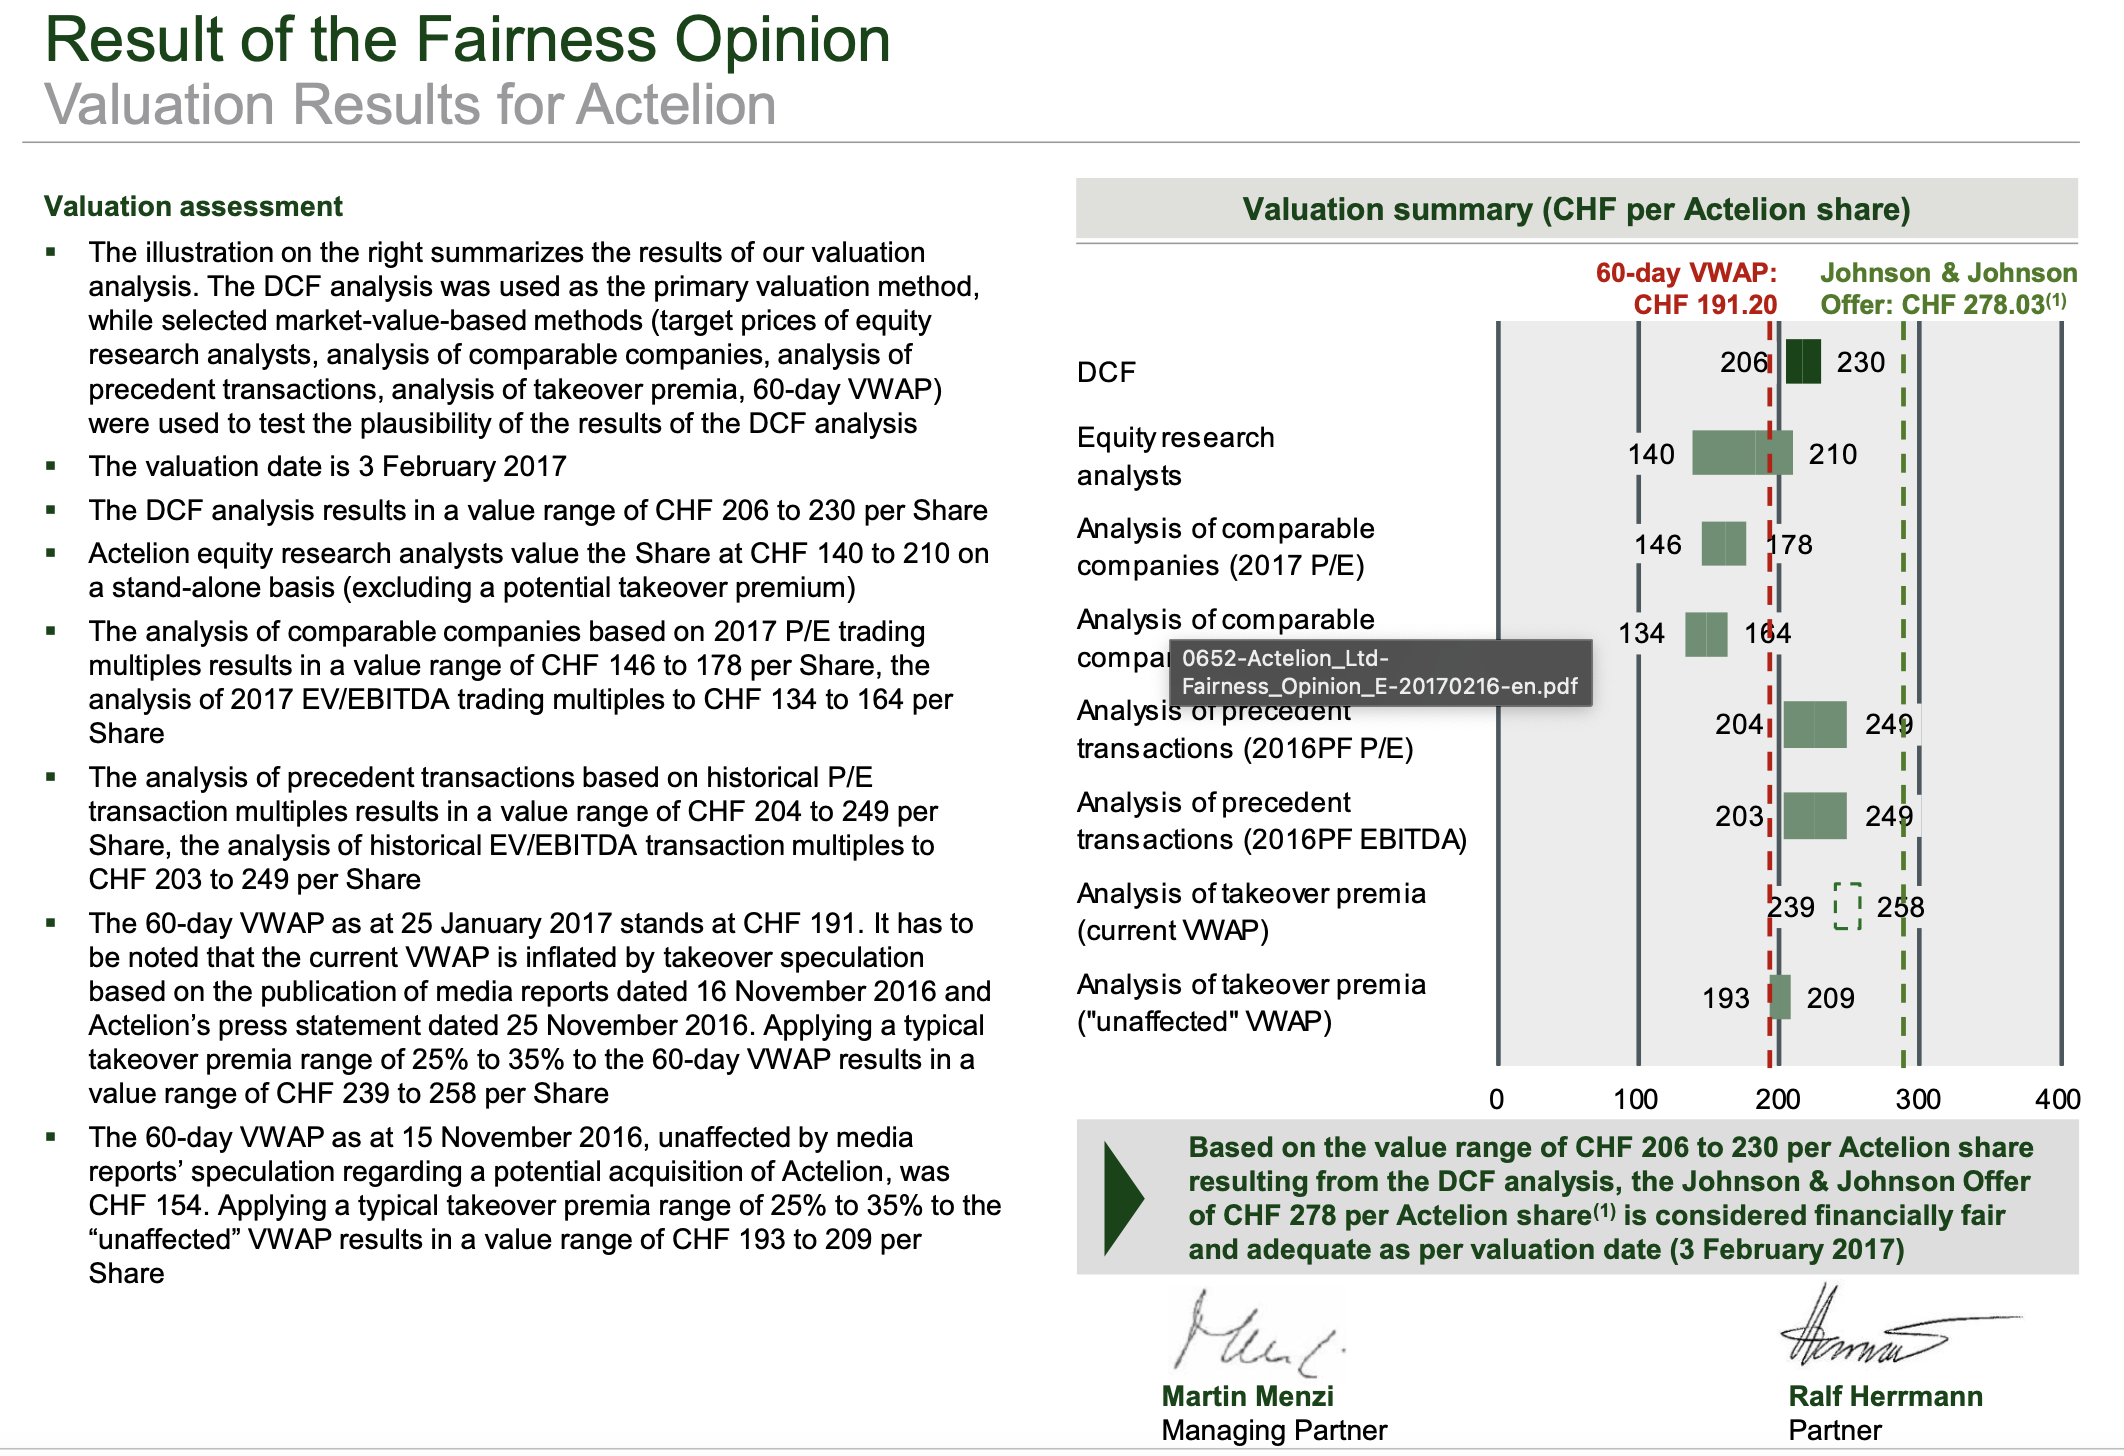
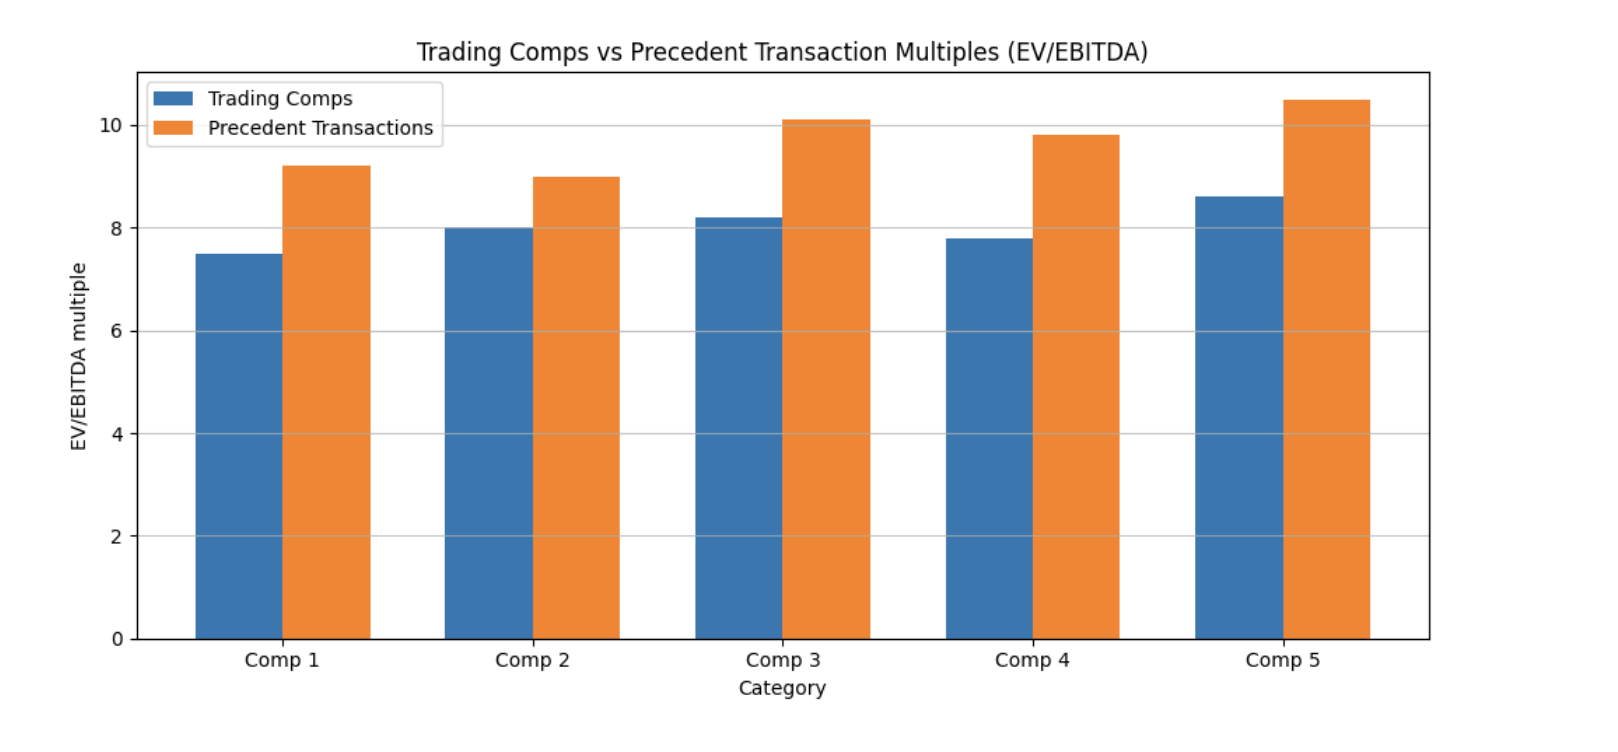
Precedent transactions: what trading comps do not capture
Precedent transactions analyse valuation multiples paid in actual M&A deals. While computed in a similar way to trading multiples, they capture additional economic dimensions, as explained below.
Transaction multiples typically include a control premium, as buyers obtain control over strategy and cash flows. They also embed expected synergies and strategic considerations, as well as prevailing credit-market conditions at the time of the deal.
From a technical standpoint, transaction enterprise value is reconstructed at announcement using the offer price, fully diluted shares, and the target’s net debt and minority interests. Careful alignment between balance-sheet data and LTM operating metrics is essential.
Why perfect peers almost never exist
Teaching in business schools often presents comparables as firms with identical sector, geography, size and growth. In real M&A practice, this situation is exceptional.
Business models are frequently hybrid. A single firm may combine SaaS subscriptions, recurring managed services and project-based consulting, each with different margin structures and risk profiles.
Accounting reporting rules, such as International Financial Reporting Standards (IFRS) or US GAAP, further reduce comparability. Differences in revenue recognition (IFRS 15), lease accounting (IFRS 16) or capitalization of development costs can materially affect reported EBITDA.
Finally, many relevant competitors are private or embedded within larger groups, making transparent comparison impossible.
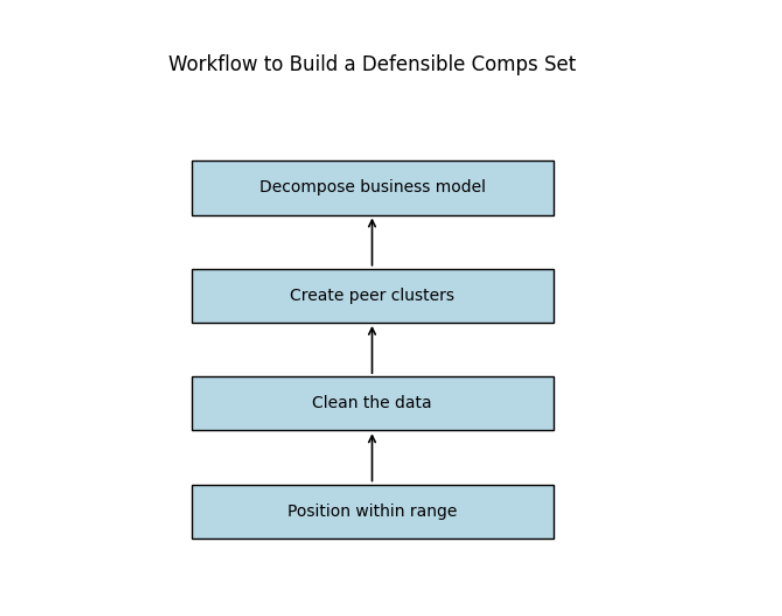
Building a defensible comps set in hybrid sectors
When similarity is weak, the analysis should begin with a decomposition of the target’s business model. Revenue streams are separated into functional blocks (platform, services, consulting), each benchmarked against the most relevant public proxies.
Peer groups are therefore modular rather than homogeneous. Geographic constraints are relaxed progressively, prioritising business-model similarity over local proximity.
When comparables fail: the role of DCF
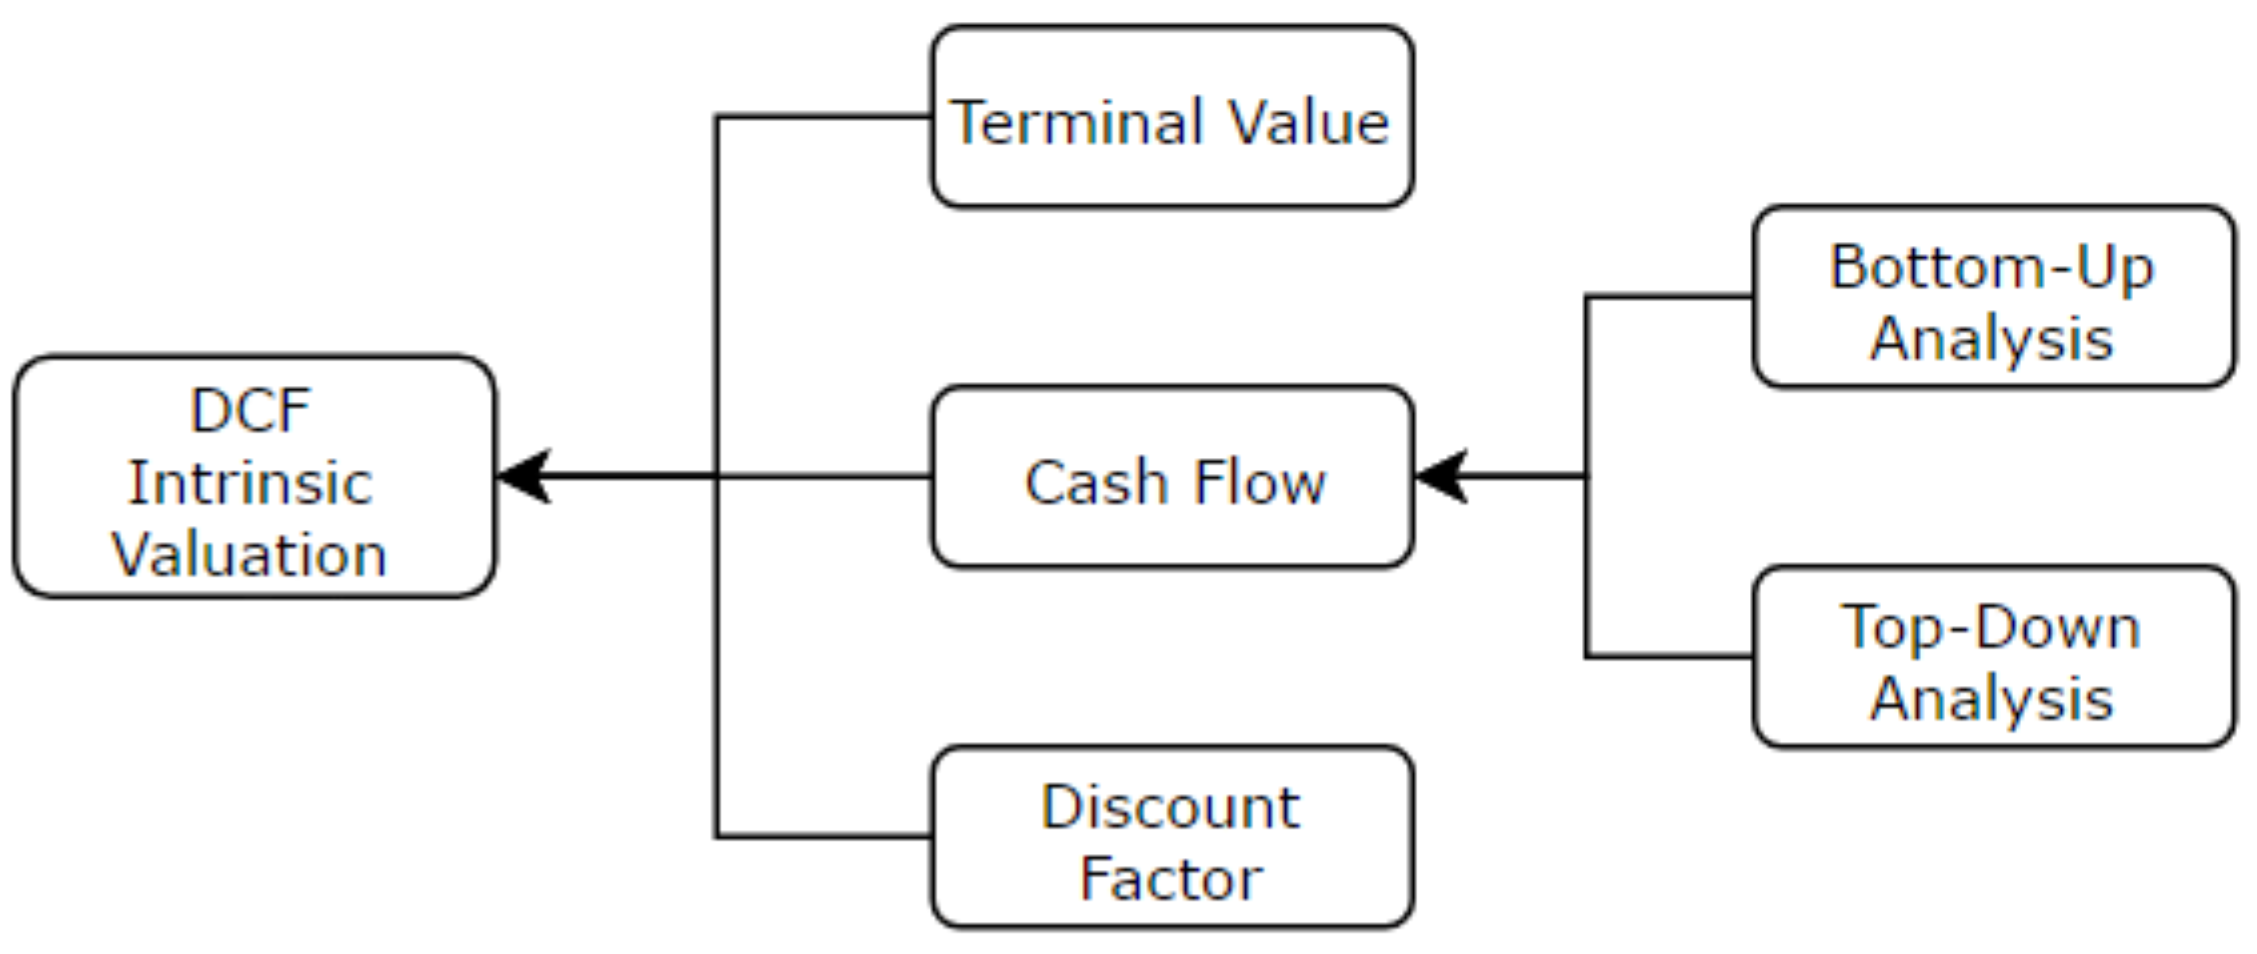
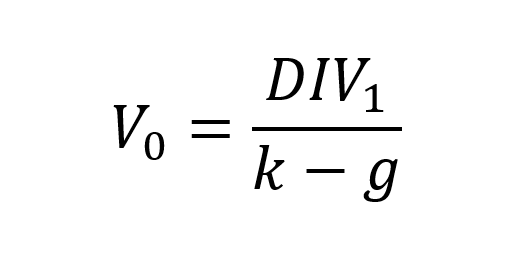
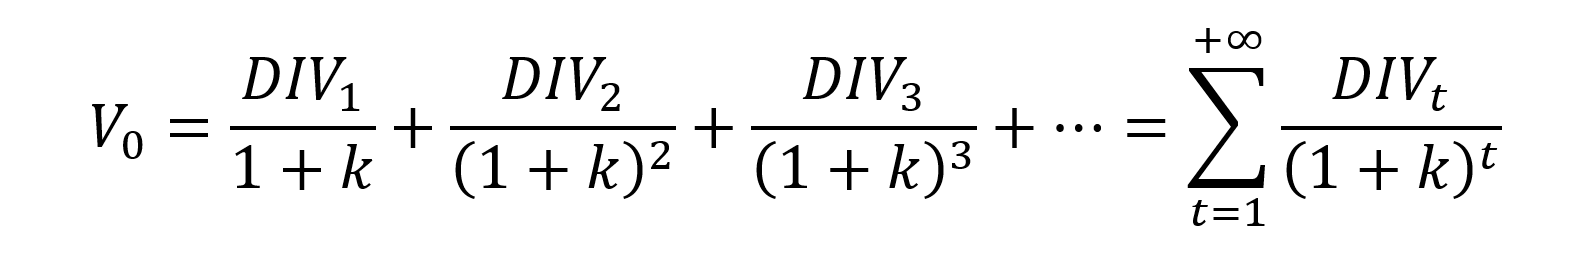
When no meaningful peers exist, discounted cash-flow (DCF) analysis becomes the primary valuation tool.
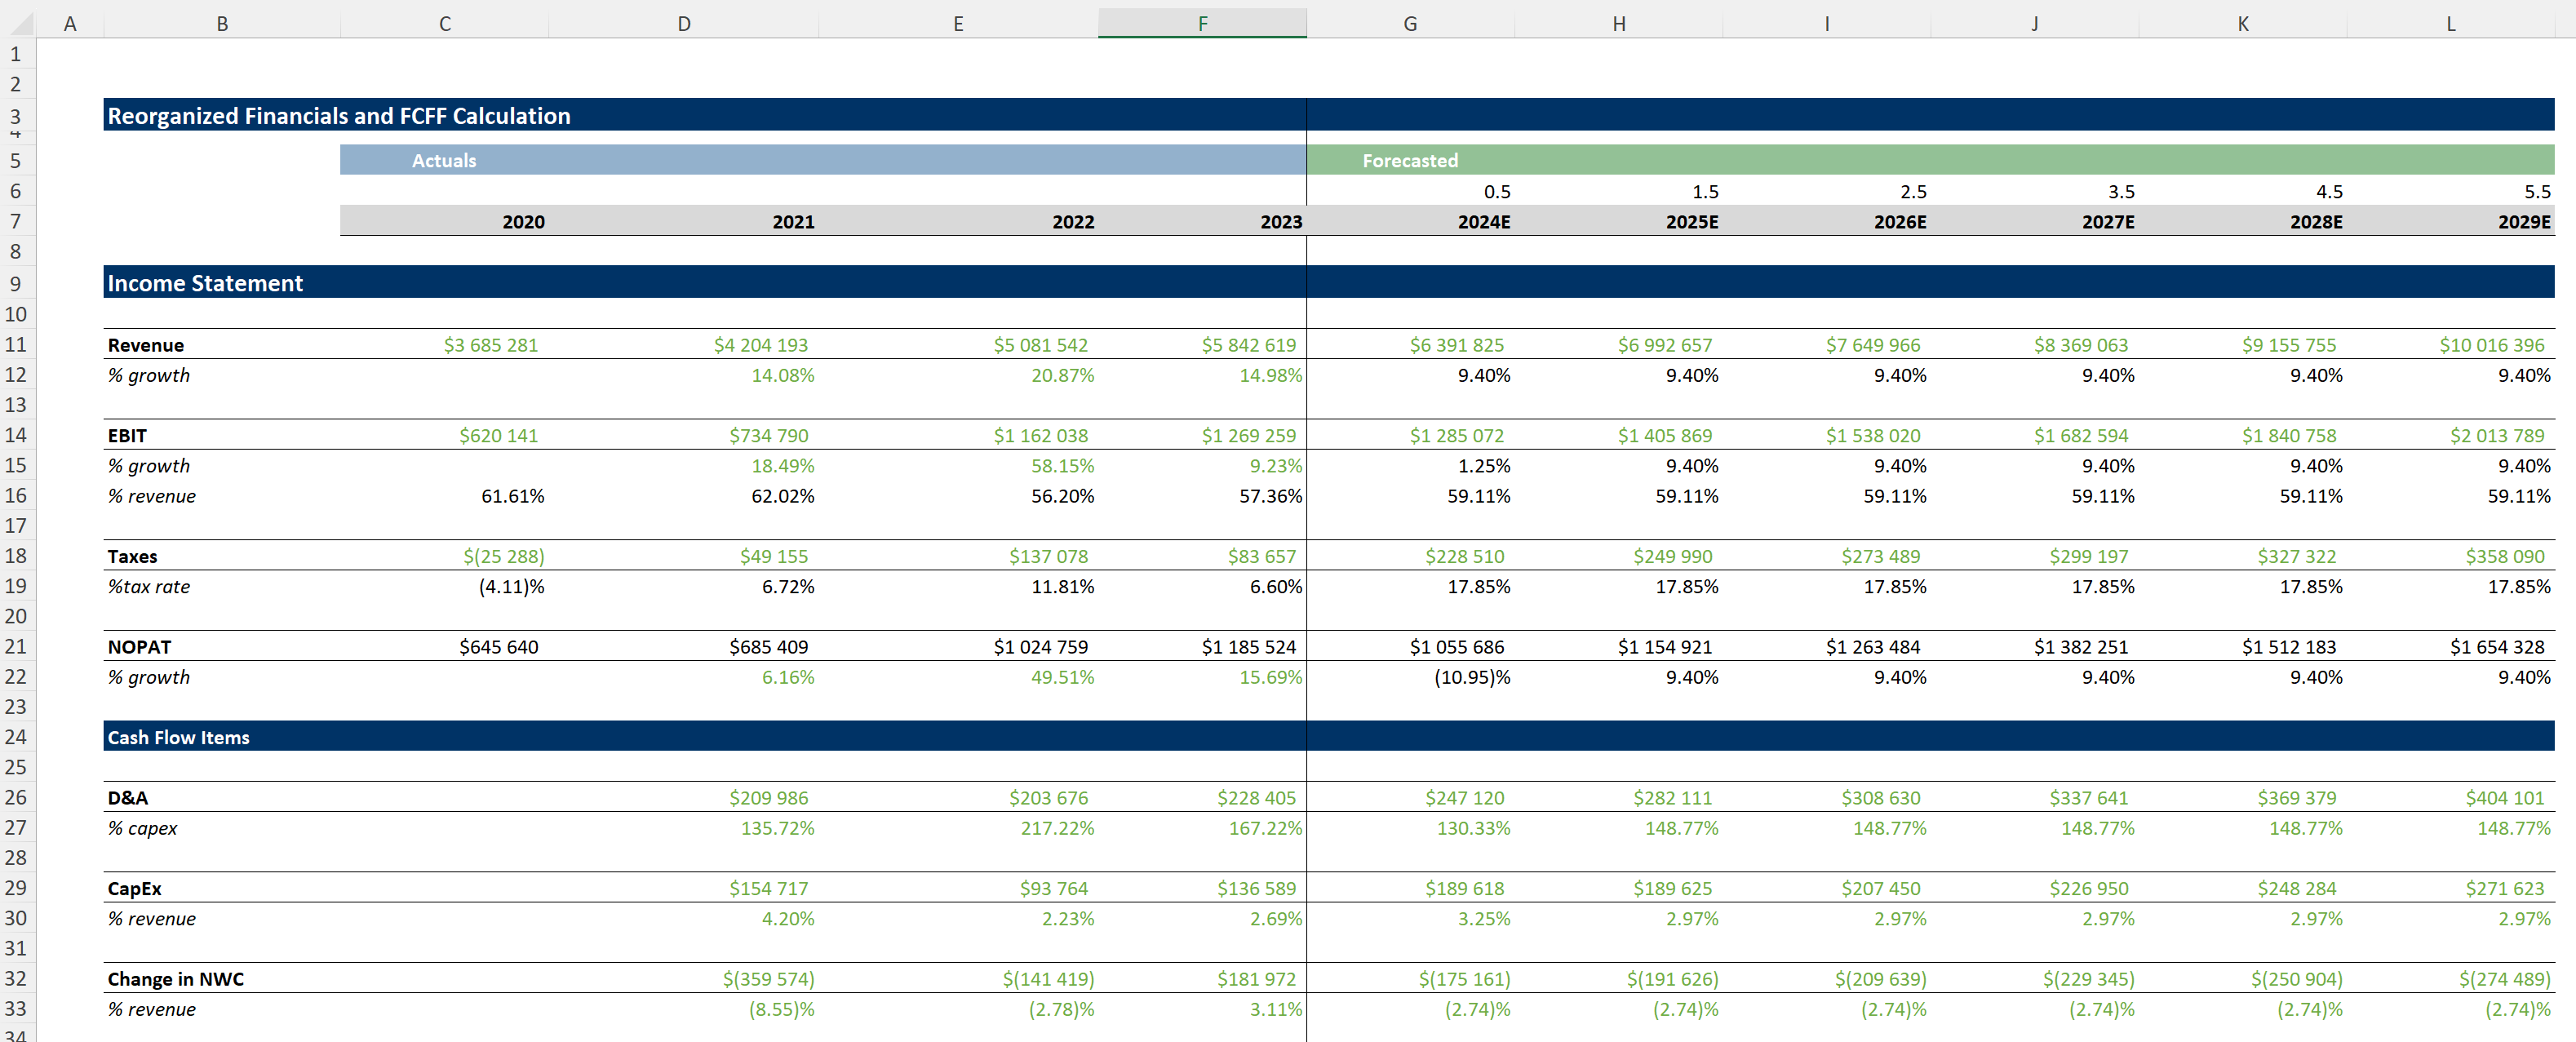
A DCF estimates firm value by projecting free cash flows and discounting them at the weighted average cost of capital (WACC), which reflects the opportunity cost for both debt and equity investors.
Key valuation drivers include unit economics, operating leverage and realistic assumptions on growth and margins. Sensitivity analysis is essential to reflect uncertainty.
Corporate buyers versus private equity sponsors
Corporate acquirers focus on strategic fit and synergies, while private equity sponsors are constrained by required internal rates of return (IRR) and money-on-money multiples (MOIC).
Despite different objectives, both rely on the same principle: when comparables are imperfect, the narrative behind the multiples matters more than the multiples themselves.
How to communicate limitations effectively
From the analyst’s perspective, the key is transparency. Clearly stating the limitations of the comps set and explaining the analytical choices strengthens credibility rather than weakening conclusions.
Useful resources
Damodaran, A. (NYU), Damodaran Online.
Rosenbaum, J. & Pearl, J. (2013), Investment Banking: Valuation, Leveraged Buyouts, and Mergers & Acquisitions, Wiley.
Koller, T., Goedhart, M. & Wessels, D. (2020), Valuation: Measuring and Managing the Value of Companies, McKinsey & Company, 7th edition.
About the author
This article was written in January 2025 by Ian DI MUZIO (ESSEC Business School, Master in Finance (MiF), 2025–2027).