High-frequency trading and limit orders

High-frequency trading and limit orders

Clara PINTO

In this article, Clara PINTO (ESSEC Business School, Master in Strategy & Management of International Business (SMIB), 2020-2023) explains about high frequency trading in a dynamic limit order market.

What is High-frequency trading (HFT)?

While the adage “time is money” applies to almost all economic operations, the rapid spread of computerized trading has carried this quote to its final extreme. High-frequency trading (HFT) is a type of algorithmic trading that relies on advanced computer programs to make trading decisions and execute trades in a matter of milliseconds. HFT has become increasingly popular in recent years, particularly in dynamic limit order markets (“A dynamic limit order market with fast and slow traders”, European Central Bank), where the bid and ask prices of securities are constantly changing. This allows them to take advantage of small price discrepancies in the market and generate profits on a large scale, this method known as statistical arbitrage, involves traders looking for temporary pricing inconsistencies across different exchanges and capitalize on it, using ultra-fast transactions.

What Exactly Is a Limit Order?

A limit order is an instruction to buy or sell a security at a specified price or better. For example, a trader may place a buy limit order for a stock at $50, meaning he or she is willing to buy the stock only if it is available at that price or lower. Similarly, a sell limit order may be placed at $60, meaning the trader will sell the stock only if the price is at that level or higher.

HTF and Limit Order

High-frequency trading (HFT) and limit orders are closely linked, as HFT traders often rely on limit orders to execute their trades. In fact, limit orders are a key component of many HFT trading strategies. HFT traders often use limit orders in conjunction with advanced algorithms to identify market trends and execute trades at lightning-fast speeds. They may place many limit orders at various prices to take advantage of small price movements in the market and use sophisticated algorithms to determine the best time to execute their trades.

However, the use of limit orders in HFT trading can also have downsides. For example, the large number of limit orders placed by HFT traders can lead to increased volatility in the market, as these orders can cause sudden price movements, for example flash crash when the prices of stocks or commodities suddenly plunges but then quickly recovers. Hence, the use of limit orders in HFT trading can also have downsides, and it is important for regulators to monitor HFT activity and ensure that it does not cause market instability or unfair trading practices.

Why should I be interested in this post?

For many business school students, finance and trading are part of the most preferred jobs. Understanding the trends in high-frequency trading is now a requirement for future institutional investors. Being quick allows traders to adjust outstanding limit orders in response to news arrivals when working with “slow” market players who experience a relative loss in bargaining power, leading them to strategically submit limit orders with a lower execution probability, limiting trade.

Related posts on the SimTrade blog

▶ Akshit GUPTA High-frequency trading

▶ Shruti CHAND High-frequency trading: pros and cons

▶ Akshit GUPTA Analysis of The Hummingbird Project movie

▶ Federico DE ROSSI Understanding the Order Book: How It Impacts Trading

Useful resources

SimTrade course Trade orders

Hoffmann P. (2013) A dynamic limit order market with fast and slow traders European Central Bank Working Paper Series.

Lewis M. (2015) Flash boys Norton & Company.

About the author

The article was written in March 2023 by Clara PINTO (ESSEC Business School, Master in Strategy & Management of International Business (SMIB), 2020-2023).

Understanding the Order Book: How It Impacts Trading

Understanding the Order Book: How It Impacts Trading

Federico De ROSSI

In this article, Federico DE ROSSI (ESSEC Business School, Master in Strategy & Management of International Business (SMIB), 2020-2023) talks about the order book and explains its role in financial markets.

Introduction

Understanding the order book is critical when it comes to trading in financial markets. In this article, we’ll go over what an order book is and how it affects trading.

What is an order book?

An order book for a stock, currency, or cryptocurrency is a list of buy and sell limit orders for that asset. It shows the pricing at which buyers and sellers are willing to negotiate, as well as the total number of orders available at each price. The order book is a necessary component of every trading platform since it gives a snapshot of the current market situation, of the price of the assets, and of the liquidity of the market. Thus, it is a crucial tool for traders who want to make informed decisions when entering or exiting deals.

How does an order book work?

The order book is a constantly updated record of buy and sell orders. When a trader puts a limit order, it is placed in the order book at the stated price. As a result, there is a two-sided market with distinct prices for buyers and sellers.

The order book is divided into two sections: bid (buy) and ask (sell). All open buy orders are displayed on the bid side, while all open sell orders are displayed on the ask side. The order book also shows the total volume of buy and sell orders at each price level.

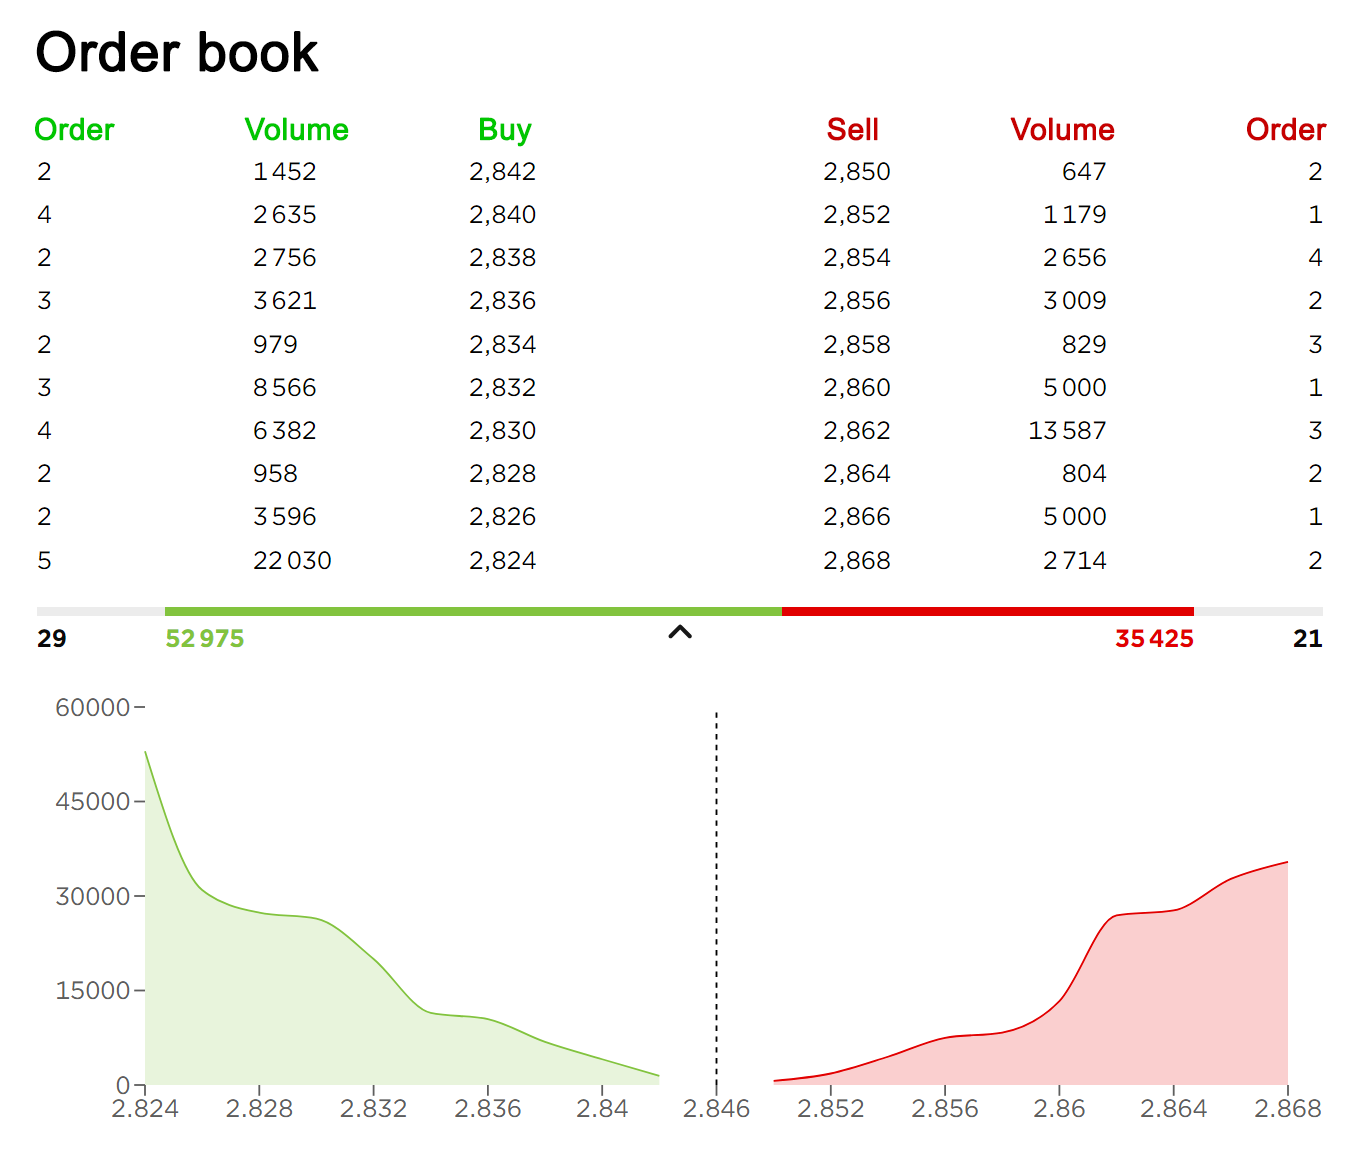
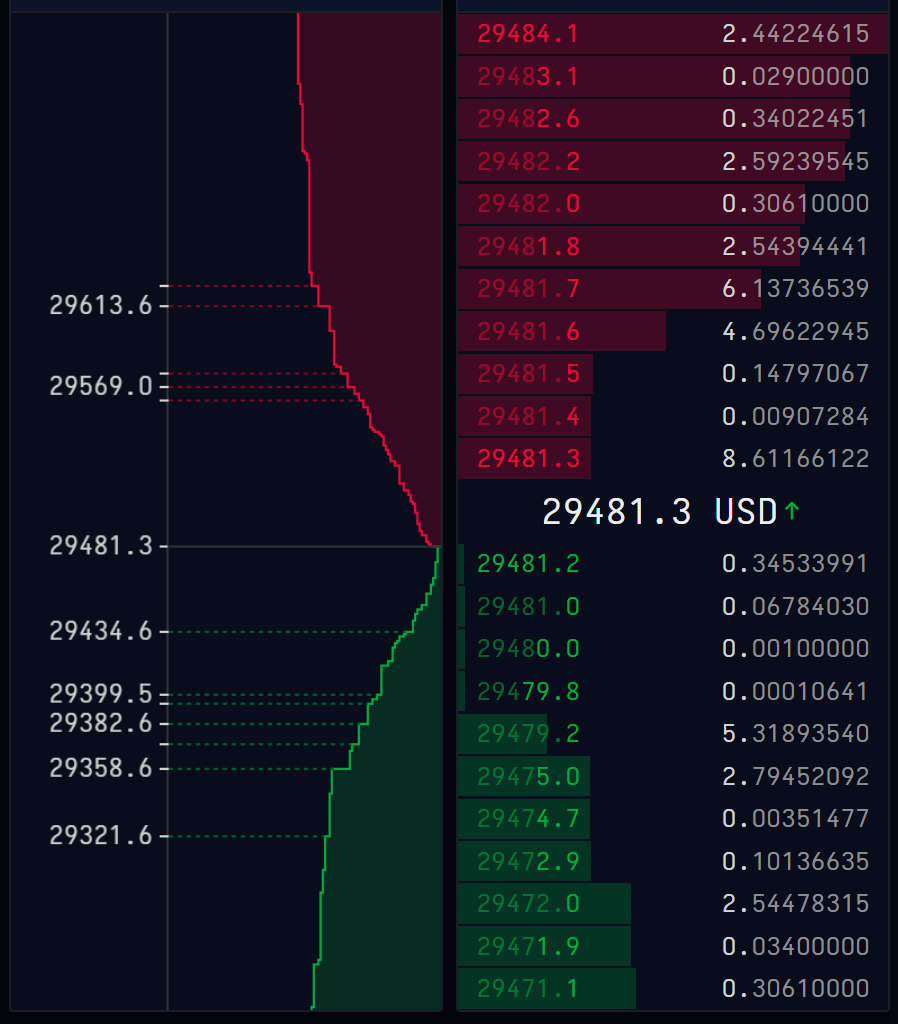
In Tables 1 and 2 below, we give below two examples of order book from online brokers. We can see the two parts of the order book side by side: the “Buy” part and the “Sell” part. Every line of the order book corresponds to a buy or sell proposition for a give price (“Buy” or “Sell” columns) and a given quantity (“Volume” columns). For a given line there may be one or more orders for the same price. When there are several orders, the quantity in the “Volume” column is equal to the sum of the quantities of the different orders. Associated to the order book, there is often a chart which indicates the cumulative quantity of the orders in the order book at a given price. This chart gives an indication of the liquidity of the market in terms of market spread, market breadth, and market depth (see below for more explanations about theses concepts).

The “Buy” and “Sell” parts of the order book can be presented side by side (Table 1) or above each other (Tables 2 and 3) with the “Sell” part (in red) above the “Buy” part (in green) as the price limits of the sell limit orders are always higher than the price limits of the buy limit orders.

Table 1. Example of an order book (buy and sell parts presented side by side).
Order book
Source: online broker (Fortuneo).

Table 2. Example of an order book (buy and sell parts presented above each other).
Order book
Source: online broker (Cryptowatch).

Table 3. Example of an order book (buy and sell parts presented next to each other).
Order book
Source: online broker (Binance).

In a typical order book, the buy side is organized in descending order, meaning that the highest buy orders (i.e., the orders with the highest bid prices) are listed first, followed by the lower buy orders in descending order of price. The highest buy order in the book represents the best bid price, which is the highest price that any buyer is currently willing to pay for the asset.

On the other side of the order book, the sell side is organized in ascending order, with the lowest sell orders (i.e., the orders with the lowest ask prices) listed first, followed by the higher sell orders in ascending order of price. The lowest sell order in the book represents the best ask price, which is the lowest price that any seller is currently willing to accept for the asset.

This organization of the order book makes it easy for traders to see the current market depth and the best available bid and ask prices for an asset. When a buy order is executed at the best ask price or a sell order is executed at the best bid price, the order book is updated in real-time to reflect the new market depth and the new best bid and ask prices.

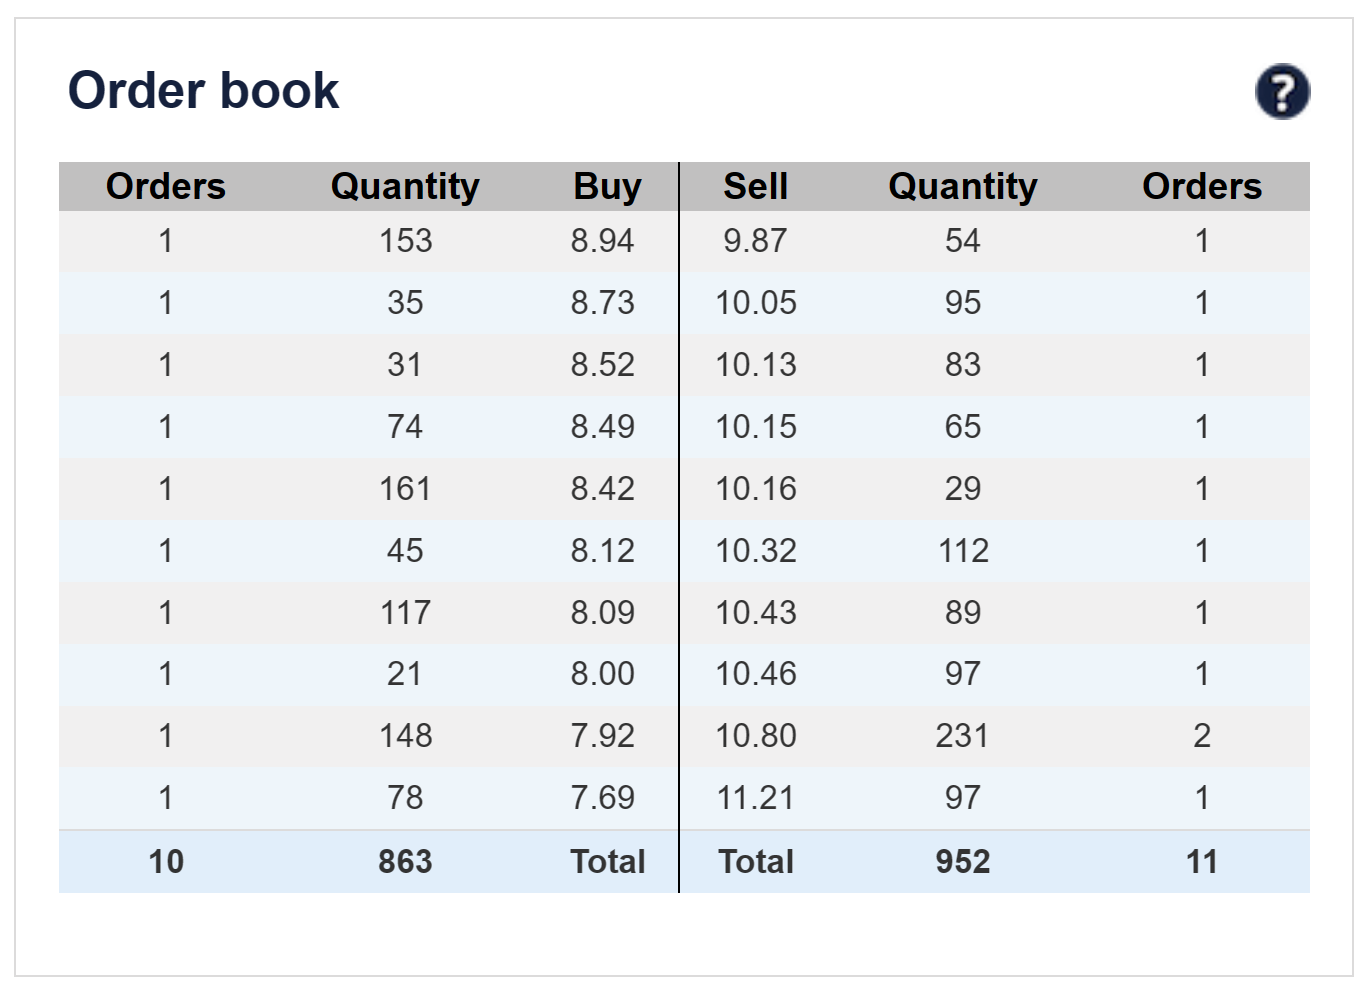
Table 4 below represents how the order book (limit order book) in trading simulations the SimTrade application.

Table 4. Order book in the SimTrade application.
Order book in the SimTrade application

You can understand how the order book works by launching a trading simulation on the SimTrade application.

The role of the order book in trading

As mentioned before, the order book is incredibly significant in trading. It acts as a market barometer, delivering real-time information about the supply and demand for an asset. Traders can also use the order book to determine market sentiment. If the bid side of the order book is strongly occupied, for example, it could imply that traders are optimistic on the asset. Thanks to the data in the order book, traders can get different information out of it.

Three characteristics of the order book

Market spread

The market spread, also known as the bid-ask spread, is the difference between the highest price a buyer is willing to pay for an asset (the bid price) and the lowest price a seller is willing to accept (the ask price) at a particular point in time.

The market spread is a reflection of the supply and demand for the asset in the market, and it represents the transaction cost of buying or selling the asset. In general, a narrow or tight spread indicates a liquid market with a high level of trading activity and a small transaction cost, while a wider spread suggests a less liquid market with lower trading activity and a higher transaction cost.

Market breadth

Market breadth is a measure of the overall health or direction of a market, sector, or index. It refers to the number of individual stocks that are participating in a market’s movement or trend, and can provide insight into the underlying strength or weakness of the market.

Market breadth is typically measured by comparing the number of advancing stocks (stocks that have increased in price) to the number of declining stocks (stocks that have decreased in price) over a given time period. This ratio is often expressed as a percentage or a ratio, with a higher percentage or ratio indicating a stronger market breadth and a lower percentage or ratio indicating weaker breadth.

For example, if there are 1,000 stocks in an index and 800 of them are increasing in price while 200 are decreasing, the market breadth ratio would be 4:1 or 80%. This would suggest that the market is broadly advancing, with a high number of stocks participating in the upward trend.

Market depth

Finally, market depth is a measure of the supply and demand of a security or financial instrument at different prices. It refers to the quantity of buy and sell orders that exist at different price levels in the market. Market depth is typically displayed in a market depth chart or order book.

It can provide valuable information to traders and investors about the current state of the market. A deep market with large quantities of buy and sell orders at various price levels can indicate a liquid market where trades can be executed quickly and with minimal impact on the market price. On the other hand, a shallow market with few orders at different price levels can indicate a less liquid market where trades may be more difficult to execute without significantly affecting the market price.

Analyzing order book data

Data from order books can be used to gain insight into market sentiment and trading opportunities. For example, traders can use the bid-ask spread to determine an asset’s liquidity. They can also examine the depth of the order book to determine the level of buying and selling interest in the asset. Traders can also use order book data to identify potential trading signals. For example, if the bid side of the order book is heavily populated at a certain price level, this could indicate that the asset’s price is likely to rise. On the other hand, if the ask side is heavily populated at a certain price level, it could indicate that the asset’s price is likely to fall.

Benefits of using order book data for trading

Using order book data can provide traders with a number of advantages.

For starters, it can be used to gauge market sentiment and identify potential trading opportunities.

Second, it can assist traders in more effectively managing risk. Traders can identify areas of support and resistance in order book data, which can then be used to set stop losses and take profits.

Finally, it can aid traders in the identification of potential trading signals. Traders can identify areas of potential buying and selling pressure in order book data, which can then be used to enter and exit trades.

How to use order book data for trading

Traders can use order book data to gain a competitive advantage in the markets. To accomplish this, they must first identify areas of support and resistance that can be used to set stop losses and profit targets.

Traders should also look for indications of buying and selling pressure in the order book. If the bid side of the order book is heavily populated at a certain price level, it could indicate that the asset’s price is likely to rise. On the other hand, if the ask side is heavily populated at a certain price level, it could indicate that the asset’s price is likely to fall.

Finally, traders should use trading software to automate their strategies. Trading bots can be set up to monitor order book data and execute trades based on it. This allows traders to capitalize on trading opportunities more quickly and efficiently.

Conclusion

To summarize, the order book is a vital instrument for financial market traders. It gives real-time information about an asset’s supply and demand, which can be used to gauge market mood and find potential trading opportunities. Traders can also utilize order book data to create stop losses and take profits and to automate their trading techniques. Traders might obtain an advantage in the markets by utilizing the power of the order book.

Related posts on the SimTrade blog

▶ Jayna MELWANI The impact of market orders on market liquidity

▶ Lokendra RATHORE Good-til-Cancelled (GTC) order and Immediate-or-Cancel (IOC) order

▶ Clara PINTO High-frequency trading and limit orders

▶ Akshit GUPTA Analysis of The Hummingbird Project movie

Useful resources

SimTrade course Trade orders

SimTrade course Market making

SimTrade simulations Market orders   Limit orders

About the author

The article was written in March 2023 by Federico DE ROSSI (ESSEC Business School, Master in Strategy & Management of International Business (SMIB), 2020-2023).

High-frequency trading: pros and cons

High-frequency trading: pros and cons

Shruti CHAND

In this article, Shruti CHAND (ESSEC Business School, Grande Ecole Program – Master in Management, 2020-2022) elaborates on the concept of high-frequency trading.

This read will help you get started with understanding high-frequency trading and how it is practiced in today’s world.

What is it?

As the name suggests, the use of computer programs to place a large number of trades in fractions of a second (even thousandths of a second) is high-frequency trading or HFT.

These powerful programs have complex algorithms behind them, which analyze market conditions and place buy/sell orders in accordance with that.

The Upside

HFT improves market liquidity by reducing the bid-ask spread. This was put to test by adding fees on HFT, and in turn, bis-ask spreads increased. A study assessed how Canadian bid-ask spreads changed on the introduction of fees on HFT by the government, and it was found that market-wide bid-ask spreads increased by 13% and the retail spreads increased by 9%.

Stock exchanges, such as the New York Stock Exchange, offer incentives to market makers to perform HFT with the motive of increasing liquidity in the market. As a result of these financial incentives, the institutions that provide liquidity also see increased profits on each trade made by them, on top of their spreads.

Although the spreads and incentives amount to only a fraction of a cent per trade, multiplying that by a large number of trades per day amounts to sizable profits for high-frequency traders. In January 2021, the average Supplemental Liquidity Providers rebate was $0.0012 for securities traded on the NYSE. With millions of transactions each day, this results in a large number of profits.

The Flip Side

At one point in time, you can imagine HFT companies to be in heavy competition with each other to be the fastest, at the top of the game. Trading companies did everything from eliminating any possible inefficiency in the passage of signals from their IT equipment to the stock exchange; to relying on crunching more data to have an upper hand over their rivals. The boom years of this practice were in 2008 and 2009 when the difference between slower trading systems and the high-tech faster ones were in seconds. Now, all rivals have caught up and it is not as profitable of a business as it once was.

Besides this, HFT is also controversial and is faced with harsh criticism regarding ethical issues and their impact on market liquidity and market volatility as explained below.

Why is HFT criticized?

Critics believe HFT to be unethical. In their view, stock markets are supposed to offer a fair and level playing field, which HFT arguably disrupts as the technology can be used for ultra-short-term strategies. It has closed businesses for many broker-dealers; HFT is seen as an unfair advantage for large firms against smaller investors.

HFT is also said to provide ‘ghost liquidity’ i.e. the liquidity created by HFT in one second can be gone the next second, preventing traders from actually making use of the liquidity.

Moreover, a substantial body of research argues that HFT and electronic trading pose new kinds of challenges to the stability of financial markets. Algorithmic and high-frequency traders were both found to have had a contribution to volatility in the Flash Crash of May 2010, when high-frequency liquidity providers rapidly withdrew from the market. Several European countries have proposed restricting or fully banning HFT due to concerns about volatility.

Conclusion

It is very important to bear in mind the risk involved with high-frequency trading. With practice, you can become an expert, use SimTrade course to better your understanding about the financial markets to become a high-frequency trader.

Related posts on the SimTrade blog

   ▶ Akshit GUPTA High-frequency trading

   ▶ Akshit GUPTA Analysis of The Hummingbird Project movie

   ▶ Shruti CHAND Algorithmic trading

   ▶ Youssef LOURAOUI Quantitative equity investing

Relevance to the SimTrade certificate

This post deals with High-Frequency Trading which is used by various traders and investors in different instruments. This can be learned in the SimTrade Certificate:

About theory

  • By taking the market orders course , you will know more about how investors can use various strategies to invest in order to trade in the market.

Take SimTrade courses

About practice

  • By launching the series of Market maker simulations, you can extend your learning about financial markets and trading approaches.

Take SimTrade courses

About the author

Article written in August 2021 by Shruti CHAND (ESSEC Business School, Grande Ecole Program – Master in Management, 2020-2022).

Analysis of The Hummingbird Project movie

Analysis of The Hummingbird Project movie

Akshit GUPTA

This article written by Akshit GUPTA (ESSEC Business School, Grande Ecole Program – Master in Management, 2019-2022) analyzes The Hummingbird Project movie.

Analysis of the movie

Also known as The Wall Street Project, the Canadian movie was released in 2018 featuring the evolution of high frequency trading and ultra-low latency direct market access (DMA) in one of the most developed financial markets in the world. The name ‘The Hummingbird Project’ is well suited as it relates to the time a hummingbird’s wing takes to beat. The title of the film impeccably connects with the project the movie is based upon. The movie portrays how the line between success and failure is sometimes very thin. It correlates with the SimTrade course as it teaches us how to make use of technology in markets and stay ahead of others.

25423-1775808

Summary of the movie

The The Hummingbird Project movie starts by presenting Mr. Vincent Zaleski, a stockbroker working for Eva Torres, keen on convincing Mr. Bryan Taylor, an investor, on investing in his idea of installing fiber optic cables between the Kansas Stock Exchange and the New York Stock Exchange, at a distance of approximately 1,000 miles, to front-run the orders into the system giving a time benefit of at least 1 millisecond. The high frequency trading operation would have led to an increase in profits by millions of dollars.

Buying into Vincent’s idea, Mr. Bryan shows his faith in him. In order to execute the plan, Vincent convinces his cousin Anton Zaleski, a genius programmer, to resign from their current stockbroking firm, owned by Eva Torres, and work tirelessly to achieve the new feat.

Both the brothers start working on their dream project with Anton handling the technical aspects of the technology of improving his previously coded software and Vincent working on the ground for the installation of the fiber optic cables. Anton has previously coded a software that had the capability to run trades in 17 milliseconds and now, it is required to be brought below 16 milliseconds in order to gain from the system. Since success doesn’t come easy, they encounter many difficulties in attaining their dream.

Meanwhile, Eva becomes aware of their dream project and threatens Anton against using the proprietary software he developed while working for Eva. She also finds a student, at New York University, who wrote a research paper on boosting high-frequency trading using microwave pulses. Seeing a chance to beat Vincent and Anton, Eva immediately hires the student and begins with the building of a series of cell towers to make trades using microwave pulses. As a revenge for deceiving her, Eva gets Anton arrested by the FBI under charges of stock market fraud of utilizing proprietary software owned by Eva’s company.

While Vincent struggles with the digging and the installation of the cables, Eva’s company starts their operations using the microwave impulses, and thus, the front runs the market. Meanwhile, Anton being furious with the arrest unwinds a bug that he has installed in the software, used at Eva’s company, which results in a 20 second slowdown in the high-frequency trades leading to losses of millions of dollars. In order to regain access to her system and save her company, Eva agrees to take back the charges against Anton.

Due to delays and an unforeseen health condition, Vincent fails to roll out his fiber optics project resulting in losses to the investor.

The movie ends with Anton introducing a new idea to his cousin which can bring down the processing time to 9 milliseconds, named neutrino messaging.

Relevance to the SimTrade course

The The Hummingbird Project movie perfectly blends with the structure of present-day financial markets and shows how in just a matter of a few seconds, a person can gain or lose a great fortune. The concepts taught in the movie deals with ‘High-Frequency Trading’ and ‘Direct Market Access’ which are relatively new. These correlate with the courses on exchanging orders and market makers in the SimTrade course. These orders, if executed at ultra-high speed, can help in bringing liquidity to the market and narrow the bid-ask spread. If applied with great precision and knowledge, a trader can earn big fortunes using high-frequency trading which is changing the face of financial markets.

Most famous quotes from the movie

“But the thing is, if all traders use the same system, and have the same information, how do you beat the others? By having the fastest line” – Anton Zaleski

“High speed is not our priority. We don’t believe that making things faster makes things better.” – The Amish guy

“One millisecond faster!” – Anton Zaleski

Trailer of the movie

Related posts on the SimTrade blog

   ▶ All posts about Movies and documentaries

   ▶ Akshit GUPTA Trader: job description

   ▶ Akshit GUPTA Wall Street: Money Never Sleeps (2010)

   ▶ Akshit GUPTA High-frequency trading

   ▶ Federico DE ROSSI Understanding the Order Book: How It Impacts Trading

About the author

Article written in October 2020 by Akshit GUPTA (ESSEC Business School, Grande Ecole Program – Master in Management, 2019-2022).