
The Yield Curve

In this article, Ziqian ZONG (ESSEC Business School, Global BBA exchange, 2024) presents a comprehensive overview of the yield curve and its importance in bond markets. The article also explores the different types of Treasury securities and the various term structures of yield curves.
This article is structured as follows: we start with an introduction to the concept of the yield curve. Then, we discuss the types of Treasury securities and the different term structures of yield curves. Next, we delve into the reasons for different yield spreads and the importance of the yield curve. Finally, we explain the phenomenon of the inverted yield curve and its implications.
Introduction
The yield curve is a fundamental concept in bond markets that depicts the relationship between interest rates (or yields) and different maturities of debt securities, typically government bonds. It is a powerful tool for analyzing the economic outlook, making investment decisions, and pricing bonds.
The type of the yield curve
The term structure of the yield curve shows the yields of bonds with equal credit quality but different maturity dates. It provides a snapshot of how interest rates vary over short, medium, and long-term maturities. For example, there is a yield curve for the securities issued by the government in each country. In the United States, Treasury securities, issued by the U.S. Department of the Treasury, are called according to their maturity: Treasury bills, Treasury notes, and Treasury bonds.
Treasury Bills (T-Bills)
Treasury bills (T-Bills) are short-term securities with maturities of one year or less. They do not pay periodic interest; instead, they are sold at a discount from their face value, and the interest earned is the difference between the purchase price and the face value paid at maturity. T-Bills are primarily used for short-term government financing needs and generally offer lower yields due to their shorter maturities and lower risk of interest rate fluctuations.
Treasury Notes (T-Notes)
Treasury notes (T-Notes) are medium-term securities with maturities ranging from two to ten years. They pay semi-annual interest at a fixed rate and return the face value at maturity. T-Notes are used for intermediate-term government financing and typically offer higher yields than T-Bills, reflecting the increased risk associated with a longer investment period.
Treasury Bonds (T-Bonds)
Treasury bonds (T-Bonds) are long-term securities with maturities exceeding ten years, often up to 30 years. They also pay semi-annual interest at a fixed rate and return the face value at maturity. T-Bonds are utilized for long-term government financing and offer the highest yields among the three types of Treasury securities, compensating investors for the longer maturity and greater interest rate risk.
Figure 1 below gives the yield curve for the Treasuries in the United States on June 28, 2024.
Yield curve for US Treasuries (28/06/2024)
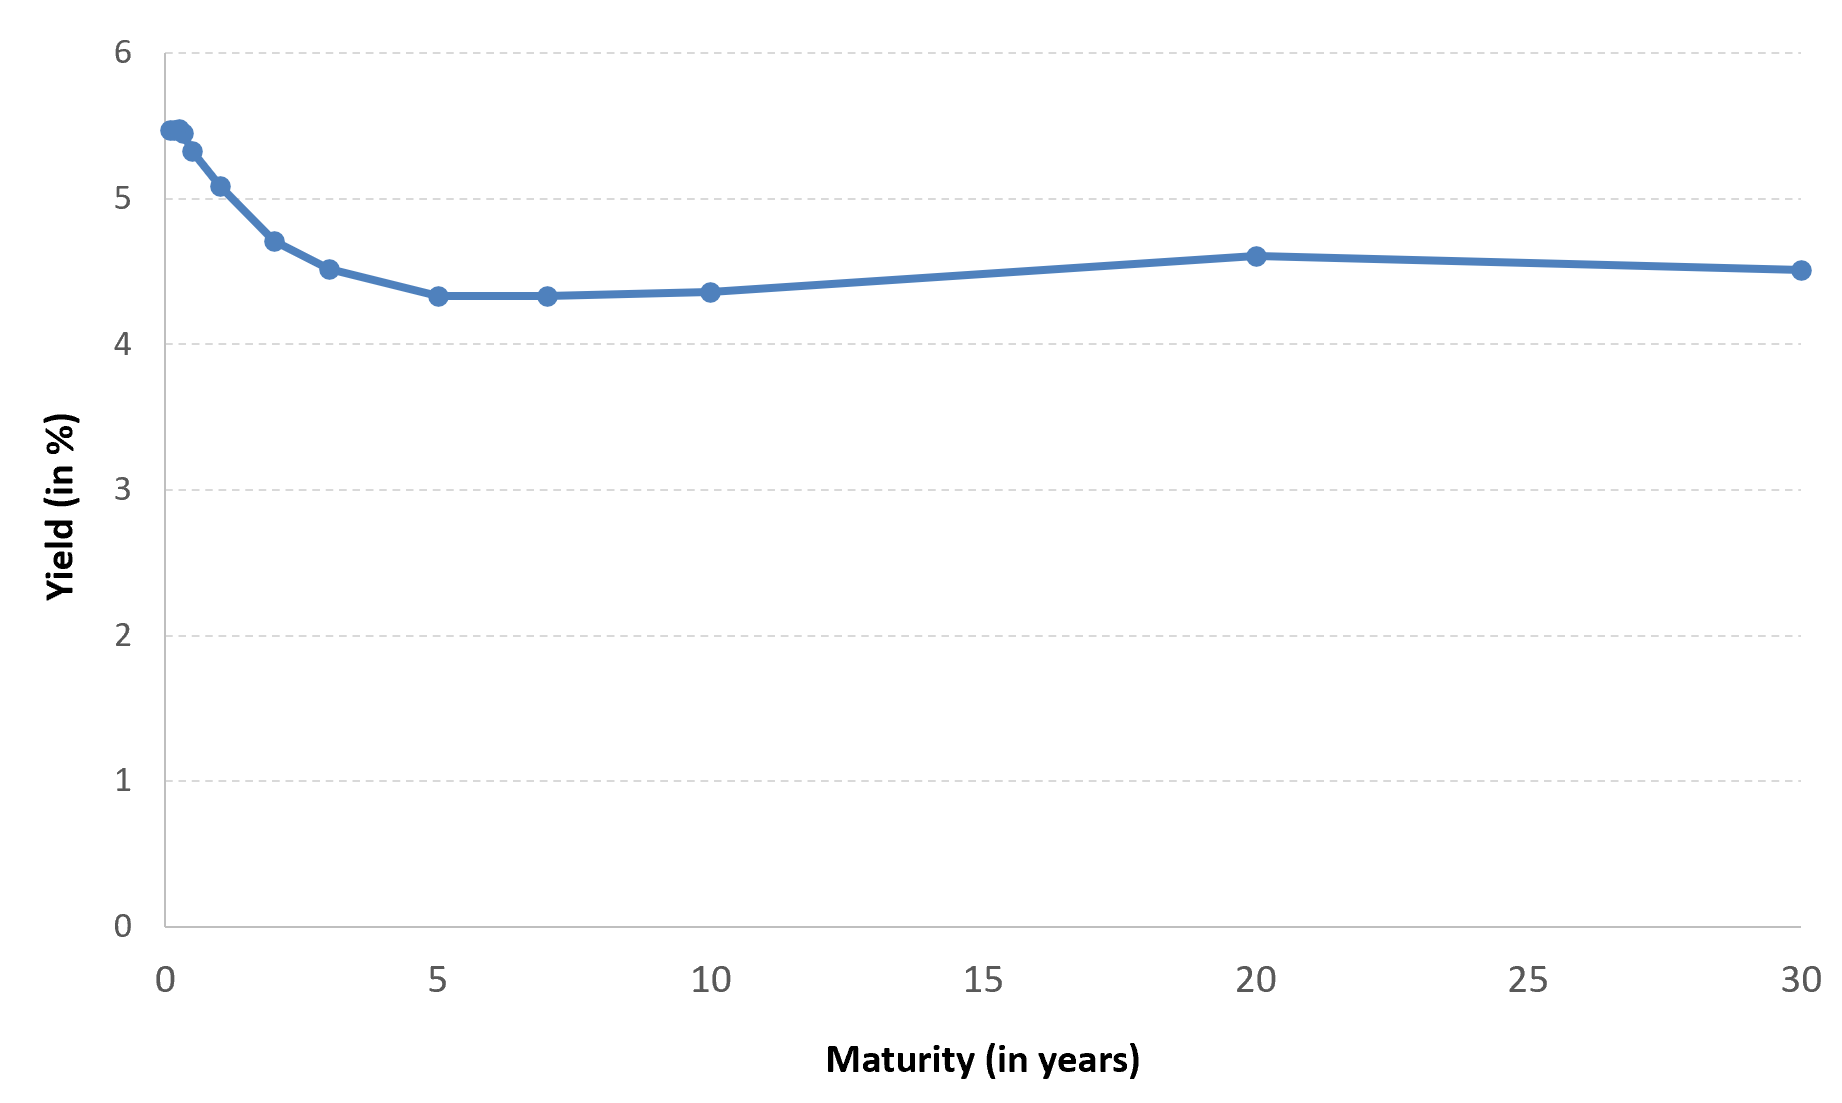
Source: U.S. Department of Treasury
You can download below the Excel file for the data used to build the figure for the yield curve for US Treasuries.

Different types of yield curves
Normal Yield Curve
This upward-sloping curve indicates that longer-term bonds have higher yields to maturity (YTM) than shorter-term bonds. This shape reflects expectations of rising interest rates and economic growth, as investors demand higher returns for locking in their money over a longer period.
Inverted Yield Curve
This downward-sloping curve occurs when shorter-term bonds have higher YTM than longer-term bonds. This unusual situation often signals an impending economic recession, as investors expect future interest rates to decline.
Flat Yield Curve
When YTM across various maturities are similar, it suggests economic uncertainty, with no clear direction for future interest rates. Investors are indifferent to holding bonds of different maturities, reflecting mixed signals about future economic conditions.
Hump-Shaped Yield Curve
This curve shows higher YTM for medium-term bonds compared to both short-term and long-term bonds. This shape, often referred to as a “hump,” can indicate specific market conditions, such as expectations of moderate economic growth or short-term inflation pressures. This leads to increased demand for intermediate-term securities like T-Notes, pushing up their yields relative to both short-term and long-term bonds.
Figure 2 below gives different types of yield curves.
Types of yield curves
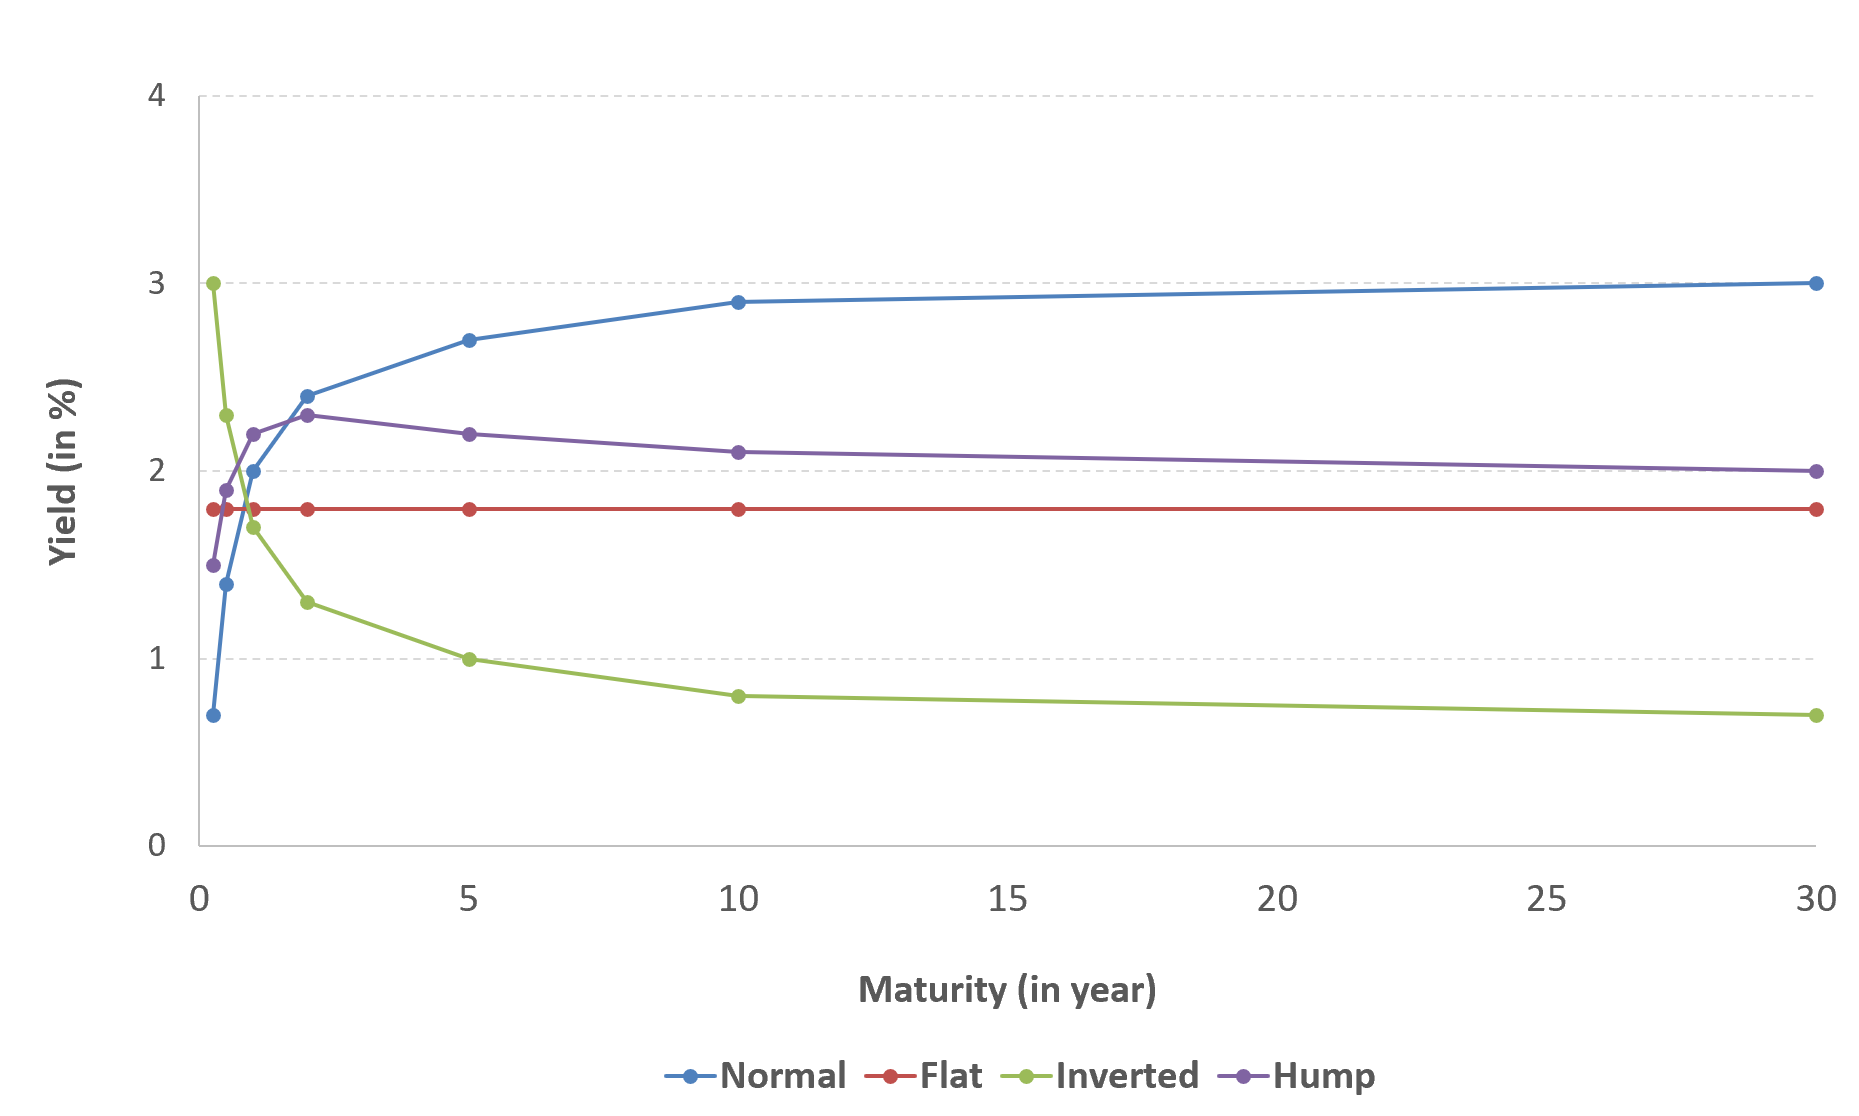
Source: Ziqian ZONG
You can download below the Excel file used to build the figure for the different types of yield curve.
Reasons for different yield spreads
Market expectations of future interest rates play a crucial role in shaping the yield curve. The link between spot rates (current interest rates for immediate borrowing or lending) and forward rates (expected future interest rates) is essential in this analysis. In a two-period model, for example, the yield on a two-year bond can be seen as a combination of the yield on a one-year bond today and the expected yield on a one-year bond one year from now. This relationship helps investors infer the market’s expectations of future rates from the current yield curve.
The term premium, which compensates investors for the risk associated with holding longer-term securities, also plays a crucial role in shaping the yield curve. Changes in risk aversion and market uncertainty can lead to fluctuations in the term premium, which in turn can affect the slope of the yield curve independently of monetary policy actions. When investors perceive higher risks, they demand a higher term premium, causing long-term yields to rise relative to short-term yields. Conversely, when market uncertainty decreases, the term premium declines, potentially flattening or inverting the yield curve even if central bank policies remain unchanged.
Importance of the Yield Curve
The yield curve serves as a crucial barometer for various aspects of the financial markets, providing insights into economic conditions, guiding investment decisions, and informing monetary policy.
The shape of the yield curve is a widely recognized predictor of economic growth or recession. Historically, an inverted yield curve, where short-term yields exceed long-term yields, has often preceded economic recessions. For example, prior to the 2008 financial crisis, the yield curve inverted in late 2006 and early 2007, signaling the forthcoming downturn. However, it’s important to note exceptions, such as the 1966 and 1998 inversions, which did not lead to immediate recessions, illustrating that while the yield curve is a powerful tool, it is not infallible.
Investors closely monitor the yield curve to determine the relative attractiveness of short-term versus long-term investments. A steep yield curve, where long-term yields are significantly higher than short-term yields, suggests expectations of economic growth and inflation, encouraging investment in long-term bonds. Conversely, a flat or inverted yield curve might indicate economic uncertainty or a potential recession, prompting investors to favor shorter-term securities. For instance, during the late 1990s dot-com bubble, the yield curve flattened, signaling caution and influencing investment strategies towards shorter maturities.
Central banks, such as the Federal Reserve, scrutinize the yield curve to gauge the impact and effectiveness of their monetary policies. A steepening yield curve often signals that monetary easing, such as lowering interest rates, may be warranted to stimulate economic growth. Conversely, a flattening or inverted yield curve can indicate that monetary tightening is needed to curb inflation. For example, in the early 1980s, the Federal Reserve, under Chairman Paul Volcker, aggressively raised short-term interest rates to combat inflation, leading to a significant inversion of the yield curve.
The Inverted Yield Curve
An inverted yield curve is a financial phenomenon where short-term interest rates surpass long-term rates. An inversion of this curve is seen as an anomaly and is closely monitored by economists and investors for its historical role as a predictor of economic recessions.
Common Indicators to Measure Yield Curve Inversion
10-Year Treasury Note vs. 1-Year Treasury Note is one of the most commonly used indicators to measure the yield curve. It compares the yield on the 10-year U.S. Treasury note with the yield on the 1-year U.S. Treasury note.
Reasons for Inversion
- Monetary Policy: When central banks raise short-term interest rates to combat inflation, it can lead to an inverted yield curve.
- Economic Expectations: Investors may expect slower economic growth or a recession, leading them to prefer long-term bonds for their perceived safety, driving down long-term yields.
Why should I be interested in this post?
Understanding the yield curve is essential for analyzing economic conditions, making informed investment decisions, and understanding market expectations. This article provides valuable insights into how interest rates affect the bond market and the broader economy, offering practical knowledge for anyone involved in finance or investment.
Related posts on the SimTrade blog
▶ Ziqian ZONG My experience as a Quantitative Investment Intern in Fortune Sg Fund Management
▶ Georges WAUBERT Bond markets
▶ Jayati WALIA Fixed-income products
Useful resources
Academic resources
Fabozzi, F.J., & Mann, S.V. (2012) Appendix 2: Yield Curves. In The Handbook of Fixed Income Securities (8th ed.). Wiley.
Business resources
U.S. Department of the Treasury. Interest Rate Statistics.
About the author
The article was written in July 2024 by Ziqian ZONG (ESSEC Business School, Global BBA exchange, 2024).