Contracts for Difference

Contracts for Difference

Isaac ALLIALI

In this article, Isaac ALLIALI (ESSEC Business School, Global Bachelor in Business Administration (GBBA), 2019-2023) explains the Contracts for Difference (CFD).

Understanding CFDs

Although banned in the US and for US citizens, the Contract for Difference (CFD) is a relatively new contract, introduced in the 1990s in Great Britain, to allow operators without permission to sell shares short, to speculate on the market’s decline. CFDs were originally based on equity swaps, which allow the exchange of the performance of a stock or stock index for an interest rate. Initially reserved for institutional investors, CFDs were later made available to individual investors and recognized by a directive from the European Union in 2004. Soon after, they gained popularity and rapidly developed in the OTC market. In contrast to centralized exchanges, the “Over The Counter” market facilitates trades directly between participants, offering flexibility for unique financial instruments and fostering niche investment opportunities. While lacking the structure of exchanges, OTC markets play a crucial role in diverse financing needs.

The contract for difference (CFD) is a very popular derivative, which essentially establishes a bilateral agreement between an investor and a broker. This contract does not grant the investor ownership of the underlying asset, but rather the right to receive the difference between the contract’s opening and closing price. Unlike contracts with an expiry date, a CFD is effectively renewed at the closing of each trading day and can be extended forward if desired; you can keep your position open indefinitely as long as there is enough margin in your account to maintain it.

In essence, contracts for differences are very similar to futures with no expiration date. While the contract remains open, your account with the provider will be debited or credited to reflect the interest and dividend alterations. The broker may offer leverage of up to 400 which serves as a powerful tool for amplifying possible financial gains (and losses). Through leveraging, the investor can gain control over a larger position than their initial capital would allow. For instance, if you have €100 in your account and a leverage of 10, you take a position of €1,000 (10*100).CFDs offer great flexibility to investors, CFDs provide investors with great flexibility, offering the ability to:

  • Speculate on a wide range of assets, including stocks, indices, currencies, commodities, etc.
  • Take advantage of market movements, whether upwards or downwards: enabling both buying and selling positions
  • Hedge an investment portfolio, using CFDs, which serve as a safeguard against price declines.
  • Execute advanced trading strategies.

Mechanics of CFD Trading

Opening a CFD position involves several steps. Firstly, traders choose an asset they wish to trade, such as stocks, commodities, or currencies. Secondly, they decide whether to go long (buy) or short (sell) on the asset, basing their decision on their market analysis and expectations for future price movements. Traders also determine the quantity of the asset they want to trade, which can be specified in terms of contracts or units, depending on the CFD provider. CFDs are not standardized products and every CFD broker has their own terms and conditions. Once the initial decisions have been made, the CFD provider calculates the price at which the trade will be executed. This price is typically derived from the market value of the underlying asset, taking into consideration various factors such as supply and demand dynamics, economic data, and market sentiment. The CFD provider may also incorporate a spread into the market price, which represents their profit margin. Margin requirements play a crucial role in opening and maintaining a CFD position. Traders are required to deposit a percentage of the total trade value as collateral, referred to as a margin. This ensures that traders can cover potential losses stemming from adverse price fluctuations. Margin requirements vary depending on factors such as the volatility of the underlying asset and regulatory requirements. Upon opening a position, the value of the CFD fluctuates in accordance to the underlying asset’s price movements. When traders decide to close their position, they execute an opposing trade to offset their initial position. The profit or loss from the trade is calculated based on the price difference between the opening and closing trades, adjusted for any transaction costs.

CFD trading involves various costs and fees that traders should be aware of. Spreads, representing the difference between buy and sell prices, are the primary revenue source for CFD providers and affect trading costs. Narrower spreads typically mean lower costs. Additionally, traders may face overnight financing charges for holding positions, which are influenced by factors such as the asset class and prevailing interest rates. Furthermore, some providers charge commissions on trades, based on elements such as the trading volume. Taking these costs into consideration is crucial for assessing overall profitability and developing effective trading strategies.

Application in the energy industry

NEOEN and BNRG have finalized the financing of three solar power plants in the Republic of Ireland: Hilltown, Hortland, and Millvale, located respectively in the counties of Meath, Kildare, and Wicklow. These plants, with a total capacity of 58 MWc, are among the first large-scale solar projects in the country. As the winners of the first governmental tender for solar power plants in 2020, they benefit from financial support from the Irish government through a Contract for Difference (CFD) mechanism until 2037, ensuring a stable price for the electricity generated. The financing, estimated at 39 million euros excluding financing costs, is provided by NEOEN and BNRG’s equity, alongside non-recourse senior debt from Société Générale. Construction works, awarded to Omexom, are expected to be completed in the first half of 2022,with plant commissioning set/scheduled for the same period. Once operational, these plants will supply the equivalent of 12,700 Irish households with clean electricity, thereby contributing significantly to the country’s energy transition.

Hilltown Solar farm
 Hilltown Solar Farm
Source: BNRG

Millwale Solar farm
Millwale Solar farm
Source: BNRG

Related posts on the SimTrade blog

   ▶ Akshit GUPTA Short selling

   ▶ Alexandre VERLET Understanding financial derivatives: swaps

Useful resources

AMF Les CFD (contracts for difference)

BNRG

Neoen

Neoen (12/08/2021) Neoen et BNRG clôturent le financement de trois centrales solaires (58 MWc) en République d’Irlande

Dupuy, P., Fontaine, P. & Hamet, J. (2018). Chapitre 6. Les marchés dérivés et la gestion du risque. Dans : , P. Dupuy, P. Fontaine & J. Hamet (Dir), Les marchés de capitaux français (pp. 153-204). Caen: EMS Editions.

About the author

The article was written in February 2024 by Isaac ALLIALI (ESSEC Business School, Global Bachelor in Business Administration (GBBA), 2019-2023).

The Magnificent Seven

The Magnificent Seven

Isaac ALLIALI

In this article, Isaac ALLIALI (ESSEC Business School, Global Bachelor in Business Administration (GBBA), 2019-2023) presents the “magnificent seven”, the Nasdaq’s top seven performing companies and most important market capitalization.

The SEVEN

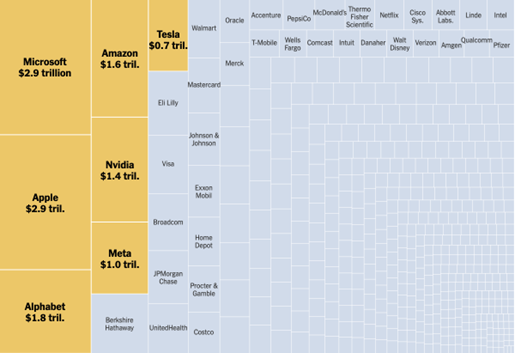
“These Seven Tech Stocks Are Driving the Market” is the headline of a New York Times issue on the 22nd of January 2024. The article spotlights the lasting growth of the “Magnificent Seven”, an expression coined by Bank of America analyst Michael Hartnett in 2023, directly referring to a group of very well-performing American companies such as Tesla, Nvidia, Apple, Microsoft, Alphabet, Meta and Amazon. These companies have seen exponential growth since economists first witnessed their joint boom last year, and as of January 19th 2024, the magnificent seven represent 29% of the S&P 500’s market value. The objective of this post is to introduce these companies, diving into their organization and structure as well as comparing their performances to conjecture on what the future may hold.

Market Value of S&P 500 companies. The Magnificent 7
Source: The New York Times

Origin of the expression

The expression “The Seven Magnificent” in financial markets is inspired by the classic Western film The Magnificent Seven (1960), itself a remake of Akira Kurosawa’s Seven Samurai (1954). In the original Japanese film, a village under threat from bandits hires seven samurai to protect them, symbolizing strength, strategy, and resilience in the face of adversity. This cinematic legacy has been adapted to financial markets to refer to a group of dominant stocks—typically the largest and most influential technology companies—that drive market performance. These firms, often characterized by their innovation, market capitalization, and economic influence, act as the “protectors” of market indices, much like the samurai or gunfighters in their respective films. The term reflects both admiration for their strength and an acknowledgment of their outsized impact on global finance.

The Nasdaq’s top 7 performing Companies

The “Magnificent Seven” have captivated investors with their meteoric rise, consistently eclipsing the broader market. But to decipher their future trajectory, we must delve deeper into their individual narratives:

Apple

This Cupertino-based company has mastered the art of premium hardware integration. Its sleek iPhones, Macs and wearables seamlessly interact with its robust software ecosystem (iOS, macOS), fostering a loyal customer base and enviable profit margins. Q4 2023 witnessed remarkable financial performance, with strong revenue and profit growth solidifying its leadership position. However, intensifying competition from Android players and regulatory scrutiny regarding App Store practices and data privacy threaten its dominance. While its valuation remains high, Apple’s brand strength, innovation pipeline, and loyal customer base suggest continued prosperity, provided it navigates these challenges deftly.

Logo of Apple Inc.

 Logo of Apple Inc
Source: the company.

Microsoft

This software giant has transformed itself from a desktop pioneer into a cloud computing powerhouse. Its Azure platform has become a formidable competitor against Amazon Web Services, while its productivity suite (Office 365) remains a staple for businesses. Q3 2023 further emphasized its strong momentum with robust financial performance. While Google Cloud Platform and Amazon Web Services pose significant competition, Microsoft’s established enterprise partnerships and focus on digital transformation grant it a strategic advantage. Its valuation, though high, reflects its consistent growth trajectory and potential for further expansion in the cloud and enterprise spheres. However, regulatory scrutiny regarding anti-competitive practices remains a key risk factor.

Logo of Microsoft Corporation
 Logo of Microsoft Corporation
Source: the company.

Alphabet (Google)

The ubiquitous search engine and advertising giant monetizes vast user data through its search engine, YouTube platform, and Android operating system. Q3 2023 showcased impressive profits, fueled by continued dominance in online advertising. However, its data collection practices, and potential antitrust concerns create a cloud of uncertainty. While competition from Apple and Amazon in advertising and e-commerce intensifies, Google’s advancements in artificial intelligence and its foray into cloud computing offer promising prospects for the company’s future growth and innovation. Its valuation reflects its growth potential, but regulatory headwinds demand careful consideration before investing.

Logo of Alphabet
Logo of Alphabet
Source: the company.

Meta (Facebook)

This social media titan connects billions of users through its Facebook, Instagram, and WhatsApp platforms. Recent financial performance showcases modest growth, with investments in the metaverse impacting its bottom line. While the potential of the metaverse remains captivating, its success is far from guaranteed. Additionally, competition from TikTok and regulatory pressure regarding data privacy and anti-competitive practices pose significant challenges. Indeed, the Senate Judiciary Committee held a hearing this past Wednesday 31st of January 2024, where, after being pressured by Senator Josh Hawley, Republican of Missouri, Mark Zuckerberg, the CEO of Meta, apologized for the harm caused by his group. Mr. Zuckerberg stood from his chair, turned around and addressed families of victims in the audience who had suffered abuse on Meta’s apps. Meta’s high valuation reflects the risk-reward equation associated with its ambitious metaverse gamble. Investors should carefully weigh the potential rewards against the inherent uncertainties before making any investment decisions.

Logo of Meta
Logo of Meta
Source: the company.

Amazon

The undisputed king of e-commerce, Amazon, has expanded its empire to encompass cloud computing (AWS), logistics, and even healthcare. Q3 2023 demonstrated continued strong growth despite economic headwinds, highlighting its diversified revenue streams. However, competition from Walmart in e-commerce and antitrust scrutiny regarding its market dominance are critical factors to consider. Amazon’s focus on logistics innovation and potential expansion into the healthcare sector offers exciting future avenues. Its high valuation reflects its leadership position in its core segments, but investors should be wary of potential macroeconomic challenges and regulatory interventions.

Logo of Amazon
Logo of Amazon
Source: the company.

Nvidia

This chipmaker has carved a niche in graphics processing units (GPUs) powering the gaming, AI, and data center industries. Q3 2023 saw explosive growth, fueled by surging chip demand and the adoption of AI in various sectors. However, competition from AMD and Intel in the semiconductor space is fierce. While Nvidia’s technological edge in AI-specific GPUs provides a temporary advantage, the cyclical nature of the semiconductor industry necessitates caution. Its high valuation reflects its growth potential, but investors should be mindful of potential downturns in the chip market. While Nvidia now holds a market share of approximately 83%, compared to AMD’s (17%), it faces strong competition.

First, there is Apple (AAPL), which has quickly developed its own laptop CPUs with graphics capabilities that it claims can compete with Nvidia’s top products. Intel (INTC) is also preparing to unveil its own line of graphics chips, which could pose a significant challenge to Nvidia. Moreover, US restrictions on Nvidia’s sales of advanced AI chips in China create a strategic opportunity for competitors such as Huawei, potentially leading to Nvidia losing market share in this important region. Huawei’s entry into the AI chip market with its Ascend AI chip series, particularly the 910B, directly competes with Nvidia’s A100 processor, and the company recently received a big order from Baidu, a major leader in Chinese technology.

Logo of Nvidia
 Logo of Nvidia
Source: the company.

Tesla

This electric vehicle (EV) pioneer has disrupted the auto industry with its innovative EVs and clean energy solutions. Q3 2023 delivered impressive revenue and profit growth, showcasing the increasing public adoption of EVs. However, Tesla has seen its US market dominance shrink from 62% to just over 50% of the market in 2023. The company faces intensifying competition from traditional automakers and new EV startups like Rivian and Lucid as well as competitors from China like BYD who became the dominant automaker in China in 2021. And over the next few years, the growing global heft of Chinese manufacturers looks hard to beat. Chinese EV players such as BYD, Nio, Wuling, and Xpeng produced almost 60% of the world’s EVs in 2022 – and they have been doing so in a very affordable manner. In the first half of 2023, the average cost of an EV in China was US$33,000 (£26,040), more than half the US$70,700 (£55,800) people pay for EVs in Europe and the US$72,000 paid in the US. Additionally, challenges in scaling production and maintaining quality control raise concerns. Tesla’s high valuation reflects its future growth expectations, but potential macroeconomic headwinds and uncertainties surrounding battery technology advancements introduce significant risks.

Logo of Tesla
Logo of Tesla
Source: the company.

Performance Comparison with indices and Competitive advantages of the “Magnificent Seven”

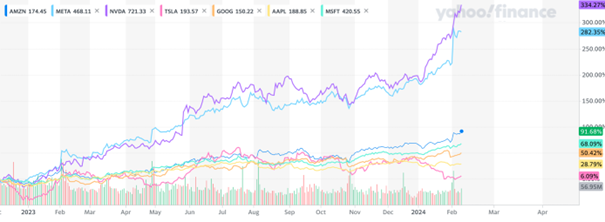
Magnificent Seven Performance Comparison. Magnificent Seven Performance Comparison
Source: Yahoo Finance

The “Magnificent Seven” companies are leaders in dynamic industries like cloud computing (Microsoft), e-commerce (Amazon), and AI (Meta), driving revenue and stock price growth. Being a leader in a dynamic industry offers several key benefits, as exemplified by these tech giants. At their core, these companies boast robust financials: high-profit margins, consistent cash flow, and efficient operations which translate to investor confidence. Indeed, according to the Capital Group, the Bloomberg “Magnificent 7” Total Return Index advanced 107% in 2023 versus the overall S&P 500 Index at 24%.

There are numerous other factors driving their financial outperformance. Apple, for example, revolutionized smartphones with the iPhone, granting them a loyal user base and brand identity. Similarly, Tesla’s dominance in electric vehicles gives them valuable data and expertise, making it harder for competitors to catch up. Dynamic industries are characterized by rapid expansion and constant innovation. Leaders are poised to capture a larger share of this growth, like Microsoft’s cloud computing dominance or Alphabet’s early investment in AI research. They can also diversify into related fields, as Meta is attempting with the metaverse. Moreover, top talent seeks employers at the forefront of their field. Being a leader attracts skilled employees, fostering a culture of innovation and further solidifying the company’s position. Nvidia’s reputation for cutting-edge graphics processing units attracts top engineers, fueling their continued success.

Investors often reward market leaders with higher valuations due to their perceived stability and future growth potential. This allows companies like Apple to raise capital for further expansion and acquisitions, creating a virtuous cycle. Additionally, the current market environment plays a part. Amidst volatility, investors seek stability and potential upside, making these large, established companies with proven track records attractive safe-havens. The fact that tech stocks are generally less sensitive to rising interest rates compared to other sectors further fuels their appeal in a tightening monetary environment.

As stated above, the “Magnificent Seven” have strong fundamentals, and their financial strength, profitability, as well as growth potential underpin their success. Each of the seven stocks has easily outperformed the S&P 500’s 163% return over the last ten years, and their involvement in high-growth technologies such as high-end software and hardware, cloud computing, and artificial intelligence positions them well to continue leading their respective markets in the future.

Among the “Magnificent Seven” companies, observe strong profitability: The “Seven” boast a significantly higher average net margin (25%) compared to the S&P 500 (12%). (Source: BlackRock) This translates to substantial cash flow generation, crucial for reinvestment and future growth. For example, Tesla’s Q3 2023 net margin surpassed 17%, fueling its rapid expansion. We must also acknowledge that their average annual revenue growth (22%) outpaces the S&P 500 (10%). (Source: Motley Fool) This translates to faster stock price appreciation. Nvidia’s 80% year-to-date stock surge, driven by booming chip demand for AI applications, exemplifies this.

Additionally, we recognize in the “Seven” some form of “Market Magic”; during the last market correction (January 2023), their average decline (10%) was smaller than the S&P 500’s (15%). (Source: Qontigo) This “safety premium” attracts risk-averse investors, thus boosting their performance. Moreover, their lower average Beta (0.85) indicates that they are 15% less volatile than the rest of the market. (Source: Qontigo) This makes them more appealing in fluctuating interest rate environments. Finally, the individualities shine brighter than the rest because of the sectors they are invested in, like Nvidia benefitting from the chip surge or Meta’s ambitious metaverse projects that attract investor interest, potentially impacting future performance.

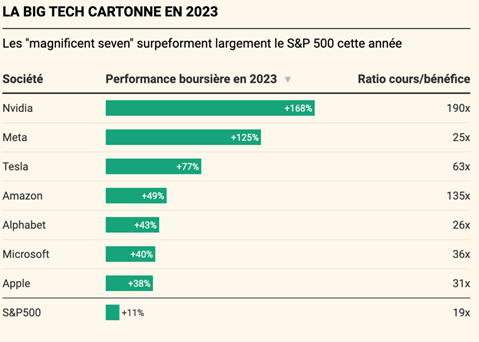
Yet, investing in them still carries risks, as these factors have already been priced in. There are also the usual risks of market volatility, regulatory changes, technological disruptions, and global economic conditions that can influence their performance. Also, previous performance does not guarantee future returns, and some of the “Magnificent Seven” stocks are overvalued based on certain basic criteria like forecast earnings multiples and price-to-sales ratios.

Stock market performance of the Magnificent Seven in 2023  Stock market performance of the Magnificent Seven in 2023
Source: Bloomberg

What are the risks ahead of the “Magnificent Seven” progression?

Because of their size and reach, these companies all face regulatory risks. Regulation changes, especially in data privacy, antitrust laws, and international trade, can significantly influence their operations. Furthermore, most tech companies have faced attention for antitrust, data privacy, and tax issues. Many of them have been investigated for monopolistic tactics, and if they want to enhance their already large market shares, they will face even more scrutiny.

More broadly, widespread economic changes affect them due to their broad reach, including interest rates, inflation, economic growth, consumer confidence, and investor sentiment. Moreover, global enterprises are vulnerable to currency swings, which can impact earnings and stock values. Companies operating internationally face geopolitical risks such as trade wars, tariffs, and shifting international relations, which can impact supply chains and market access.

The Magnificent Seven are also vulnerable to cyberattacks due to their technology-based nature, a large breach could result in huge financial losses and reputational damage. Moreover, companies facing market saturation and rivalry may struggle to discover new markets and maintain growth rates. Indeed, increased competition between established firms and new startups may potentially endanger their market share. In short, by dominating their marketplaces, they become targets for any competitors wanting to build a name for themselves in their respective sectors. Companies must innovate to keep up with rapid technological progress as failure to adapt to new technology or trends may result in a loss of market relevance. Additionally, the resignation or loss of a founder or CEO may negatively impact investor sentiment and the company’s future.

Therefore, while these stocks present exciting possibilities, they also require a nuanced understanding of the technology sector’s options and a strategic investment approach.

Conclusion

The Magnificent Seven stocks represent a cohort of high-performing companies that have garnered significant attention in the investment world for their market dominance, technological advances, and growth potential. These stocks, which include Microsoft, Tesla, and NVIDIA, along with some FAANG members, are known for their influence across various sectors, such as software, hardware, electric vehicles, and artificial intelligence. They have been pivotal in driving technological trends and shaping consumer behavior, making them attractive to investors seeking growth and market leadership. However, investors need to know the risks and challenges associated with these stocks. The dynamic nature of the technology sector, regulatory scrutiny, market saturation, and global economic factors like inflation and geopolitical tensions can affect their performance. Additionally, high market valuations bring lofty expectations, and any failure to meet these can lead to significant stock price corrections.

Thus, while the Magnificent Seven offer potential for substantial growth, they also require careful analysis and a balanced approach considering their strengths and the various external factors that could influence their future trajectory.

Related posts on the SimTrade blog

   ▶ Anant JAIN The World 10 Most Sustainable Companies in 2021

   ▶ Nithisha CHALLA Top 5 companies by market capitalization in the US

   ▶ Youssef LOURAOUI Alpha

Useful resources

Movies

Akira Kurosawa (1954) Seven Samurai.

John Sturges (1960) The Magnificent Seven.

Press articles

Le Monde (26/05/2023) Nvidia entre dans le club très sélect des champions du monde de la cote

BlackRock (01/09/2023) Factors & the Magnificent Seven

Bloomberg (06/07/2023) Tesla and Chinese Rivals Signal Truce in Brutal EV Price War

Capital Group (09/01/2024) Magnificent Seven: What do you need to believe?

The New York Times Six takeaways from a contentious online child safety hearing

The New York Times (22/01/2024) The New York Times

Qontigo (03/10/2023) Ten charts that show how the ‘Magnificent Seven’ have held sway in the US market

Wall Street Journal (12/02/2024) Think the S&P 500 Looks Pricey? Check Out the Magnificent Seven

Motley Fool Nasdaq

Seeking Alpha (22/11/2023) Nvidia: Competition On The Horizon

About the author

The article was written in February 2024 by Isaac ALLIALI (ESSEC Business School, Global Bachelor in Business Administration (GBBA), 2019-2023).

Decoding Business Performance: The Top Line, The Line, and The Bottom Line

Decoding Business Performance: The Top Line, The Line, and The Bottom Line

Isaac ALLIALI

In this article, Isaac ALLIALI (ESSEC Business School, Bachelor in Business Administration (BBA), 2019-2023) decodes the business performance by analyzing the top line, the line, and the bottom line.

Introduction

In the realm of finance and business, terms like “top line,” “the line,” and “bottom line” often dominate discussions. But what do they really mean, and why are they so important in evaluating a company’s financial health? This article aims to elucidate these key financial terms and their relevance to business performance assessment.

The Top Line

The “top line” refers to a company’s gross revenue or sales, so named because it appears at the top of a company’s income statement. It reflects the total revenue earned from the sale of goods or services before deducting any costs or expenses. This figure is crucial as it indicates the company’s ability to sell its products or services, which is fundamental to its business operations.

The strategies for increasing the top line generally focus on enhancing sales through marketing efforts, pricing strategies, product development, or expanding into new markets. While it may seem that a growing top line (revenue) is indicative of profitability, it is important to recognize that this metric alone does not consider the expenses associated with generating that revenue. In other words, the increase in revenue does not guarantee increased profitability. It is crucial for investors to understand that a company’s top line growth does not always align with its profitability.

For instance, if the cost of producing goods or services is rising faster than sales, profits might be shrinking despite increased revenues.

The Line

While “the line” is a less commonly used term in comparison to the “top line” and “bottom line”, it is often used to refer to the “break-even line.” The break-even line represents a point where total costs (including both fixed and variable costs) are equal to total revenue.

At this juncture, the company isn’t making a profit, but it isn’t incurring a loss either. Understanding the break-even point is essential for businesses because it provides a clear target to cover costs and start making profits.

Knowing when a company will hit its break-even point can help investors understand when it might start turning a profit. In addition, a company with a lower break-even point can withstand market fluctuations better, representing a potentially less risky investment.

The Bottom Line

The “bottom line” is arguably the most significant figure on an income statement, representing the company’s net income. It’s the residue left after deducting all expenses, including cost of goods sold (COGS), operating expenses, interest payments, and taxes from the top line. This term gets its name because net income is listed at the bottom of the income statement.

The bottom line demonstrates a company’s profitability, and strategies to improve it usually focus on enhancing gross revenue or reducing costs. Shareholders closely monitor the bottom line because it directly affects earnings per share and dividends. However, solely focusing on improving the bottom line can sometimes lead to unsustainable strategies like excessive cost-cutting.

However, investors should also be aware that an increasing bottom line can sometimes be achieved through aggressive cost-cutting, which may not be sustainable in the long run. It’s important to scrutinize the sources of bottom-line growth: Is it due to increased sales, improved operational efficiency, or simply cost-cutting?

Conclusion

Understanding the terms “top line,” “the line,” and “bottom line” is crucial for interpreting a company’s financial performance. While the top line provides insight into sales performance and the bottom line into profitability, it’s the intricate story that unfolds between these two lines that often holds the most valuable insights for sustainable growth and profitability. As such, a holistic view of a company’s financial health should consider all these aspects.

By focusing on each line in tandem, companies can better navigate their path to profitability, creating strategies that stimulate sales growth (top line), manage costs effectively (the line), and ultimately drive profit (bottom line). However, these metrics should not be used in isolation. Investors should use them in conjunction with other financial ratios and indicators to make informed decisions.

By aligning their strategies to promote sales growth (top line) and efficient cost management practices (the line), companies can navigate their path to profitability. The aim is to strike a balance between revenue generation and cost control to drive profitability (bottom line). However, it’s important to note that these metrics should not be evaluated in isolation. Investors should consider utilizing other financial ratios and indicators to gain a comprehensive understanding of a company’s financial health. These may include profitability ratios (such as gross profit margin, operating margin, and net profit margin), liquidity ratios (like current ratio and quick ratio), debt ratios (such as debt-to-equity ratio and interest coverage ratio), and efficiency ratios (like inventory turnover and receivables turnover). Evaluating these indicators collectively provides a more comprehensive assessment of a company’s performance and prospects, empowering investors to make informed investment decisions. Each line tells a different part of the company’s financial story, and understanding the interplay between them is crucial for investment decision-making.

Illustration

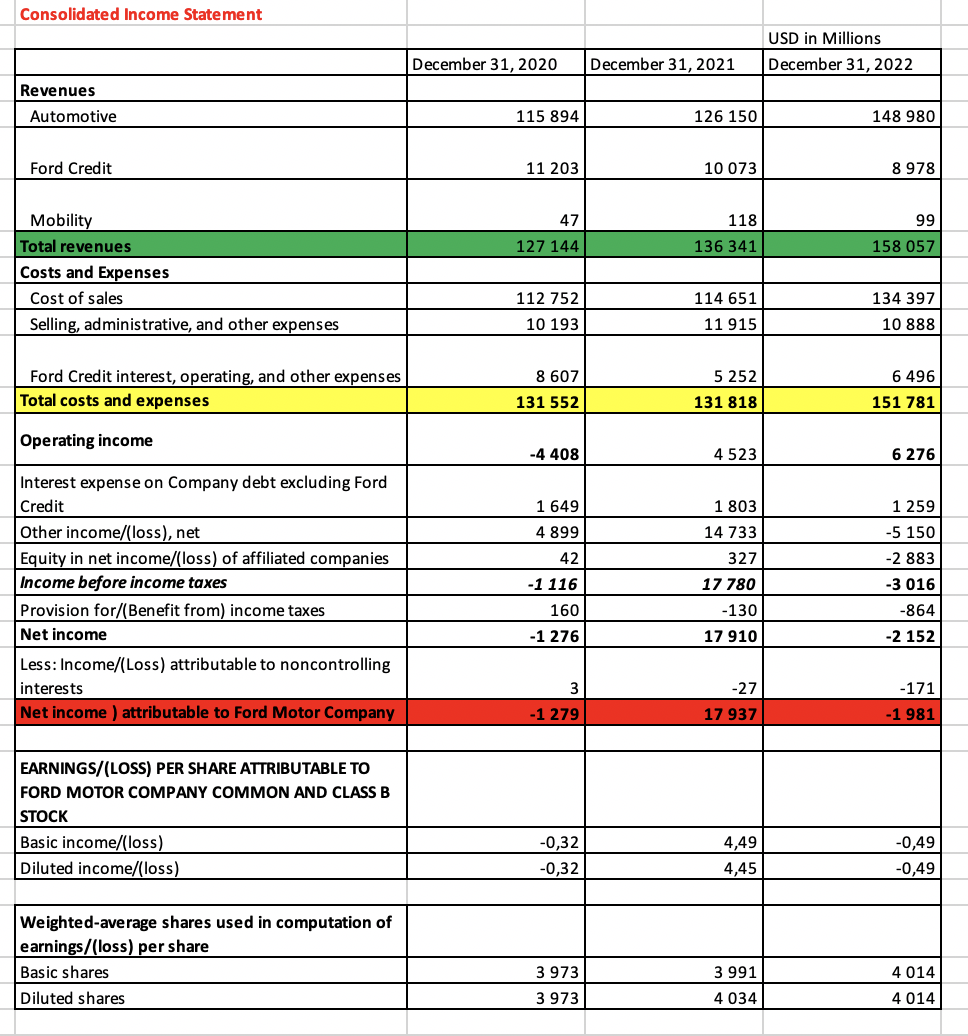
Income statement of Ford.
 The Top Line, The Line, and The Bottom Line
Source: the company.

Why should I be interested in this post?

These concepts form the foundation of financial analysis and provide valuable insights into a company’s financial performance. Understanding the top line, which represents revenue or sales, is crucial as it demonstrates a company’s ability to generate income and sustain growth. The bottom line, which reflects the net income or profit after deducting expenses, taxes, and interest, provides a measure of overall profitability. By delving into the line, which encompasses various expenses impacting profitability, finance students can gain a comprehensive understanding of financial statements and develop the analytical skills necessary to evaluate a company’s financial health, make informed investment decisions, and contribute to effective financial strategies. This knowledge is highly applicable in various finance-related roles and is instrumental in navigating the complexities of the business world.

Related posts on the SimTrade blog

   ▶ Bijal GANDHI Income Statement

   ▶ Bijal GANDHI Revenue

   ▶ Bijal GANDHI Cost of goods sold

About the author

The article was written in June 2023 by Isaac ALLIALI (ESSEC Business School, Bachelor in Business Administration (BBA), 2019-2023).
Understanding the Gordon-Shapiro Dividend Discount Model: A Key Tool in Valuation

Understanding the Gordon-Shapiro Dividend Discount Model: A Key Tool in Valuation

Isaac ALLIALI

In this article, Isaac ALLIALI (ESSEC Business School, Bachelor in Business Administration (BBA), 2019-2023) explains about the Gordon-Shapiro Dividend Discount Model, which is a key tool in valuation.

Introduction

The Gordon-Shapiro Dividend Discount Model, also known as the Gordon-Shapiro formula and the Gordon Growth Model, is a central tenet in finance. It provides investors and financial analysts a simple tool to value a company based on its future dividends that are expected to remain at a constant growth rate. This model was named after economists Myron J. Gordon and Eli Shapiro, who developed it.

The Gordon-Shapiro formula

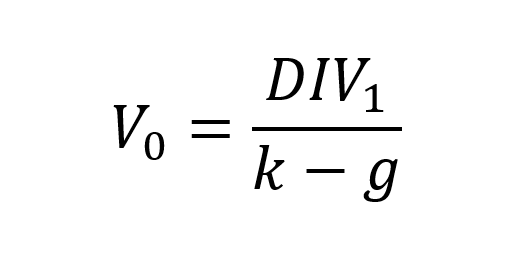
The Gordon-Shapiro formula is articulated through a relatively simple equation:

Gordon Shapiro formula

where:

V stands for the value of the stock.
DIV1 represents the expected dividend in the next period.
k is the investor’s required rate of return.
g is the constant growth rate of dividends.

This formula is premised on the idea that a company’s stock is worth the present value of all its future dividends.

Proof of the Gordon-Shapiro formula

To understand the derivation of the formula, let us consider a perpetuity model for valuing stocks. In a perpetuity model, the value of an asset is determined by the discounted value of its future cash flows. In the case of stocks, dividends represent the cash flows received by investors (shareholders or stockholders).

Assuming that the company pays a constant dividend indefinitely, the present value of the future dividends can be expressed as follows:

Gordon Shapiro formula

where DIV1, DIV2, DIV3 and so on, represent the expected dividends in subsequent periods.

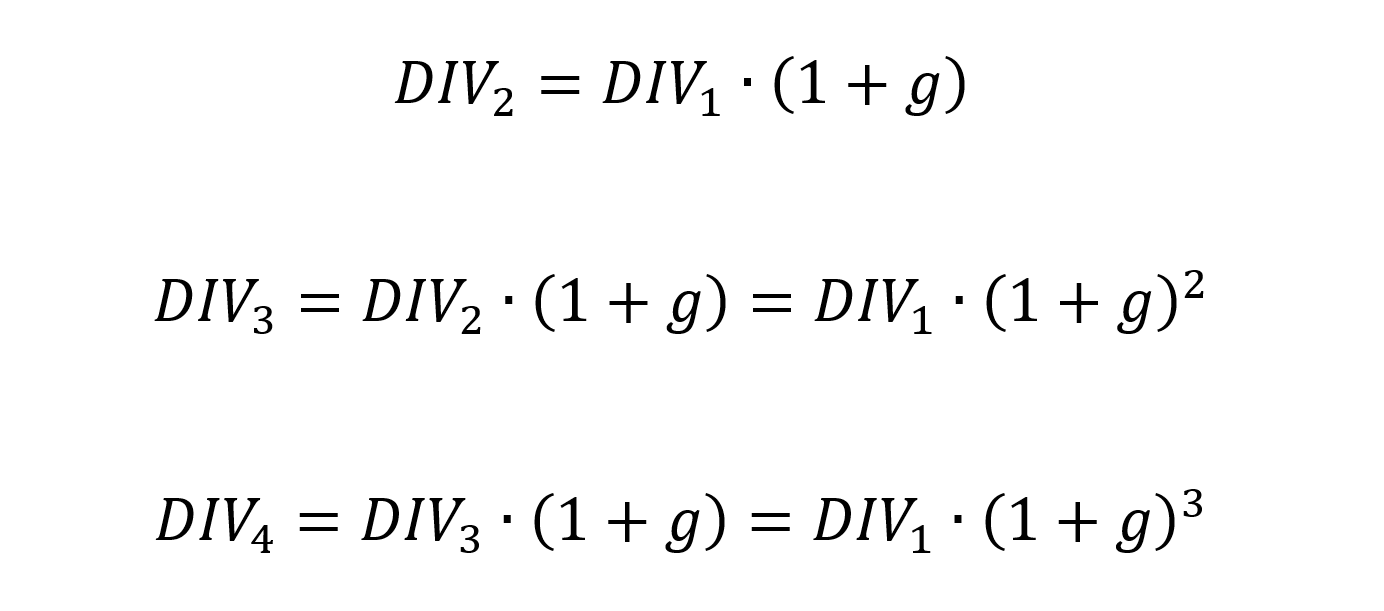
To simplify the formula, we assume that the dividend grows at a constant rate (g). This means that each subsequent dividend can be expressed as a multiple of the previous dividend:

Gordon Shapiro formula

Substituting these dividend expressions into the perpetuity formula, we have:

Gordon Shapiro formula

Inside the parentheses, we recognize an infinite geometric series with a ratio q equal to (1+g)/(1+k) for the geometric sequence.

Gordon Shapiro formula

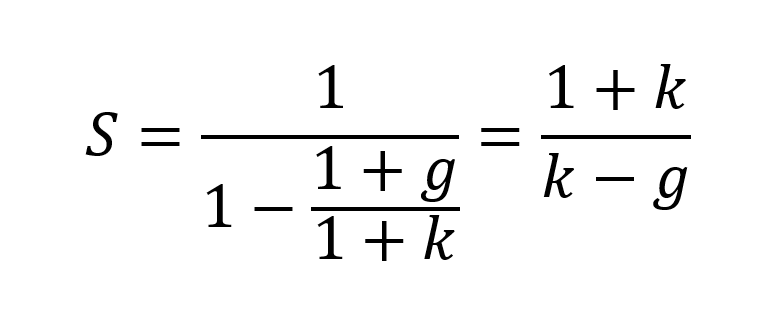
The sum of an infinite geometric series denoted by S with a ratio q is equal to 1/(1-q). Applied to the case above, we obtain:

Gordon Shapiro formula

This leads to the Gordon Shapiro formula:

Gordon Shapiro formula

Simplifying further:

Gordon Shapiro formula

Therefore, the Gordon-Shapiro formula for estimating the intrinsic value of a stock is derived.

Assumptions of the Gordon Growth Model

The Gordon-Shapiro Dividend Discount Model is based on several key assumptions:

Constant Growth Rate: the model assumes that dividends grow at a constant rate indefinitely.

Required Rate of Return: the required rate of return exceeds the dividend growth rate. This condition is necessary for the formula to work.

Dividends: the company is expected to distribute dividends.

While these assumptions may not hold in all cases, they offer a starting point for the valuation process.

Applicability of the Gordon Growth Model

The Gordon Growth Model is especially useful in certain scenarios. For example, it is an excellent tool when assessing companies with stable growth rates, such as utility companies or large, mature firms.

However, the model has limitations when used for companies that don’t pay dividends or those with a dividend growth rate that is not consistent. High-growth companies, for instance, reinvest their profits for expansion rather than paying dividends. Similarly, companies facing fluctuating growth rates may present challenges for the model’s assumptions.

Example

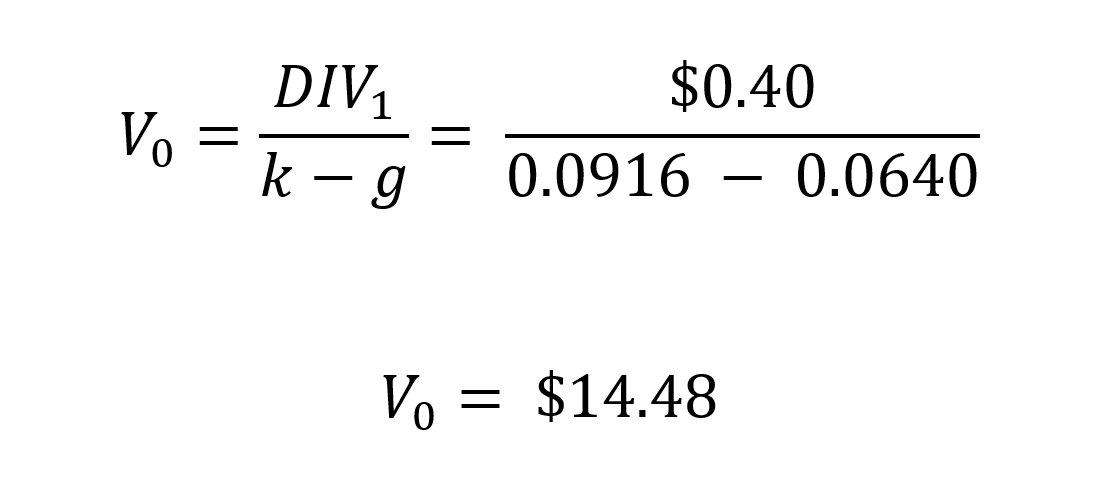
After researching Pfizer’s data, we assume that this company pays an annual dividend per share (DPS) of $0.40. The required rate of return (k) for the company’s stock 9,16% was computed with the CAPM Model under the following assumptions: (Risk free rate of return= 4,73%; Beta of Pfizer stock is 0,62 and Market rate of return =11,88%), and the expected growth rate of dividends (g) is 6,40%.

Using the Gordon Shapiro formula:

Gordon Shapiro formula

In this example, based on the given assumptions, the Gordon Shapiro model estimates the intrinsic value (V0) of Pfizer’s stock to be $14.48 per share. The current market price of Pfizer’s stock ($37,60) is significantly higher than the estimated intrinsic value, it could suggest that the stock is potentially overvalued. This may indicate a cautionary signal for investors, as it implies that the stock’s market price may not be justified by the projected dividends and required rate of return. It’s important to note that the Gordon Shapiro model is a simplified valuation tool and relies on various assumptions. The actual value of a stock is influenced by numerous factors, including market conditions, company performance, industry trends, and investor sentiment. Investors should conduct further research, analyze additional factors, and seek professional advice before making investment decisions based solely on the findings of the Gordon Shapiro model or any other valuation model.

Conclusion

Despite its limitations, the Gordon-Shapiro Dividend Discount Model remains a valuable tool in financial analysis and investment decision-making. Its simplicity and focus on dividends make it an attractive model for investors, especially when applied appropriately and in the right context. Investors and financial analysts alike should understand this model as part of their toolkit for assessing a company’s inherent value.

Related posts on the SimTrade blog

   ▶ William LONGIN How to compute the present value of an asset?

   ▶ Maite CARNICERO MARTINEZ How to compute the net present value of an investment in Excel

   ▶ Pranay KUMAR Time is money

Useful resources

SimTrade course Financial analysis

Gordon, Myron J., and Eli Shapiro (1956) “Capital Equipment Analysis: The Required Rate of Profit.” Management Science, 3(1): 102-110.

About the author

The article was written in June 2023 by Isaac ALLIALI (ESSEC Business School, Bachelor in Business Administration (BBA), 2019-2023).

My experience as an EMEA Regional Treasurer intern at Sanofi

My experience as an EMEA Regional Treasurer intern

Isaac ALLIALI

In this article, Isaac ALLIALI (ESSEC Business School, Bachelor in Business Administration (BBA), 2019-2023) shares his professional experience an EMEA Regional Treasurer intern at Sanofi.

Sanofi

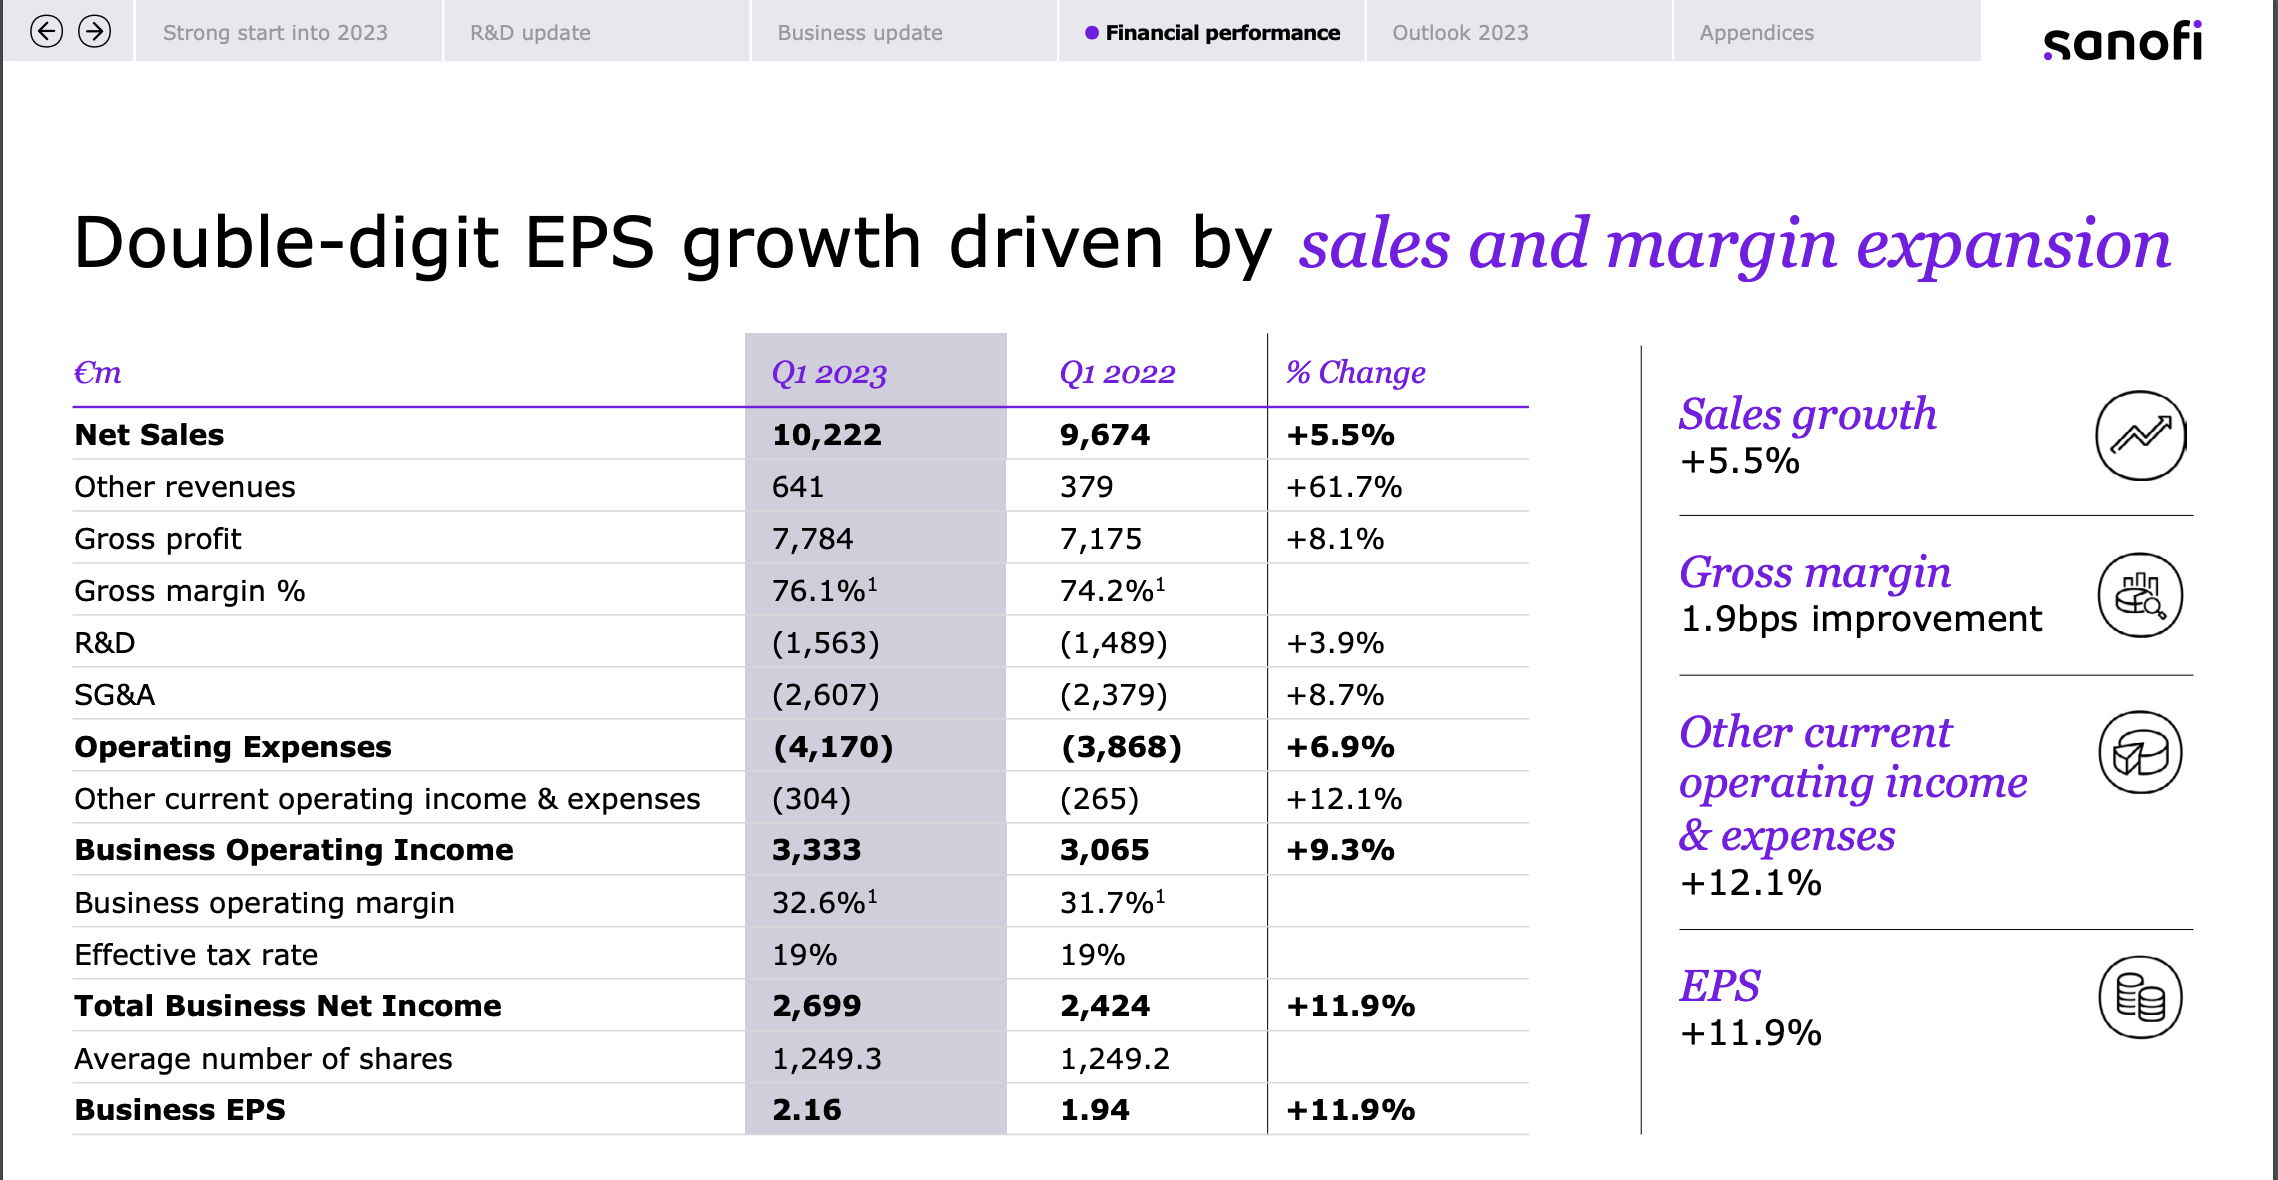
During my internship at Sanofi, a leading global pharmaceutical company headquartered in Paris, I had the privilege of working in the Treasury Department. Sanofi is renowned for its extensive research, development, manufacturing, and marketing of pharmaceutical products across various therapeutic areas. With a steadfast commitment to improving global health, Sanofi’s portfolio includes treatments for diabetes, cardiovascular diseases, vaccines, and rare diseases. As a key player in the pharmaceutical industry, Sanofi holds a significant share of the prescription market.

Logo of Sanofi.
Logo of
Source: the company.

Financial accounts

Income statement of Sanofi.
Logo of
Source: the company.

Strategy

Strategy of Sanofi.
Logo of
Source: the company.

My internship

As a Europe Middle East and Africa (EMEA) Regional Treasurer intern at Sanofi, my internship involved two main aspects. Firstly, I was responsible for reporting on the performance of the company’s subsidiaries on a monthly basis, focusing on key financial metrics such as Days Sales Outstanding (DSO), Days Payable Outstanding (DPO), Days Inventory Outstanding (DIO), and cash flows. This required analyzing financial data, preparing comprehensive reports, and providing insights into the subsidiaries’ financial health. I developed a deep understanding of financial ratios and gained proficiency in financial analysis and reporting.

Additionally, on a day-to-day basis, I played a vital role in implementing alternative banking channels to ensure the sustainability of cash receipts from high-risk countries. This involved close collaboration with banks and local teams to establish robust procedures and systems. To ensure accurate cash receipts matching with product sales, I diligently contacted banks and the local teams on a daily basis. This rigorous process involved verifying and validating each transaction, ensuring the precise quantity of products sold aligned with the corresponding justifying claims. By maintaining meticulous attention to detail, I ensured that every transaction was accurately registered and properly accounted for.

This aspect of my internship demanded strong communication skills, attention to detail, and the ability to manage complex transactions efficiently. It provided firsthand exposure to the challenges and intricacies of international banking operations, risk management, and compliance in high-risk countries.

During my internship as an EMEA Regional Treasurer at Sanofi, I had the additional responsibility of consolidating the representative offices’ register, which included all the bank accounts and power of attorneys (legal documents allowing appointed employees to make decisions on behalf of Sanofi).

This task required me to meticulously reconcile and align the information from various regions before the audit control. To ensure accuracy and completeness, I actively communicated with every regional treasurer, collaborating closely to verify the documentation and address any discrepancies. This process of effective communication and coordination with the regional treasurers was crucial in achieving a thorough and successful consolidation. By ensuring that everything was in order, I contributed to the smooth audit control process and maintained the integrity of the company’s financial records.

My missions

My internship involved two main aspects. Firstly, I was responsible for reporting on the performance of the company’s subsidiaries on a monthly basis, focusing on key financial metrics such as Days Sales Outstanding (DSO), Days Payable Outstanding (DPO), Days Inventory Outstanding (DIO), and cash flows. This required analyzing financial data, preparing comprehensive reports, and providing insights into the subsidiaries’ financial health. I developed a deep understanding of financial ratios and gained proficiency in financial analysis and reporting.

Additionally, on a day-to-day basis, I played a vital role in implementing alternative banking channels to ensure the sustainability of cash receipts from high-risk countries. This involved close collaboration with banks and local teams to establish robust procedures and systems. To ensure accurate cash receipts matching with product sales, I diligently contacted banks and the local teams on a daily basis. This rigorous process involved verifying and validating each transaction, ensuring the precise quantity of products sold aligned with the corresponding justifying claims. By maintaining meticulous attention to detail, I ensured that every transaction was accurately registered and properly accounted for.

This aspect of my internship demanded strong communication skills, attention to detail, and the ability to manage complex transactions efficiently. It provided firsthand exposure to the challenges and intricacies of international banking operations, risk management, and compliance in high-risk countries.

During my internship,I had the additional responsibility of consolidating the representative offices’ register, which included all the bank accounts and power of attorneys (legal documents allowing appointed employees to make decisions on behalf of Sanofi).

This task required me to meticulously reconcile and align the information from various regions before the audit control. To ensure accuracy and completeness, I actively communicated with every regional treasurer, collaborating closely to verify the documentation and address any discrepancies. This process of effective communication and coordination with the regional treasurers was crucial in achieving a thorough and successful consolidation. By ensuring that everything was in order, I contributed to the smooth audit control process and maintained the integrity of the company’s financial records.

Required skills and knowledge

The EMEA Regional Treasurer role at Sanofi requires a combination of knowledge and skills. Here are key areas of expertise and proficiencies relevant to the position:

Financial Analysis: A strong foundation in financial analysis is essential for evaluating subsidiary performance, assessing financial health, and providing meaningful insights. Proficiency in financial ratios, financial modeling, and data analysis enables you to make informed decisions and recommendations.

Treasury Operations: Familiarity with treasury operations, including cash flow management, liquidity management, risk management, and financial reporting, is crucial. Understanding financial instruments, banking relationships, and compliance procedures ensures effective treasury operations and supports decision-making.

Communication and Collaboration: Effective communication skills are vital to engage and collaborate with internal stakeholders, such as regional financial management and local teams. Clear and concise communication fosters productive relationships and ensures the smooth execution of financial processes.

Attention to Detail and Compliance: Meticulous attention to detail is necessary when reporting on subsidiary performances and implementing alternative banking channels. Compliance with internal control procedures, risk mitigation protocols, and financial regulations ensures accuracy, transparency, and integrity in financial operations.

Analytical Thinking: Strong analytical skills are critical for analyzing financial data, identifying trends, and making data-driven decisions. The ability to evaluate risks, identify opportunities, and propose solutions contributes to effective financial management.

Adaptability and Problem-Solving: The dynamic nature of the role requires adaptability, as well as the ability to think critically and solve problems in a fast-paced environment. Resilience, flexibility, and a proactive approach enable you to navigate challenges and drive continuous improvement.

Financial concepts related my internship

Days Sales Outstanding (DSO)

DSO is a financial metric that measures the average number of days it takes for a company to collect payment after a sale is made. Monitoring DSO is crucial for assessing a company’s liquidity position and efficiency in collecting accounts receivable. During my internship, I actively analyzed and reported on DSO, gaining a practical understanding of its significance in cash flow management.

Days Payable Outstanding (DPO)

DPO is a financial metric that measures the average number of days it takes for a company to pay its suppliers after receiving an invoice. Managing DPO effectively is essential for optimizing working capital and maintaining strong supplier relationships. In my reporting responsibilities, I monitored and analyzed DPO, contributing to a comprehensive assessment of the company’s financial performance.

Cash Receipts and Compliance

Ensuring the accurate and timely recording of cash receipts is vital for financial integrity. Implementing alternative banking channels and verifying transactions from high-risk countries required a keen eye for detail and compliance with internal control procedures. This experience emphasized the importance of maintaining rigorous standards to mitigate risk and ensure accurate financial reporting.

Why should I be interested in this post?

The role of EMEA Regional Treasurer at Sanofi offers a compelling opportunity for individuals interested in finance, treasury operations, or the pharmaceutical industry. Here are a few reasons why you should be interested in this post:

Industry Leadership: Sanofi is a global leader in the pharmaceutical industry, renowned for its innovative research and development. Joining the Treasury Department of such a prominent company provides exposure to the complexities of finance within a multinational pharmaceutical corporation, offering a unique and valuable experience.

Financial Responsibility: As an EMEA Regional Treasurer, you would have a significant role in managing the financial assets of Sanofi across the EMEA region. This level of responsibility allows you to make strategic financial decisions, analyze financial performance, and contribute to the company’s financial health.

International Exposure: Working within the EMEA region exposes you to diverse markets, cultures, and business practices. It presents an opportunity to develop a global mindset, adaptability, and cross-cultural communication skills, which are increasingly valuable in today’s interconnected business world.

Learning Opportunities: The Treasury Department at Sanofi offers a dynamic and challenging environment where you can continually enhance your financial knowledge and skills. You will gain exposure to various aspects of treasury operations, financial risk management, liquidity management, and financial reporting.

Impactful Contributions: By actively participating in the implementation of alternative banking channels, you will contribute to ensuring the sustainability of cash receipts from high-risk countries. This responsibility allows you to make a tangible impact on the company’s financial operations and play a vital role in managing financial risks.

Useful resources

Sanofi

Careers at Sanofi

About the author

The article was written in June 2023 by Isaac ALLIALI (ESSEC Business School, Bachelor in Business Administration (BBA), 2019-2023).