Understanding the Order Book: Analyzing Market Liquidity

Bochen LIU

In this article, Bochen LIU (Queen’s Smith School of Business, BCom 2023–2027; ESSEC BBA Exchange Program, Fall 2025) explains the concept of the order book, how it functions in financial markets, and the insights it provides to traders.

What is an order book?

For anyone engaging in financial markets, understanding the order book is essential. The order book is a dynamic record of buy and sell orders for a given asset, reflecting the interaction between supply and demand in real time. Whether trading stocks, currencies, or digital assets, the order book allows market participants to visualize liquidity, identify potential price movements, and make informed decisions.

An order book lists all outstanding buy and sell limit orders for an asset, showing both the prices at which traders are willing to transact and the quantities they wish to trade. It provides a clear picture of market depth and the relative interest of buyers and sellers at different price levels. Unlike a simple price chart, the order book reveals where liquidity is concentrated and where potential support or resistance may occur, making it an indispensable tool for understanding short-term market dynamics.

How an order book functions

The order book is typically divided into two sections: the buy side (bid side) and the sell side (ask side). The buy side shows the highest prices buyers are willing to pay, while the sell side reflects the lowest prices sellers are willing to accept. Orders are listed by price and aggregated volume, and the book is continuously updated as trades are executed and new orders enter the market.

The difference between the best bid and best ask is known as the bid-ask spread, a key indicator of market liquidity. By monitoring changes in the spread and the distribution of orders, traders can gain insights into market sentiment and anticipate short-term price movements.

In practice, the organization of the order book allows traders to understand not just current prices but also the pressure from buyers and sellers at different levels. For example, a concentration of large buy orders may act as a support level, while clusters of sell orders can indicate resistance. The order book therefore acts as a living map of market intentions and is often used together with charts and other data sources.

Order book representation

The structure of the order book is often visualized through trading platforms that display the distribution of buy and sell orders at different price levels. A typical representation includes two columns: bids on the left and asks on the right. Each row shows the price level and the cumulative quantity available at that level.

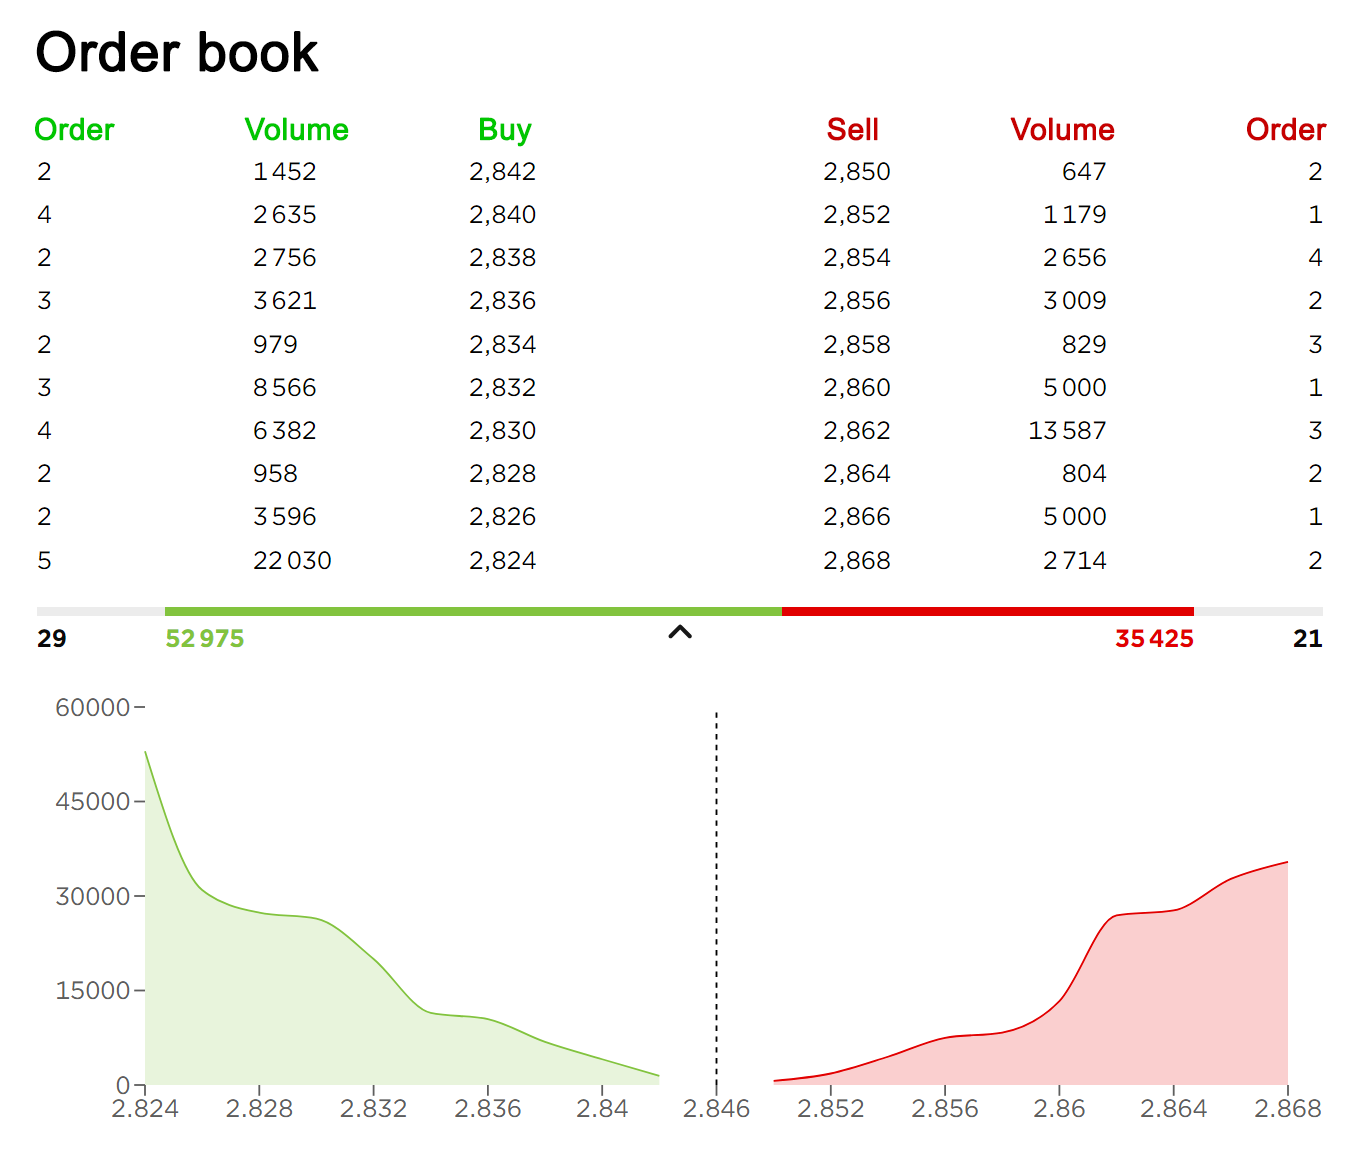
Figure 1. Example of an order book (buy and sell parts presented side by side).
Example of an order book with buy and sell parts presented side by side
Source: screenshot from a trading platform.

Figure 1 presents one of the most common visual formats of the order book, in which bid orders are shown on the left and ask orders on the right. This side-by-side structure allows traders to compare the quantities available at different price levels and to identify the best bid and best ask immediately. It also makes the bid-ask spread visible, which is a key indicator of market liquidity and transaction cost.

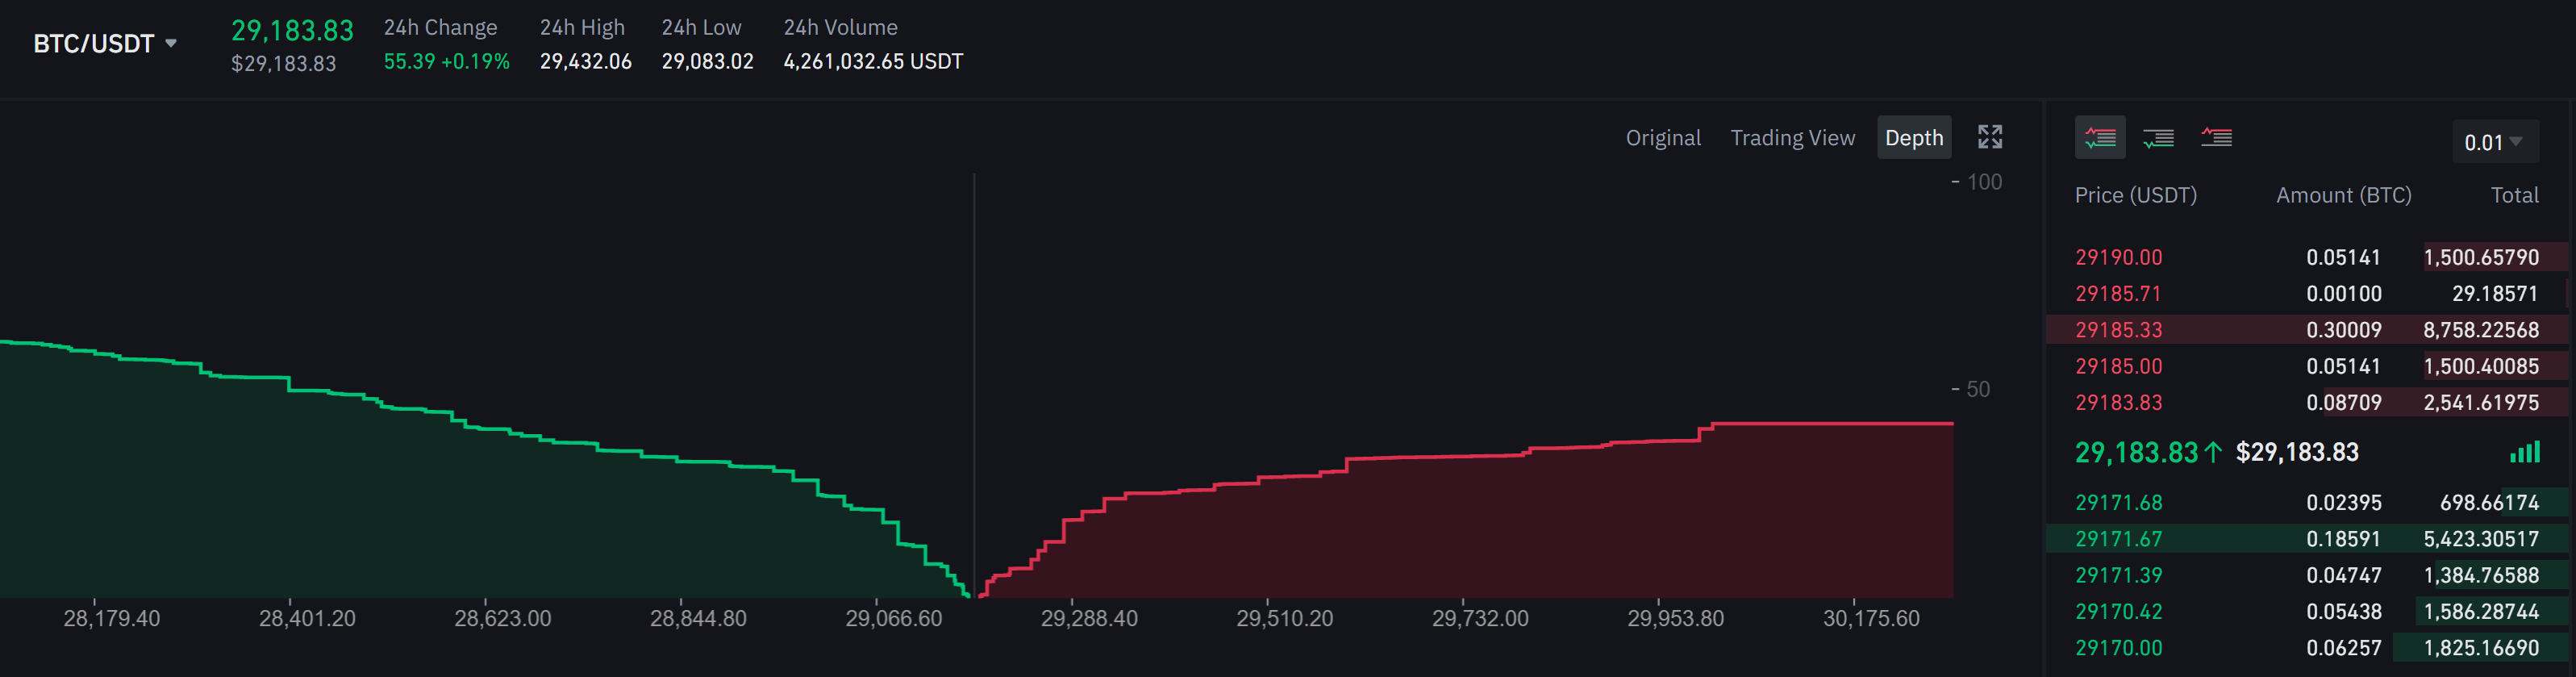
Modern electronic trading platforms such as NASDAQ TotalView or cryptocurrency exchanges provide graphical representations of the order book. These interfaces often include a “depth chart,” where the cumulative buy and sell volumes are plotted against price levels. Such visualizations allow traders to quickly observe supply and demand imbalances.

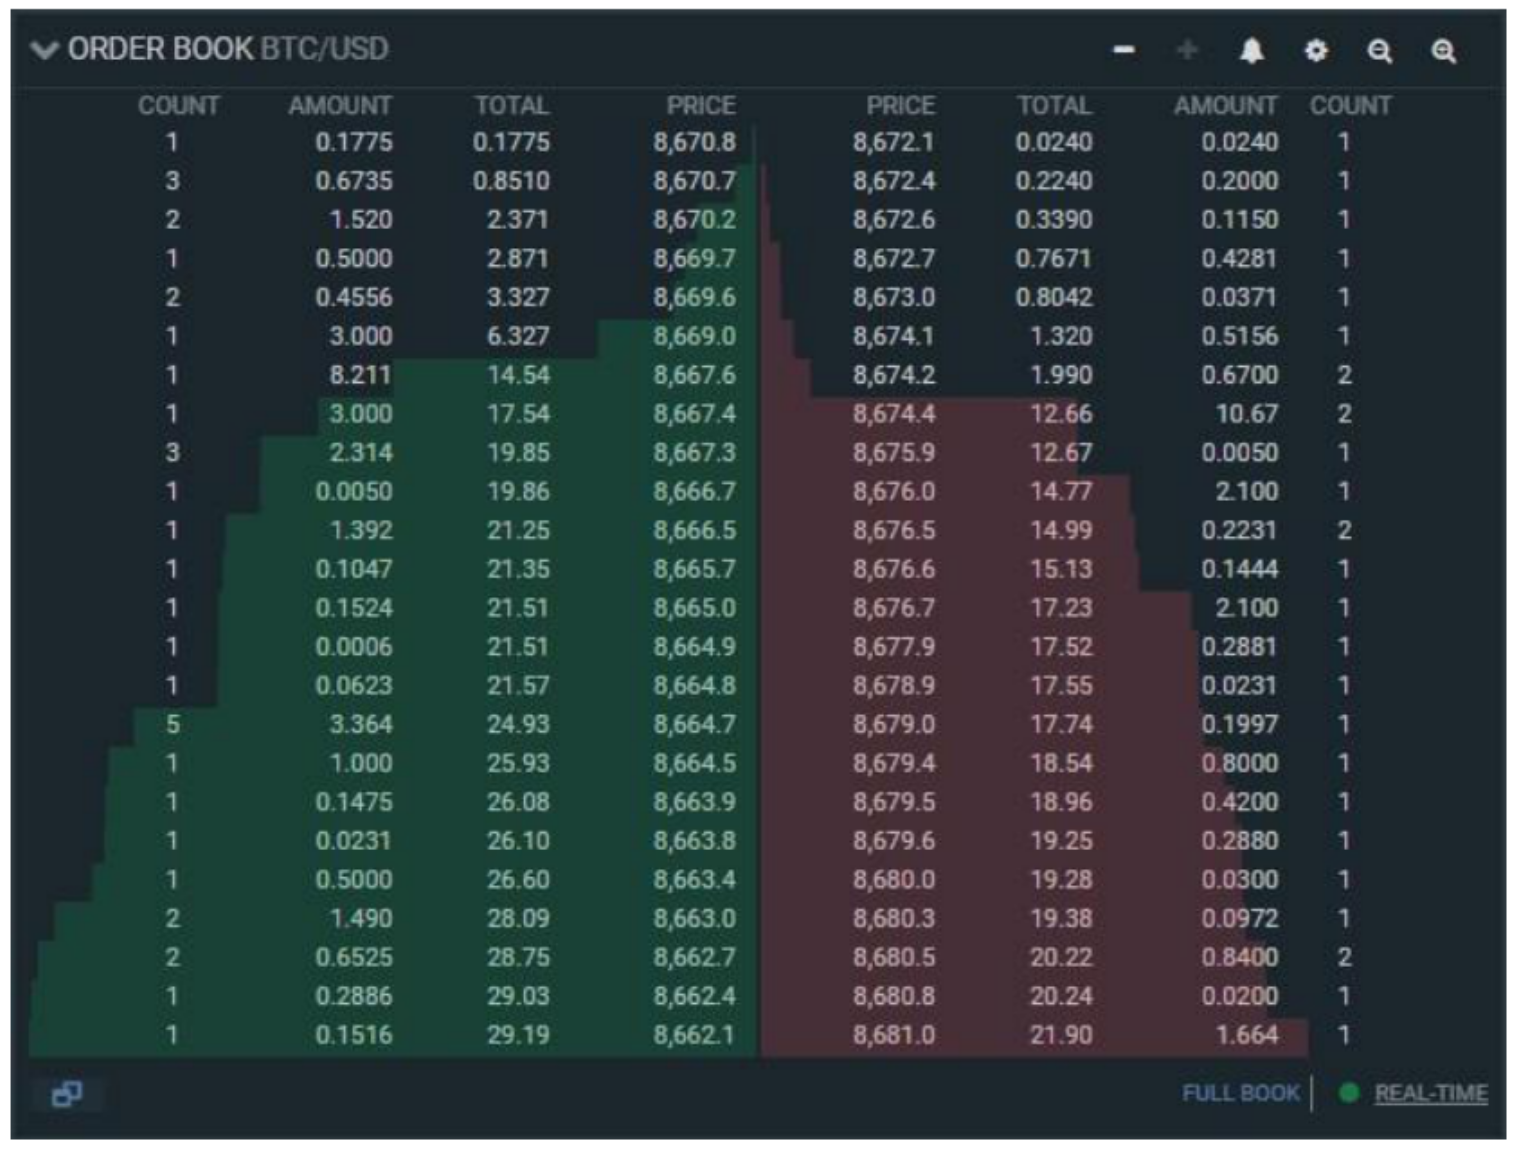
Figure 2. Example of an order book (depth chart representation).
Example of an order book with a depth chart representation
Source: screenshot from a trading platform.

Figure 2 shows the order book in a format that combines tabular bid-ask information with a depth chart. The green area represents cumulative buy-side liquidity, while the red area represents cumulative sell-side liquidity. This representation helps traders visualize how orders are distributed across price levels and where supply-demand imbalances may emerge in the market.

Evolution of the order book

The order book constantly evolves as new orders arrive, existing orders are cancelled, and trades are executed. Two main types of orders influence this evolution: limit orders and market orders.

Limit orders add liquidity to the market by specifying both a price and quantity at which a trader is willing to buy or sell. When a trader places a buy limit order below the current market price or a sell limit order above it, the order enters the order book and waits to be matched.

Market orders, in contrast, remove liquidity. A market buy order immediately matches with the lowest available sell orders, while a market sell order matches with the highest available buy orders. As these trades execute, they reduce the quantities available in the order book and may shift the best bid and ask prices.

The interaction between incoming limit orders and market orders continuously reshapes the order book and drives short-term price movements.

Order priority rules

Electronic markets generally follow two key priority rules when matching orders: price priority and time priority.

Price priority means that orders offering better prices are executed first. For example, among buy orders, the highest bid has priority, while among sell orders the lowest ask has priority.

If multiple orders are placed at the same price level, time priority applies. The order that was submitted earlier will be executed before later orders. This rule encourages traders to submit orders quickly if they want to secure execution.

These priority mechanisms ensure fairness and transparency in electronic trading systems.

Price impact and transaction prices

The execution of orders can influence market prices, a phenomenon known as price impact. When large market orders consume multiple levels of liquidity in the order book, the transaction price may move significantly.

For example, if a large buy market order exceeds the quantity available at the best ask price, the trade will continue matching with higher ask prices. This process pushes the transaction price upward and illustrates how large orders can move markets.

Transaction prices and traded volumes therefore provide important information about market activity. High trading volumes often indicate strong participation and may reinforce price trends.

Liquidity characteristics of the order book

The order book provides several indicators that help measure market liquidity.

Bid-ask spread is the difference between the best bid and best ask price. A narrow spread typically indicates a liquid market with low transaction costs.

Market depth refers to the total quantity of buy and sell orders available at different price levels. A deep order book allows large trades to be executed without significantly affecting prices.

Market breadth describes how widely orders are distributed across price levels. A broad distribution indicates active participation from many traders.

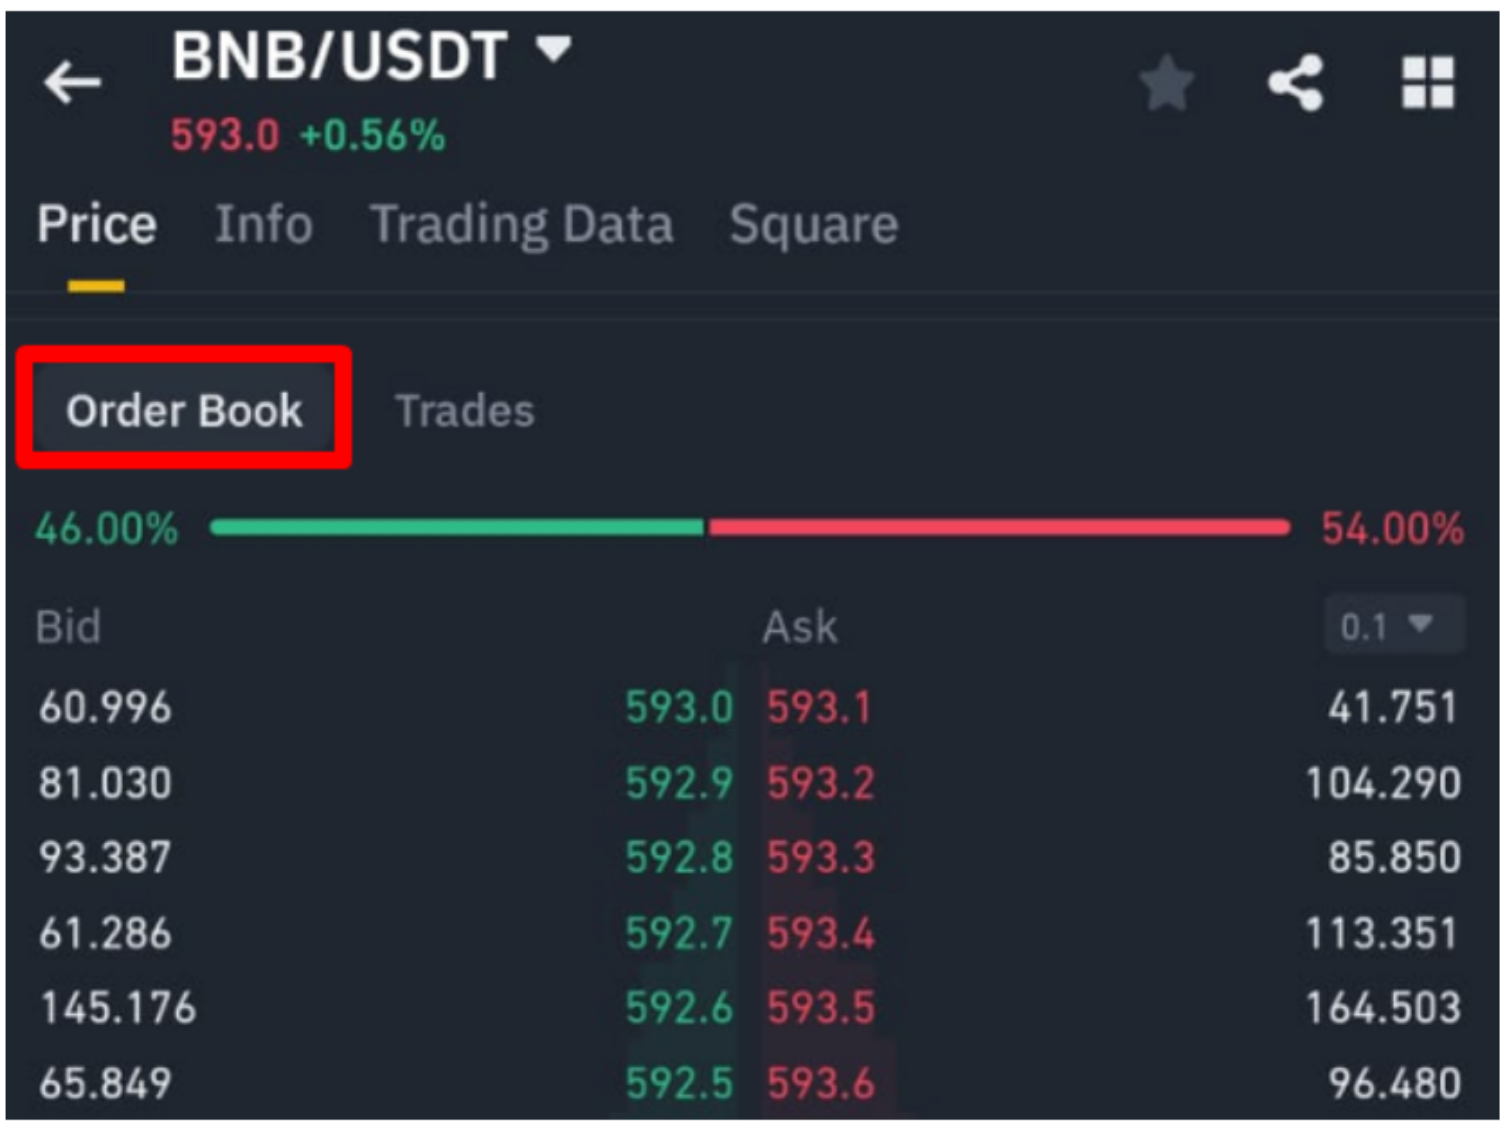
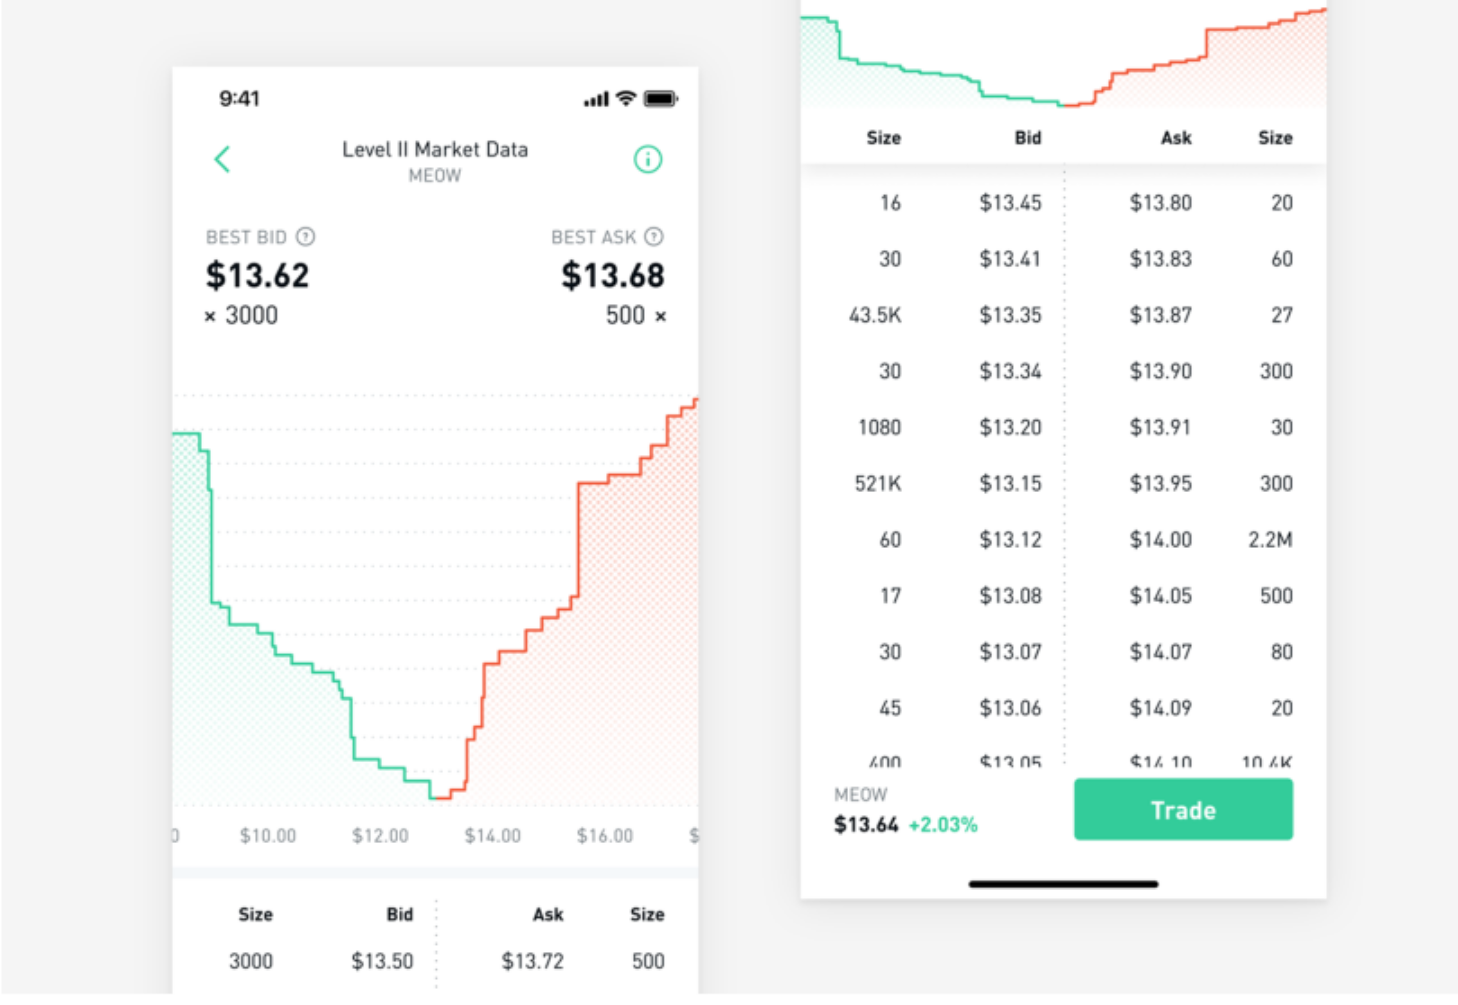
Figure 3. Example of an order book (used to assess liquidity).
Example of an order book used to assess liquidity
Source: screenshot from a trading platform.

Figure 3 provides a mobile-style visualization of the order book, showing the best bid, the best ask, and the quantities available on both sides of the market. It is particularly useful for illustrating liquidity measures such as bid-ask spread, visible depth, and market breadth. By comparing the quoted quantities at different prices, traders can better evaluate the strength of buying and selling pressure.

Resilience measures how quickly the order book replenishes after large trades remove liquidity. A resilient market quickly attracts new orders and stabilizes prices.

These liquidity measures help traders evaluate the quality and stability of a market.

Why should I be interested in this post?

For ESSEC students interested in business and finance, understanding the order book is fundamental to analyzing financial markets and trading behavior. It provides practical insight into how prices are formed, how liquidity affects execution, and how real-time data informs strategic decisions.

Mastering order book analysis strengthens financial reasoning, improves understanding of market microstructure, and supports more informed investment or trading strategies. This knowledge is directly relevant for careers in finance, trading, investment analysis, and quantitative research.

Related posts on the SimTrade blog

   ▶ Federico DE ROSSI Understanding the Order Book: How It Impacts Trading

   ▶ Jayna MELWANI The impact of market orders on market liquidity

   ▶ Lokendra RATHORE Good-til-Cancelled (GTC) order and Immediate-or-Cancel (IOC) order

   ▶ Clara PINTO High-frequency trading and limit orders

Useful resources

SimTrade course — Trade orders

SimTrade course — Market making

SimTrade simulation — Market orders

SimTrade simulation — Limit orders

About the author

The article was written in April 2026 by Bochen LIU (Queen’s Smith School of Business, BCom 2023–2027; ESSEC BBA Exchange Program, Fall 2025).

   ▶ Discover all posts by Bochen LIU

The impact of market orders on market liquidity

Jayna MELWANI

In this article, Jayna MELWANI (ESSEC Business School, Global BBA, 2019-2023) explains about the financial concept of market liquidity and specifically the impact of market orders on market liquidity.

What is a market order?

A market order is a type of order used in trading that instructs the broker to buy or sell a security immediately at the prevailing market price. Market orders are used when the trader wants to execute the trade quickly and does not want to wait for a specific price.

What is market liquidity and how do market orders affect it?

The impact of a market order on market liquidity can be significant. Market liquidity refers to the ability of traders to buy and sell securities quickly and easily without causing significant changes in the price. When a large number of market orders are executed, it can impact the liquidity of the market by causing sharp changes in the supply and demand for the securities being traded.

For example, if a large number of market orders are executed to sell a particular stock, it can result an increase in supply of the stock in the market, which can cause the price to drop significantly. Similarly, if a large number of market orders are executed to buy a particular stock, it can result in an increase in demand for the stock, which can cause the price to rise sharply.

In addition to impacting the price of the security being traded, market orders can also impact the liquidity of the market as a whole. When market orders are executed, it can cause sudden changes in the supply and demand for securities, which can impact the ability of other traders to buy or sell securities at favorable prices. This can make it more difficult for traders to execute their trades quickly and efficiently, which can reduce overall market liquidity.

Overall, the impact of a market order on market liquidity depends on several factors, including the size of the order, the liquidity of the security being traded, and the overall market conditions. Traders who use market orders should be aware of the potential impact on market liquidity and consider using other types of orders, such as limit orders or stop orders, to minimize the impact of their trades on the market. By doing so, traders can help to ensure that the market remains liquid and efficient, which benefits all market participants.

Why should I be interested in this post?

Understanding market liquidity is important for making informed investment decisions. As business school students, understanding market liquidity can help to make more informed decisions as assets with high liquidity are generally easier to buy and sell quickly and at a fair price.

By understanding market liquidity, students can gain insight into how financial markets work and how liquidity affects asset prices. This knowledge can help students better analyze market trends, predict market movements and make informed investment decisions.

Furthermore, for students pursuing a career in finance, understanding market liquidity can be a valuable asset. Financial institutions and investment firms value employees who possess a deep understanding of market dynamics, including market liquidity.

Related posts on the SimTrade blog

▶ Federico DE ROSSI Understanding the Order Book: How It Impacts Trading

▶ Lokendra RATHORE Good-til-Cancelled (GTC) order and Immediate-or-Cancel (IOC) order

▶ Clara PINTO High-frequency trading and limit orders

Useful resources

SimTrade course Trade orders

About the author

The article was written in April 2023 by Jayna MELWANI (ESSEC Business School, Global BBA, 2019-2023).

Understanding the Order Book: How It Impacts Trading

Federico De ROSSI

In this article, Federico DE ROSSI (ESSEC Business School, Master in Strategy & Management of International Business (SMIB), 2020-2023) talks about the order book and explains its role in financial markets.

Introduction

Understanding the order book is critical when it comes to trading in financial markets. In this article, we’ll go over what an order book is and how it affects trading.

What is an order book?

An order book for a stock, currency, or cryptocurrency is a list of buy and sell limit orders for that asset. It shows the pricing at which buyers and sellers are willing to negotiate, as well as the total number of orders available at each price. The order book is a necessary component of every trading platform since it gives a snapshot of the current market situation, of the price of the assets, and of the liquidity of the market. Thus, it is a crucial tool for traders who want to make informed decisions when entering or exiting deals.

How does an order book work?

The order book is a constantly updated record of buy and sell orders. When a trader puts a limit order, it is placed in the order book at the stated price. As a result, there is a two-sided market with distinct prices for buyers and sellers.

The order book is divided into two sections: bid (buy) and ask (sell). All open buy orders are displayed on the bid side, while all open sell orders are displayed on the ask side. The order book also shows the total volume of buy and sell orders at each price level.

In Tables 1 and 2 below, we give below two examples of order book from online brokers. We can see the two parts of the order book side by side: the “Buy” part and the “Sell” part. Every line of the order book corresponds to a buy or sell proposition for a give price (“Buy” or “Sell” columns) and a given quantity (“Volume” columns). For a given line there may be one or more orders for the same price. When there are several orders, the quantity in the “Volume” column is equal to the sum of the quantities of the different orders. Associated to the order book, there is often a chart which indicates the cumulative quantity of the orders in the order book at a given price. This chart gives an indication of the liquidity of the market in terms of market spread, market breadth, and market depth (see below for more explanations about theses concepts).

The “Buy” and “Sell” parts of the order book can be presented side by side (Table 1) or above each other (Tables 2 and 3) with the “Sell” part (in red) above the “Buy” part (in green) as the price limits of the sell limit orders are always higher than the price limits of the buy limit orders.

Table 1. Example of an order book (buy and sell parts presented side by side).
Order book
Source: online broker (Fortuneo).

Table 2. Example of an order book (buy and sell parts presented above each other).
Order book
Source: online broker (Cryptowatch).

Table 3. Example of an order book (buy and sell parts presented next to each other).
Order book
Source: online broker (Binance).

In a typical order book, the buy side is organized in descending order, meaning that the highest buy orders (i.e., the orders with the highest bid prices) are listed first, followed by the lower buy orders in descending order of price. The highest buy order in the book represents the best bid price, which is the highest price that any buyer is currently willing to pay for the asset.

On the other side of the order book, the sell side is organized in ascending order, with the lowest sell orders (i.e., the orders with the lowest ask prices) listed first, followed by the higher sell orders in ascending order of price. The lowest sell order in the book represents the best ask price, which is the lowest price that any seller is currently willing to accept for the asset.

This organization of the order book makes it easy for traders to see the current market depth and the best available bid and ask prices for an asset. When a buy order is executed at the best ask price or a sell order is executed at the best bid price, the order book is updated in real-time to reflect the new market depth and the new best bid and ask prices.

Table 4 below represents how the order book (limit order book) in trading simulations the SimTrade application.

Table 4. Order book in the SimTrade application.
Order book in the SimTrade application

You can understand how the order book works by launching a trading simulation on the SimTrade application.

The role of the order book in trading

As mentioned before, the order book is incredibly significant in trading. It acts as a market barometer, delivering real-time information about the supply and demand for an asset. Traders can also use the order book to determine market sentiment. If the bid side of the order book is strongly occupied, for example, it could imply that traders are optimistic on the asset. Thanks to the data in the order book, traders can get different information out of it.

Three characteristics of the order book

Market spread

The market spread, also known as the bid-ask spread, is the difference between the highest price a buyer is willing to pay for an asset (the bid price) and the lowest price a seller is willing to accept (the ask price) at a particular point in time.

The market spread is a reflection of the supply and demand for the asset in the market, and it represents the transaction cost of buying or selling the asset. In general, a narrow or tight spread indicates a liquid market with a high level of trading activity and a small transaction cost, while a wider spread suggests a less liquid market with lower trading activity and a higher transaction cost.

Market breadth

Market breadth is a measure of the overall health or direction of a market, sector, or index. It refers to the number of individual stocks that are participating in a market’s movement or trend, and can provide insight into the underlying strength or weakness of the market.

Market breadth is typically measured by comparing the number of advancing stocks (stocks that have increased in price) to the number of declining stocks (stocks that have decreased in price) over a given time period. This ratio is often expressed as a percentage or a ratio, with a higher percentage or ratio indicating a stronger market breadth and a lower percentage or ratio indicating weaker breadth.

For example, if there are 1,000 stocks in an index and 800 of them are increasing in price while 200 are decreasing, the market breadth ratio would be 4:1 or 80%. This would suggest that the market is broadly advancing, with a high number of stocks participating in the upward trend.

Market depth

Finally, market depth is a measure of the supply and demand of a security or financial instrument at different prices. It refers to the quantity of buy and sell orders that exist at different price levels in the market. Market depth is typically displayed in a market depth chart or order book.

It can provide valuable information to traders and investors about the current state of the market. A deep market with large quantities of buy and sell orders at various price levels can indicate a liquid market where trades can be executed quickly and with minimal impact on the market price. On the other hand, a shallow market with few orders at different price levels can indicate a less liquid market where trades may be more difficult to execute without significantly affecting the market price.

Analyzing order book data

Data from order books can be used to gain insight into market sentiment and trading opportunities. For example, traders can use the bid-ask spread to determine an asset’s liquidity. They can also examine the depth of the order book to determine the level of buying and selling interest in the asset. Traders can also use order book data to identify potential trading signals. For example, if the bid side of the order book is heavily populated at a certain price level, this could indicate that the asset’s price is likely to rise. On the other hand, if the ask side is heavily populated at a certain price level, it could indicate that the asset’s price is likely to fall.

Benefits of using order book data for trading

Using order book data can provide traders with a number of advantages.

For starters, it can be used to gauge market sentiment and identify potential trading opportunities.

Second, it can assist traders in more effectively managing risk. Traders can identify areas of support and resistance in order book data, which can then be used to set stop losses and take profits.

Finally, it can aid traders in the identification of potential trading signals. Traders can identify areas of potential buying and selling pressure in order book data, which can then be used to enter and exit trades.

How to use order book data for trading

Traders can use order book data to gain a competitive advantage in the markets. To accomplish this, they must first identify areas of support and resistance that can be used to set stop losses and profit targets.

Traders should also look for indications of buying and selling pressure in the order book. If the bid side of the order book is heavily populated at a certain price level, it could indicate that the asset’s price is likely to rise. On the other hand, if the ask side is heavily populated at a certain price level, it could indicate that the asset’s price is likely to fall.

Finally, traders should use trading software to automate their strategies. Trading bots can be set up to monitor order book data and execute trades based on it. This allows traders to capitalize on trading opportunities more quickly and efficiently.

Conclusion

To summarize, the order book is a vital instrument for financial market traders. It gives real-time information about an asset’s supply and demand, which can be used to gauge market mood and find potential trading opportunities. Traders can also utilize order book data to create stop losses and take profits and to automate their trading techniques. Traders might obtain an advantage in the markets by utilizing the power of the order book.

Related posts on the SimTrade blog

▶ Jayna MELWANI The impact of market orders on market liquidity

▶ Lokendra RATHORE Good-til-Cancelled (GTC) order and Immediate-or-Cancel (IOC) order

▶ Clara PINTO High-frequency trading and limit orders

▶ Akshit GUPTA Analysis of The Hummingbird Project movie

Useful resources

SimTrade course Trade orders

SimTrade course Market making

SimTrade simulations Market orders   Limit orders

About the author

The article was written in March 2023 by Federico DE ROSSI (ESSEC Business School, Master in Strategy & Management of International Business (SMIB), 2020-2023).