How to compute the net present value of an investment in Excel

How to compute the net present value of an investment in Excel

Maite CARNICERO MARTINEZ

In this article, Maite CARNICERO MARTINEZ (ESSEC Business School, Global Bachelor of Business Administration, 2021-2022, exchange student from the University of Salamanca) explains how to compute the net present value of an investment in Excel.

When the time comes that one must choose what project to embark on, there are several measures to compare the available options, such as the internal rate of return, the payback method and the net present value (also known as the “discounted cash flow” method or DCF). In this article, I will focus on the last one of these tools, which is the preferred by most financial analysts.

A project is a temporary, unique and progressive endeavor to produce a tangible or intangible result, for instance, a new product or a competitive advantage. It normally entails the execution of some tasks over a period of time, conditioned to limitations related to cost, quality or performance. During its implementation, an initial investment and a series of cash flows are to be generated at different times. Some examples of projects are: developing a new service, building a factory, and implementing a new process.

The Net Present Value (NPV) compares the present value of the future cash flows with the investment made at the beginning. The computation of the present value uses a the required rate of return. It takes into account the time value of money, translating future cash flows into today’s value, since the buying power of money today is greater that the buying power of the same amount in the future.

The NPV is the basis of the discounted cash flow model (DCF) which allows investors to compare the initial cash flow of expenditure against the present value of future cash flows. It could be used to evaluate whether an important investment is worthwhile, but also in mergers and acquisitions and to compare companies, like Warren Buffet does, because once we have calculated the different NPVs we will know which investment has the biggest gain.

To sum up, the NPV allows us to do evaluate investments from a financial point of view and select the best one.

Modelling of an investment

How can we calculate it?

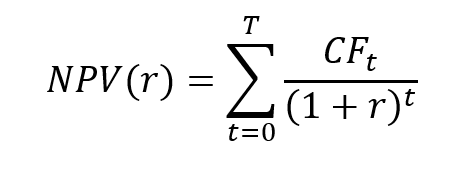
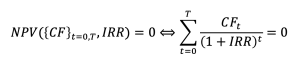
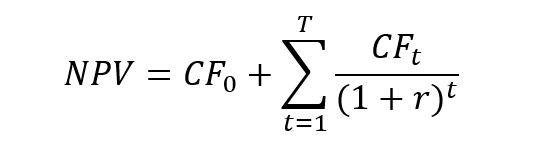
The mathematical formula for the NPV is given by:

NPV formula

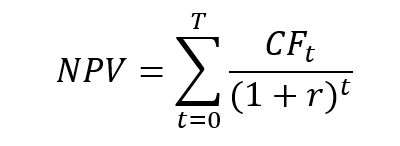
CFt = cash flows of each period (from t=0 to t=T)
T = number of periods
r = discount rate or interested rate required of the investment. It is the rate of return that the investors expect on their investment

For a classical project, the first cash flow, CF0, is negative and corresponds to the initial cost of the project and the following cash flows, CFt for t=1 to t=T, are assumed to be positive. The NPV can be rewritten as

NPV formula

This formula clearly shows that the NPV compares the first cash flow on the one hand, and the present value of future cash flows on the other hand. As the initial cash flow is negative and the present value of future cash flows is positive, the sign of the NPV depends on relative weight of these two components.

Investment decision

The NPV can be used as a criterion for the investment decision.

  • If the NPV is positive, the investment should be made as it creates value.
  • If the NPV is zero, the investment should be made or not.
  • If the NPV is negative, the investment should not be made as it destroys value.

Advantages

  • The NPV of an investment is easy to calculate, specially nowadays with financial calculators and spreadsheets like Excel.
  • The NPV measures the effect of the investment on the firm’s value.
  • The NPV It takes into account the maturity of each cash flow.

Disadvantages

  • In order to compute the NPV, the discount rate has to be specified and it is a difficult issue.
  • The calculations are based on assumptions and estimations and the reality can differ from them.
  • Misestimations can be found in the initial investment, on the discount rate and on the projected returns of the project.
  • The NPV formula presumes that the cash flows are immediately reinvested at the same rate as the discount rate.
  • It presumes that the negative cash flows are financed with resources whose cost is also the discount rate.

How to compute the NPV on Excel?

Example

Excel is an extended tool in the financial world, also to calculate the NPV. Let’s take an example to illustrate how we can use it: we are offered a project in which we have to invest 42,000 euros and we will receive 8,400 euros the first year, 9,000 the second, 10,300 the third, 11,700 the fourth and 13,000 the last year.

NPV formula

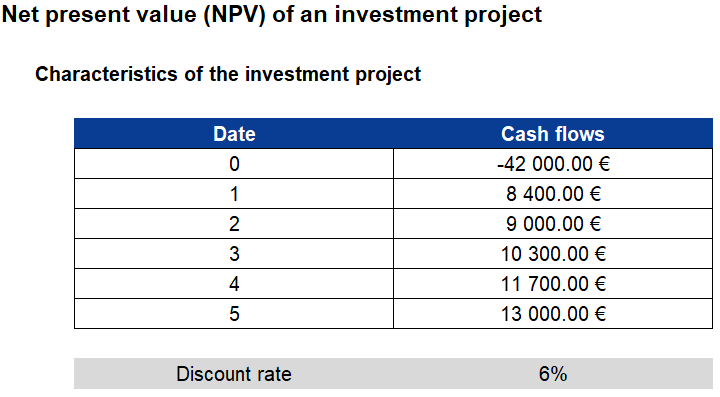
Assuming that the discount rate is 6% per year, what will be the NPV?

NPV formula

Hand-made computation

We can do a hand-made computation of the NPV:

NPV formula

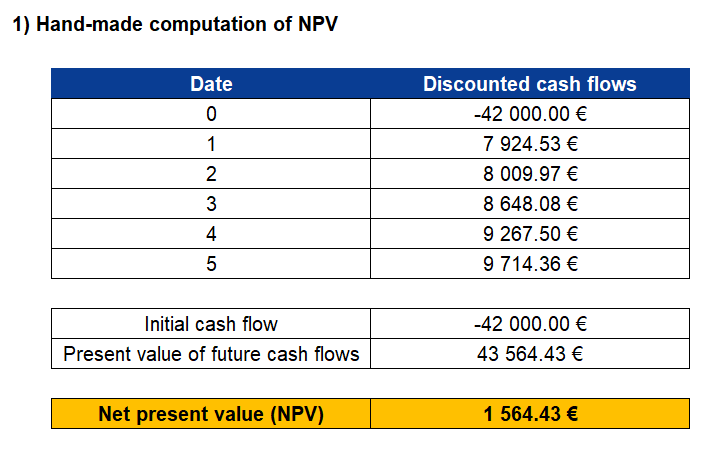
We find a NPV of €1,564.43. As the NPV of the investment is positive, we will take the project.

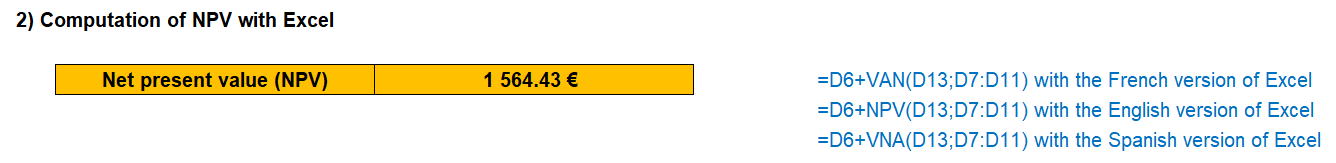
Computation with Excel

We can also use Excel to compute the NPV:

NPV Excel computation

Download the Excel file to compute the NPV of an investment

Related posts on the SimTrade blog

   ▶ William LONGIN How to compute the present value of an asset?

   ▶ Jérémy PAULEN The IRR function in Excel

   ▶ Raphaël ROERO DE CORTANZE The Internal Rate of Return

   ▶ Léopoldine FOUQUES The IRR, XIRR and MIRR functions in Excel

   ▶ Sébastien PIAT Simple interest rate and compound interest rate

   ▶ Rodolphe CHOLLAT-NAMY Bond valuation

Useful resources

longin.fr website Cours Gestion financière (in French).

Mazars Excel IRR Function And Other Ways To Calculate IRR In Excel

Economipedia NPV definition (in Spanish)

HBR NPV use and calculation

HBR NPV limitations

MyManagementGuide Project definition

About the author

The article was written in December 2021 by Maite CARNICERO MARTINEZ (ESSEC Business School, Global Bachelor of Business Administration, 2021-2022, exchange student from the University of Salamanca).

The IRR, XIRR and MIRR functions in Excel

The IRR, XIRR and MIRR functions in Excel

Photo Léopoldine FOUQUES

In this article, Léopoldine FOUQUES (ESSEC Business School, Global Bachelor of Business Administration, 2017-2021) presents the IRR function in Excel to compute the internal rate of return of a series of cash flows.

About Excel

Excel is by far the most used financial modeling tool across the world to build models and perform analysis. Knowing which Excel function to use can help employees in the financial sector (financial analysts, fund managers, risk managers, traders, etc.) to work faster and build a more powerful model.

The internal rate of return (IRR)

Definition

The computation of the internal rate of return (IRR) is based on the net present value (NPV) of an investment. In financial modelling, an investment is represented by a series of cash flows: CF0, CF1, CF2, …, CFT. For a classic investment, the first cash flow, CF0, is negative (outflow) and the future cash flows, CF1, CF2, …, CFT are positive (inflows).

The net present value (NPV) of an investment is computed according to the following formula:

NPV formula
where r is the discount rate that takes into account the risk of the project.

The IRR corresponds to the value of the discount rate for which the NPV is equal to 0:

IRR
The IRR is the solution of a non-linear equation:

IRR

Use in finance

One of the most important functions is the Internal Rate of Return (IRR) function, as it’s an easy function to compare an investment’s return, based on a series of cash flows.

The function is very useful in financial modeling. Indeed, it’s frequently used to compare scenarios before deciding about a project. An example is when a company is presented with two opportunities: one is investing in a new factory and the second is expanding its existing factory.

By using IRR, we can estimate the IRR for each scenario and verify which one is higher than the average cost of capital of the business (the Weighted Average Cost of Capital or WACC) is a calculation of a firm’s cost of capital in which each category is proportionally weighted).

The Excel functions to compute the IRR

Building a math-based calculation is time-consuming and complicated, so Excel offers three functions for the calculation of the internal rate of return: IRR, MIRR, and XIRR.

The IRR function

The IRR function uses one required argument and one optional:

  • The values: they represent the series of cash flows, including net income value and investments.
  • The guessed number for the expected internal rate of return. If omitted, the function will default to 0.1 (= 10%).

You can download the Excel file below in which I illustrate the use of the IRR function in Excel based on a simple example.

Download the Excel file to compute the IRR of an investment
Note that the IRR corresponds to a period rate. Monthly cash flows lead to a monthly IRR, quarterly cash flows lead to a quarterly IRR; and annual cash flows lead to an annual IRR. As, in practice, the standard is to work annual rates, monthly and quarterly IRR have to annualized.

Note that the use of the IRR function assumes that the period between each cash flow is the same (equal-size payment periods), for example one year.

From the IRR function to the XIRR function

If the period between each cash flow is not the same, the IRR function should not be used. It is the case with monthly cash flows as the months of the year may contain 28, 29, 30 or 31 days.

In this case, the XIRR function comes into play to calculate a correct internal rate of return, taking into consideration the periods of different sizes.

The XIRR function has three arguments:

  • The values
  • The dates for cash outflows and inflows.
  • The guessed number for the expected internal rate of return (optional argument).

You can download the Excel file below in which I illustrate the use of the IRR and XIRR functions in Excel based on a simple example.

Download the Excel file to compute the IRR and XIRR of an investment

From the IRR function to the MIRR function (Modified Internal Rate of Return)

The MIRR function is quite the same as the IRR function, except that it takes into consideration both the cost of borrowing the initial investment funds (discount rate) and reinvestment rates for future cash flows.

In contrast to IRR, MIRR assumes that cash flows from a project are reinvested at the firm’s cost of capital (rate of return on a portfolio company’s existing securities).

To compute the MIRR, the Excel function uses the following parameters:

  • The values
  • The guessed number for the expected internal rate of return (optional argument).
  • The financial rate: the finance rate of interest paid
  • The reinvest rate: the interest rate earned from the reinvested profit

MIRR formula
Where FV represents the Future Value of positive cash flows at the cost of capital for the company, PV represents the Present Value of negative cash flows at the financing cost of the company, and T represents the number of periods.

You can download the Excel file below in which I illustrate the use of the IRR and MIRR functions in Excel based on a simple example.

Download the Excel file to compute the IRR and MIRR of an investment
Some of the accountants say that the MIRR function is less valid than the other because not all the flows are reinvested fully. Although we can use a less important interest rate to compensate the partial investment; but we think the best approach will be the inclusion of the three calculations (IRR, XIRR, and MIRR).

Limits of the IRR

The non-linear equation for obtaining the IRR may have one solution, several solutions or no solution according to the sequence of cash flows. These represent limits of the IRR as an investor would like one value when estimating its investment.

Another limit of the IRR as a decision criterion for investing is that the result is not in agreement with the decision criterion based on NPV, which represents the value created by the investment.

You can download the Excel file below in which I provide an example to illustrate the limit of the IRR when selecting investment when two projects are available.

Download the Excel file to select investments based on IRR and NPV

Related posts on the SimTrade blog

▶ Jérémy PAULEN The IRR function in Excel

▶ Raphaël ROERO DE CORTANZE The Internal Rate of Return

▶ William LONGIN How to compute the present value of an asset?

▶ Sébastien PIAT Simple interest rate and compound interest rate

▶ Rodolphe CHOLLAT-NAMY Bond valuation

Useful resources

Mazars Excel IRR Function And Other Ways To Calculate IRR In Excel

About the author

The article was written in November 2021 by Léopoldine FOUQUES (ESSEC Business School, Global Bachelor of Business Administration, 2017-2021).

How to compute the IRR in Excel

How to compute the IRR in Excel

Photo Jérémy PAULEN Jeremy PAULEN

In this article, Jérémy PAULEN (ESSEC Business School, Global Bachelor of Business Administration, 2019-2023) explains everything about the IRR function in Excel, which is used to compute the internal rate of return of a series of cash flow to evaluate the financial performance of an investment in relative terms.

What is the IRR?

The IRR represents the internal rate of return of an investment. It is closely related to the net present value (NPV) of the investment as the IRR is the discount rate that makes the NPV equal to zero.

Consider an investment represented by a series of cash flows CF0, CF1, CF2, …, CFT, which take into account the revenues and expenses of the project computed or forecasted at time 0 leading to capital inflows and outflows for the firm. The NPV of this investment is given by:

NPV formula

where r is the discount rate that takes into account the risk of the project.

The IRR corresponds to the value of the discount rate for which the NPV is equal to 0:

IRR

The IRR is the solution of a non-linear equation:

IRR

Note that this equation may have one solution, several solutions or no solution according to the sequence of cash flows.

The internal rate of return (IRR) is an important indicator in the decision-making process as it measures the financial performance of a project. The IRR is a relative measure as its unit is a percentage. The NPV is an absolute measure as its unit is the euro, the dollar, etc.

It makes it possible to measure the future financial performance of a project or a company. The higher the IRR is, the more interesting it is to launch the project.

The IRR can therefore be used in the case of a choice to be made between different investment perspectives, but also to evaluate the company’s share buyback programs.

A limit of using the IRR method is that it does not consider the size of a project. Cash flows are simply compared to the amount of capital outlay generating those cash flows. In other words, considering two projects A and B, the IRR of A may be lower than the IRR of B, while the NPV of A may be higher than the NPV of B.

The IRR function in Excel

How to use the IRR function in Excel?

In Excel, you can get the IRR function in the “Formulas” tab.
You can also type “= IRR (value, [guess])” in the cell where you want to compute the IRR.

The IRR function uses the following arguments:

  • Values: The cash flow series. Cash flows include investment values and net income.
  • Guess: a number guessed by the user that is close to the expected internal rate of return

Example

Example: consider a new factory modeled by the following series of cash flows:

  • CF0 = -$50,000 (initial cost)
  • CF1 = +$5,000 (net cash flow in year 1)
  • CF2 = +$8,000 (net cash flow in year 2)
  • CF3 = +$13,500 (net cash flow in year 3)
  • CF4 = +$18,800 (net cash flow in year 4)
  • CF5 = +$20,500 (net cash flow in year 5)

Excel file to compute the IRR of a series of cash flows

You can download below a short video which illustrates how to compute the IRR of a series of cash flows with Excel.

Download a video to illustrate IRR with Excel

Related posts on the SimTrade blog

   ▶ Raphaël ROERO DE CORTANZE The Internal Rate of Return

   ▶ William LONGIN How to compute the present value of an asset?

   ▶ Rodolphe CHOLLAT-NAMY Bond valuation

   ▶ Léopoldine FOUQUES The IRR, XIRR and MIRR functions in Excel

   ▶ Sébastien PIAT Simple interest rate and compound interest rate

Useful resources

Microsoft IRR function

About the author

The article was written in November 2021 by Jérémy PAULEN (ESSEC Business School, Global Bachelor of Business Administration, 2019-2023)

The Internal Rate of Return

The Internal Rate of Return

img_SimTrade_Photo1_Raphael_Roero_de_Cortanze

In this article, Raphaël ROERO DE CORTANZE (ESSEC Business School, Grande Ecole Program – Master in Management, 2019-2022) explains the financial concept of internal rate of return (IRR).

What is the Internal Rate of Return?

The Internal Rate of Return (IRR or “TRI” – “taux de rendement interne” in French) of a sequence of cash flows is the discount rate that makes the Net Present Value (NPV or “VNP” or “VAN” for “valeur nette présente” or “valeur actuelle nette” in French) of this sequence of cash flows equal to zero.

Screenshot 2021-05-31 at 21.59.49

In order to calculate the IRR, two methods can be used. First of all, use the Excel “IRR” formula on the sequence of cash flows, which will automatically display an approximate value for the IRR. Nonetheless, if Excel is not available for performing the IRR calculation, you can use the dichotomy method (which is indeed used by Excel). The dichotomy method uses several iterations to determine an approximation of the IRR. The more iterations are performed, the more accurate the final IRR output is. For each iteration, the table below assesses whether the NPV using the “Average” discount rate is positive or negative. If it is negative (resp. positive), it means the IRR is somewhere in between the “Lower bound” (resp. “Upper bound” and the “Average”) and the next iteration will thus keep the same “Lower bound” (resp. use the “Average” as the new lower bound) and use the “Average” as the new “Upper bound” (resp. keep the same “Upper bound”). After 10 iterations, the table displays an IRR of 18,457%, which is an approximation to the nearest hundredth of the 18,450% IRR calculated with the Excel formula.

Screenshot 2021-05-31 at 22.08.50

The IRR criterion

In the same way as the NPV, the IRR can be used to evaluate the financial performance of:
A tangible investment: the IRR criterion can be used to evaluate which investment project will be the most profitable. For instance, if a firm hesitating between Project A (buying a new machine), Project B (upgrading the existing machine) and Project C (outsourcing a fraction of the production), the firm can calculate the IRR of each project and compare them.
A financial investment: whether it is a bank investment or a private equity investment (purchase of a company) the IRR criterion can be used to sort different projects according to their financial performance.

Disaggregating the IRR

Investors and especially Private Equity firms often rely on the IRR as one measure of a project’s yield. Projects with the highest IRRs are considered the most attractive. The performance of Private Equity funds is also measured through the IRR criterion. In other words, PE firms use the IRR to select the most profitable projects and investors look at the IRR of PE funds when choosing to which PE firms’ fundraising campaign, they will participate in.

Nonetheless, IRR is the most important performance benchmark for PE investments, the IRR does not go into detail. Indeed, disaggregating the IRR can help better understand which are the different components of the IRR:

  • Unlevered IRR components:
    • Baseline return: the cash flows that the acquired business was expected to generate without any improvements after acquisition.
    • Business performance: value creation through growth by improving the business performance, margin increase and capital efficiency improvements.
    • Strategic repositioning: value creation through by increasing the opportunity for future growth and returns (innovation, market entries etc.).
  • Leveraged IRR: PE investments heavily rely on high amounts or debt funding (hence the wide use of Leverage Buy-Out or LBO). Debt funding allows to resort to less equity funding, thus mechanically increasing the IRR of the investment.

Each of these components can have different proportions in the IRR. As an example, we can consider two PE funds A and B displaying the same IRR of 30%. After disaggregating each fund’s IRR, we come up with the following table, showing the weight of each IRR component in the total IRR (or “Levered IRR”). From this table, we understand that Fund A and Fund B have very different strategies. Fund A focuses in its PE operations on improving the business performance and carrying out strategic repositioning’s. Only 23% of the total IRR comes from financial engineering. In contrast, Fund B draws most of its performance from financial engineering, while only 23% of the total IRR comes from the unlevered IRR.

Screenshot 2021-05-31 at 22.09.00

Through this example we understand that PE funds and firms can have very different strategies, while disclosing the same IRR. Thus, disaggregating the IRR can reveal the positioning of PE funds. Finally, disaggregating the IRR also allows to assess whether PE funds are true to the strategy they display: for instance, a fund can be specialized in strategic repositioning and business performance improvements on the paper, but drawing most of its value creation through financial engineering.

Related posts on the SimTrade blog

   ▶ Jérémy PAULEN The IRR function in Excel

   ▶ Léopoldine FOUQUES The IRR, XIRR and MIRR functions in Excel

   ▶ William LONGIN How to compute the present value of an asset?

   ▶ Maite CARNICERO MARTINEZ How to compute the net present value of an investment in Excel

   ▶ Sébastien PIAT Simple interest rate and compound interest rate

Useful resources

Prof. Longin’s website Calcul de la VNP et du TRI d’une séquence de flux (in French)

Prof. Longin’s website Méthode de dichotomie pour le calcul du TRI (in French)

McKinsey A better way to understand internal rate of return

About the author

Article written in June 2021 by Raphaël ROERO DE CORTANZE (ESSEC Business School, Grande Ecole Program – Master in Management, 2019-2022).