Decoding Business Performance: The Top Line, The Line, and The Bottom Line

Decoding Business Performance: The Top Line, The Line, and The Bottom Line

Isaac ALLIALI

In this article, Isaac ALLIALI (ESSEC Business School, Bachelor in Business Administration (BBA), 2019-2023) decodes the business performance by analyzing the top line, the line, and the bottom line.

Introduction

In the realm of finance and business, terms like “top line,” “the line,” and “bottom line” often dominate discussions. But what do they really mean, and why are they so important in evaluating a company’s financial health? This article aims to elucidate these key financial terms and their relevance to business performance assessment.

The Top Line

The “top line” refers to a company’s gross revenue or sales, so named because it appears at the top of a company’s income statement. It reflects the total revenue earned from the sale of goods or services before deducting any costs or expenses. This figure is crucial as it indicates the company’s ability to sell its products or services, which is fundamental to its business operations.

The strategies for increasing the top line generally focus on enhancing sales through marketing efforts, pricing strategies, product development, or expanding into new markets. While it may seem that a growing top line (revenue) is indicative of profitability, it is important to recognize that this metric alone does not consider the expenses associated with generating that revenue. In other words, the increase in revenue does not guarantee increased profitability. It is crucial for investors to understand that a company’s top line growth does not always align with its profitability.

For instance, if the cost of producing goods or services is rising faster than sales, profits might be shrinking despite increased revenues.

The Line

While “the line” is a less commonly used term in comparison to the “top line” and “bottom line”, it is often used to refer to the “break-even line.” The break-even line represents a point where total costs (including both fixed and variable costs) are equal to total revenue.

At this juncture, the company isn’t making a profit, but it isn’t incurring a loss either. Understanding the break-even point is essential for businesses because it provides a clear target to cover costs and start making profits.

Knowing when a company will hit its break-even point can help investors understand when it might start turning a profit. In addition, a company with a lower break-even point can withstand market fluctuations better, representing a potentially less risky investment.

The Bottom Line

The “bottom line” is arguably the most significant figure on an income statement, representing the company’s net income. It’s the residue left after deducting all expenses, including cost of goods sold (COGS), operating expenses, interest payments, and taxes from the top line. This term gets its name because net income is listed at the bottom of the income statement.

The bottom line demonstrates a company’s profitability, and strategies to improve it usually focus on enhancing gross revenue or reducing costs. Shareholders closely monitor the bottom line because it directly affects earnings per share and dividends. However, solely focusing on improving the bottom line can sometimes lead to unsustainable strategies like excessive cost-cutting.

However, investors should also be aware that an increasing bottom line can sometimes be achieved through aggressive cost-cutting, which may not be sustainable in the long run. It’s important to scrutinize the sources of bottom-line growth: Is it due to increased sales, improved operational efficiency, or simply cost-cutting?

Conclusion

Understanding the terms “top line,” “the line,” and “bottom line” is crucial for interpreting a company’s financial performance. While the top line provides insight into sales performance and the bottom line into profitability, it’s the intricate story that unfolds between these two lines that often holds the most valuable insights for sustainable growth and profitability. As such, a holistic view of a company’s financial health should consider all these aspects.

By focusing on each line in tandem, companies can better navigate their path to profitability, creating strategies that stimulate sales growth (top line), manage costs effectively (the line), and ultimately drive profit (bottom line). However, these metrics should not be used in isolation. Investors should use them in conjunction with other financial ratios and indicators to make informed decisions.

By aligning their strategies to promote sales growth (top line) and efficient cost management practices (the line), companies can navigate their path to profitability. The aim is to strike a balance between revenue generation and cost control to drive profitability (bottom line). However, it’s important to note that these metrics should not be evaluated in isolation. Investors should consider utilizing other financial ratios and indicators to gain a comprehensive understanding of a company’s financial health. These may include profitability ratios (such as gross profit margin, operating margin, and net profit margin), liquidity ratios (like current ratio and quick ratio), debt ratios (such as debt-to-equity ratio and interest coverage ratio), and efficiency ratios (like inventory turnover and receivables turnover). Evaluating these indicators collectively provides a more comprehensive assessment of a company’s performance and prospects, empowering investors to make informed investment decisions. Each line tells a different part of the company’s financial story, and understanding the interplay between them is crucial for investment decision-making.

Illustration

Income statement of Ford.
 The Top Line, The Line, and The Bottom Line
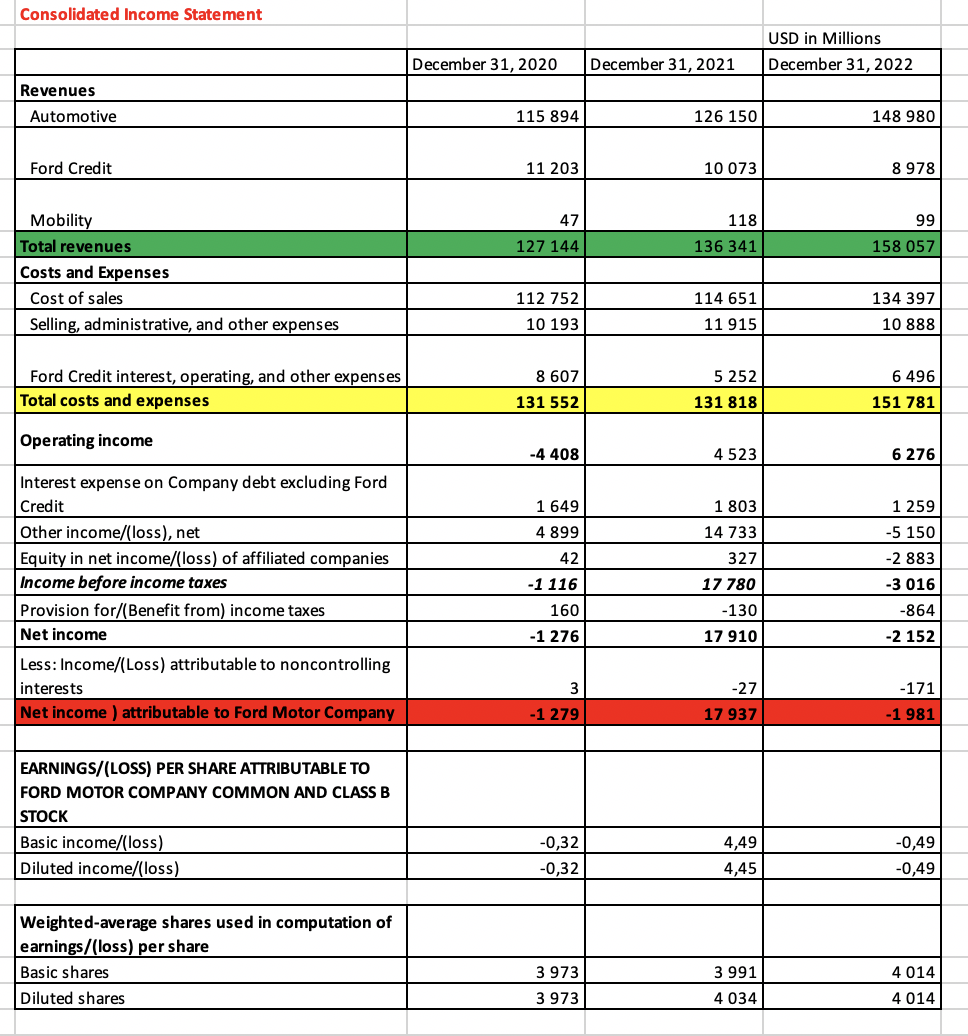
Source: the company.

Why should I be interested in this post?

These concepts form the foundation of financial analysis and provide valuable insights into a company’s financial performance. Understanding the top line, which represents revenue or sales, is crucial as it demonstrates a company’s ability to generate income and sustain growth. The bottom line, which reflects the net income or profit after deducting expenses, taxes, and interest, provides a measure of overall profitability. By delving into the line, which encompasses various expenses impacting profitability, finance students can gain a comprehensive understanding of financial statements and develop the analytical skills necessary to evaluate a company’s financial health, make informed investment decisions, and contribute to effective financial strategies. This knowledge is highly applicable in various finance-related roles and is instrumental in navigating the complexities of the business world.

Related posts on the SimTrade blog

   ▶ Bijal GANDHI Income Statement

   ▶ Bijal GANDHI Revenue

   ▶ Bijal GANDHI Cost of goods sold

About the author

The article was written in June 2023 by Isaac ALLIALI (ESSEC Business School, Bachelor in Business Administration (BBA), 2019-2023).

Operating Profit

Operating Profit

Bijal GANDHI

In this article, Bijal GANDHI (ESSEC Business School, Grande Ecole Program – Master in Management, 2019-2022) explains the concept of Operating profit.

This read will help you understand in detail the meaning, components and formula for calculating operating profit along with relevant examples.

Operating Profit

Operating profit refers to the profit obtained from business operations before the deduction of interest and taxes. Operating profit is a good representation of the company’s profits as all the core expenses are taken into consideration except interest and tax. It is synonymously used with “EBIT” (Earnings before interest and taxes) and “operating income”. Although, EBIT may sometimes include non-operating revenue.

Components and Formula

Operating profit is equal to:

Operating revenue – COGS – Operating expenses – Depreciation –Amortization

  • Gross profit: We know from the blog on revenue, gross profit equals revenue less COGS (cost of goods sold). Therefore, operating profit is often simplified as, Gross Profit – Operating expenses – Depreciation – Amortization.
  • Operating expenses refers to the expenses that a business undertakes during its normal operations such as rent, electricity, salary, etc. These expenses are generally divided into broad categories in the income statement to make it concise. For example, in the LVMH example below, the operating expenses are divided into three broad categories like marketing and sales, general and administrative and other such costs.
  • Depreciation refers to the value of the assets that have been used up every year. It is a method to allocate the cost of a physical asset over its useful life.
  • Amortization refers to the accounting method of spreading the cost of an intangible asset over its useful life.

Example: LVMH

Let us once take the example of LVMH. The French multinational company LVMH Moët Hennessy Louis Vuitton was founded in 1987. The company headquartered in Paris specializes in luxury goods and stands at a valuation (market capitalization in June 2021) of $329 billion. It is a consortium of 75 brands controlled under around 60 subsidiaries. Here, you can find a snapshot of LVMH Income statement for three years: 2018, 2019 and 2020.

Bijal Gandhi

The operating profit for the year 2020 is 7,972 million euros. This means that from a revenue of 44,651 million euros in 2020, the company is now left with 7,972 million euros after deducting all expenses except interest and tax.

Operating profit vs Net profit

Net profit refers to the amount that a company is left with after deducting all expenses including interest and tax. For example, in the snapshot above, net profit is 4,702 million euros as compared to the operating profit of 7,972 million euros. This means that the total interest and tax expenses amounted to 7,972 less 4,702 million euros. Net profit which is also referred to as “bottom line” gives us a picture of the overall performance of the company and its management.

Exclusions from operating profit

There are several exclusions from operating profit because operating profit is calculated with the purpose of understanding the performance of a company’s core business only.

The revenue from the sale of an asset is not part of the operating profit. Similarly, investment income, interest income and debt interest expenses are not part of the company’s core business and therefore excluded from the calculation of operating profit.

Related posts on the SimTrade blog

   ▶ Bijal GANDHI Income statement

   ▶ Bijal GANDHI Revenue

   ▶ Bijal GANDHI Cost of goods sold

About the author

Article written in July 2021 by Bijal GANDHI (ESSEC Business School, Grande Ecole Program – Master in Management, 2019-2022).

Revenue

Revenue

Bijal Gandhi

In this article, Bijal GANDHI (ESSEC Business School, Grande Ecole Program – Master in Management, 2019-2022) delves deeper into the accounting concept of revenue.

This read will help you understand in detail the meaning, types and calculation of revenue  along with relevant examples.

What is revenue?

Revenue is referred to the money brought into a company from the sale of either goods, services, or both. Revenue is synonymous to sales and top line. This is because it first line on the income statement and it is a good indicator of a business’s performance. Revenue consists of two components, the price and the number of products/services sold. It is then calculated in the following manner:

Bijal Gandhi

Gross revenue vs net revenue

Gross revenue is simply the income generated from a sale without consideration for any expenses that might have occurred. Net revenue is the income after subtracting all the cost of goods sold and other expenses related to running the business.

For example, if Alpha sells 2,000 toy cars at $100 each, its gross revenue for the month would be $200,000. If the cost of producing each car was $25, their net revenue would be 2,000 x ($100 – $25) toy cars or $150,000.

Revenue example: LVMH

Let us once again take the example of LVMH. The French multinational company LVMH Moët Hennessy Louis Vuitton was founded in 1987. The company headquartered in Paris specializes in luxury goods and stands at a valuation of $329 billion. It is a consortium of 75 brands controlled under around 60 subsidiaries. Here, you can find a snapshot of LVMH Income statement for three years: 2018, 2019 and 2020.

Bijal Gandhi

Here, the revenue, also known as top line, is 44,651 million euros for the year 2020. The revenue is the sum of income generated from all divisions. In the snapshot below, the revenue is a consolidation of income generated by several brands that sell wines, spirits, fashion, leather goods, perfumes, etc.

Accrued vs deferred revenue

Accrued revenue refers to the revenue earned by a company for which the goods are delivered but the payment is yet to be received. In this type of accounting, the revenue is recorded irrespective of whether the cash is received or not.

Deferred revenue refers to the revenue for which the customer has already made the payment, but the company is yet to deliver the goods. Here, in accounting the company will record the cash payment but that the revenue is unearned, but it will not recognize the revenue on the income statement.

How do revenue & earnings differ?

Revenue refers to the income generated by a company before deducting expenses, while earnings refer to the profit earned by the company after deducting the expenses, interest, and taxes from revenue.

Earnings is synonymous to net income or the bottom line. Along with revenue, it is also a very important indicator of a company’s performance.

How do revenue & cash flows differ?

Cash flow refers to the total amount of cash that moves into or out of the company. While revenue is the indicator of a company’s overall effectiveness, the cash flow is an indicator of liquidity.

Related posts on the SimTrade blog

   ▶ Bijal GANDHI Income statement

   ▶ Bijal GANDHI Cost of goods sold

About the author

Article written in May 2021 by Bijal GANDHI (ESSEC Business School, Grande Ecole Program – Master in Management, 2019-2022).

Cost of goods sold

Cost of goods sold

Bijal GANDHI

In this article, Bijal GANDHI (ESSEC Business School, Grande Ecole Program – Master in Management, 2019-2022) explains Cost of goods sold.

This read will help you understand in detail the meaning and components of cost of goods sold along with relevant examples.

Introduction

Cost of goods sold (COGS) refers the sum of all costs directly related to the production of the goods. It is fundamentally very similar to cost of sales and hence synonymously used. Some examples of items that make up COGS include,

  • Cost of raw materials
  • Direct labor costs
  • Heat and electricity charges
  • Overheads

Components and Formula

The COGS is calculated using the following formula,

COGS = (Beginning Inventory + Purchases) – Ending Inventory

• Beginning Inventory is the total value of the inventory left over or not sold from the previous year.

• Cost of goods is the sum of all costs directly related to the production of the goods or the purchase value of the same (in case of retailer or distributor)

• Ending inventory is the total value of the remaining inventory that was not sold till the end of the financial year. This number is carried forward to next year.

Example: LVMH

Let us once again take the example of LVMH. The French multinational company LVMH Moët Hennessy Louis Vuitton was founded in 1987. The company headquartered in Paris specializes in luxury goods and stands at a valuation of $329 billion. It is a consortium of 75 brands controlled under around 60 subsidiaries. Here, you can find a snapshot: 2018, 2019 and 2020.

Bijal Gandhi

In the income statement, COGS is placed just below revenue (Link to the blog) to easily compare the numbers and derive the gross margin. For example, in the snapshot of LVMH income statement below, the cost of sales for the year 2020 is 15,871 million euros for the revenue of 44,651 million euros resulting in a gross margin of 28,780 million euros.

Direct costs vs indirect costs

Direct cost refers to the costs that are directly associated with the production of goods and services. They are generally variable in nature as they fluctuate depending upon the production. Some examples of direct costs include, raw materials, direct labour, manufacturing supplies, fuel, power, wages, etc. Most importantly, direct costs are the ones that can be directly assigned to the product or service.

Indirect costs are those which cannot be assigned to one specific product or service. These costs are those that apply to more than one business activity. For example, rent, employee salary, utility and administrative expenses, overheads, etc. These costs may be fixed or variable in nature.

COGS vs operating costs

Operating costs are expenses that are not directly related to the production of goods or services. The operating expenses are a separate line item in the income statement, and they include indirect costs like salaries, marketing, rent, utilities, legal and admin costs, etc.

It is important to classify the costs correctly as either COGS or operating. This will help managers differentiate well between the two and effectively build a budget for the same.

Related posts on the SimTrade blog

   ▶ Bijal GANDHI Income statement

   ▶ Bijal GANDHI Revenue

About the author

Article written in May 2021 by Bijal GANDHI (ESSEC Business School, Grande Ecole Program – Master in Management, 2019-2022).

Income Statement

Income Statement

Bijal GANDHI

In this article, Bijal GANDHI (ESSEC Business School, Grande Ecole Program – Master in Management, 2019-2022) explains briefly the structure of an Income Statement.

This reading will help you understand the structure and the main components of the income statement.

Introduction

Income statement is a financial statement that reports the financial performance of an entity over a specified accounting period. The financial performance is measured by summarizing all income and expenses over a given period. Also known as ‘Profit and Loss’ Statement, the Income statement helps the company have a look at the profits for the year and helps it take financial decisions about costs and revenues. The Income statement is also the basis for the tax institution to compute the income tax that the company has to pay every year. The Income statement also allows shareholders to know the dividends that they can receive from the earnings.

Structure of an income statement

Bijal Gandhi

Main components of an income statement

The income statement may slightly vary sometimes depending upon the type of company and its expenses and income, but the general structure and lines may remain the same.

  • Revenue: Also known as top line, revenue or sales revenue refers to the value of the total quantity sold multiplied by the average price of goods or services sold.
  • Cost of goods sold: The cost of goods sold is the sum of all the direct costs associated with a product or service. For example, labor, materials, equipment, machinery, etc.
  • Gross Profit: Gross profit is derived after subtracting the cost of goods from sales/revenue.
  • Indirect Expenses: Indirect expenses include general, selling, and administrative expenses like marketing, advertisement, salary of employees, office, and stationery, rent, etc.
  • Operating Income: Gross profit less indirect expenses are equal to operating income. It is the firm’s profit before non-operating expenses and income, taxes and interest expenses are subtracted from revenues.
  •  Interest Expenses/Income: Interest expense/income is deducted/added from operating income to derive earnings before tax.
  • Tax: The taxes are deducted from pre-tax income to derive the net income. The taxes can be both current and future. The net income then flows to retained earnings on the balance sheet after deducting dividends.

Example: LVMH

The French multinational company LVMH Moët Hennessy Louis Vuitton was founded in 1987. The company headquartered in Paris specializes in luxury goods and stands at a valuation of $329 billion (market capitalization in June 2021). It is a consortium of 75 brands controlled under around 60. Here, you can find a snapshot of LVMH Income statement for three years: 2018, 2019 and 2020.

Bijal Gandhi

Most important components of an income statement include:

  • Total Revenue= Sum of Operating and Non-Operating Revenues for the accounting period. ($ 44,651)
  • COGS: Cost of goods Sold is the total cost of sales of the products actually sold. ($15,871)
  • Gross Margin = Net Sales – Total COGS ($28780)
  • Total Expenses = Sum of Operating and Non-Operating Expenses (Marketing and Selling Expenses + General and administrative expenses + Loss from joint Venture = ($ 16,792 + $ 3641 + $ 42= $ 20475)
  • EBT: Earning before taxes = Net Financial Income (Income – Expenses before Taxes). ( – $ 608)
  • Net Income = (Total Revenues and Gains) – (Total Expenses and Loses) = $ 4702

Income statement and Statement of cash flow

It is important to know that Income Statement does not convey the cash inflow and outflow for the year; The Cash Flow Statement is used for this. For example, credit sale is not recorded in the cash flow statement while cash sale is. Credit sale refers to sale for which the customer will make payment in the future while for cash sales the customer makes the payment at the time of purchase.

Conclusion

Income statement is the source to obtain valuable insights about factors responsible for company’s profitability.

Related posts on the SimTrade blog

   ▶ Bijal GANDHI Earnings per share

   ▶ Bijal GANDHI Revenue

   ▶ Bijal GANDHI Cost of goods sold

About the author

Article written in May 2021 by Bijal GANDHI (ESSEC Business School, Grande Ecole Program – Master in Management, 2019-2022).