CRSP

In this article, Nithisha CHALLA (ESSEC Business School, Grande Ecole Program – Master in Management (MiM), 2021-2024) examines the history, features, applications, and relevance of CRSP, with a special focus on why it matters to finance professionals and students.
Introduction
CRSP (Center for Research in Security Prices) is a leading financial database renowned for its comprehensive collection of security price data, returns, and market indexes. It is a trusted resource for academics, researchers, and professionals who rely on historical datasets for empirical research and strategic decision-making. With a focus on U.S. markets, CRSP has set the gold standard for securities data, supporting countless studies in finance and economics.
Mastering CRSP not only deepens a student’s understanding of financial markets but also signals to potential employers a commitment to analytical rigor and excellence in finance—a key advantage in a competitive job market.
The History of CRSP
Established in 1960 at the University of Chicago, CRSP was founded to provide accurate and comprehensive data on U.S. stock markets for academic research. Its first dataset covered securities listed on the New York Stock Exchange (NYSE), laying the foundation for rigorous empirical research in finance. Over time, CRSP expanded to include data from other exchanges, such as the American Stock Exchange (AMEX) and NASDAQ, creating an unparalleled repository of historical market information.
Logo of CRSP
![]()
Source: the company.
CRSP’s pioneering methodologies in data collection and standardization have significantly contributed to advancements in financial theory and practice. Its datasets have been integral to groundbreaking studies, including those that led to Nobel Prizes in Economics like Eugene Fama.
Key Features
Certain key features of CRSP make it very useful as a database such as its Comprehensive Market Data, High-Quality Data, Unique Identifiers, Event Studies and Analytics, and Customizable Datasets.
As an example, the picture below presents the CRSP website Interface.
CRSP website Interface
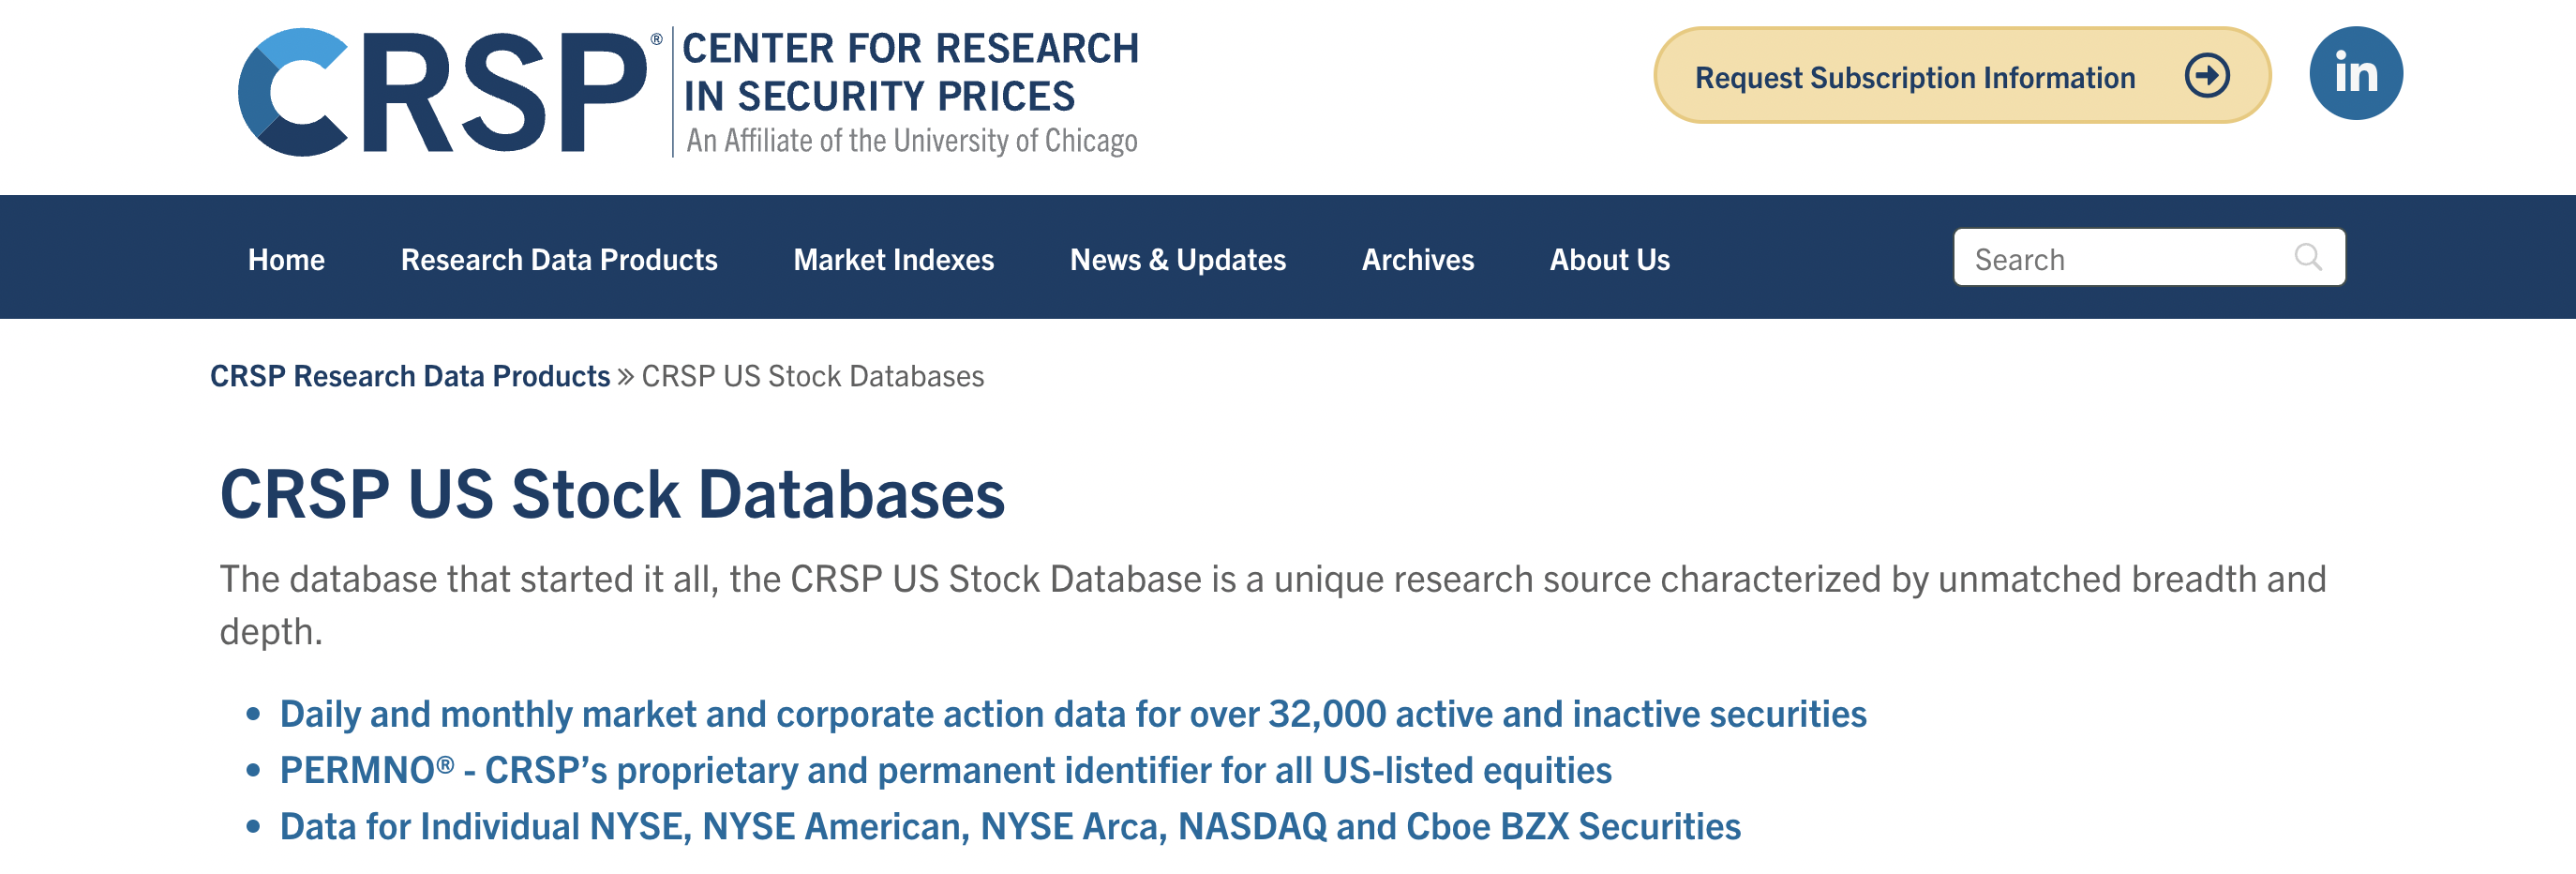
Source: the company.
Comprehensive Market Data
In the domain of finance, where historical accuracy and data consistency are critical, the Center for Research in Security Prices (CRSP) database has established itself as an invaluable resource. Maintained by the University of Chicago Booth School of Business, CRSP provides high-quality financial and market data, widely recognized for its rigor and reliability.
CRSP provides historical data on stock prices, returns, and dividends dating back to 1926. It includes data on U.S. equity, fixed-income securities, mutual funds, and market indexes.
High-Quality Data
Known for its accuracy and reliability, CRSP meticulously cleans and standardizes data for research-grade quality.
Unique Identifiers
Employs permanent and unique identifiers for securities, ensuring seamless tracking across corporate events such as mergers or name changes.</p
Event Studies and Analytics
CRSP supports event-based analyses, including stock splits, delistings, and corporate actions. It enables users to study the impact of specific events on stock performance.
Customizable Datasets
CRSP allows users to tailor data queries based on timeframes, security types, or specific indices.
Applications in Finance and Business
There are several applications of CRSP in finance and business such as Market Benchmarks, Strategic Planning, academic research, and Corporate Finance.
- Academic Research: CRSP is the backbone of empirical finance, aiding studies on asset pricing, portfolio theory, and market efficiency.
- Investment Strategies: Asset managers and analysts use CRSP data to backtest trading strategies, analyze market trends, and optimize portfolios.
- Market Benchmarks: CRSP provides widely used benchmarks like the CRSP Indexes, which are integral to understanding market dynamics.
- Corporate Finance: Researchers and professionals leverage CRSP for analyses on mergers, acquisitions, and the impact of financial policies.
Advantages and Limitations of CRSP
Though there are multiple advantages of using this database there are also certain limitations that we have to consider:
Advantages of CRSP
- Historical Depth: CRSP’s long-term datasets enable robust time-series analyses and longitudinal studies.
- Reliability: Trusted by academics and practitioners for its meticulous approach to data accuracy.
- Comprehensive Coverage: Includes data on a broad range of financial instruments and corporate actions.
Challenges and Limitations
- Cost: Access to CRSP is subscription-based and can be expensive for individual users or smaller institutions.
- U.S.-Centric Focus: While exhaustive for U.S. markets, it offers limited data on international securities.
- Technical Complexity: Requires expertise to navigate and analyze its extensive datasets effectively.
Why CRSP Matters in 2024
In 2024, as financial markets grow increasingly complex, CRSP’s role as a reliable data source is more critical than ever. The database supports cutting-edge research on topics such as algorithmic trading, behavioral finance, and the impact of ESG factors on market performance. With its legacy of contributing to financial innovation, CRSP remains a vital resource for understanding and navigating modern markets.
Conclusion
CRSP stands as a testament to the power of high-quality data in shaping financial research and practice. Its depth, precision, and historical scope make it indispensable for academics, researchers, and industry professionals. As markets evolve, CRSP continues to provide the tools and insights needed to analyze trends, test hypotheses, and drive informed decisions.
Why should I be interested in this post?
For finance students, CRSP is more than a database—it’s an educational gateway to understanding market behavior, testing financial theories, and developing data-driven insights. Familiarity with CRSP equips students with the skills to conduct empirical research and enhances their readiness for roles in asset management, investment banking, and academia.
Related posts on the SimTrade blog
▶ Nithisha CHALLA Datastream
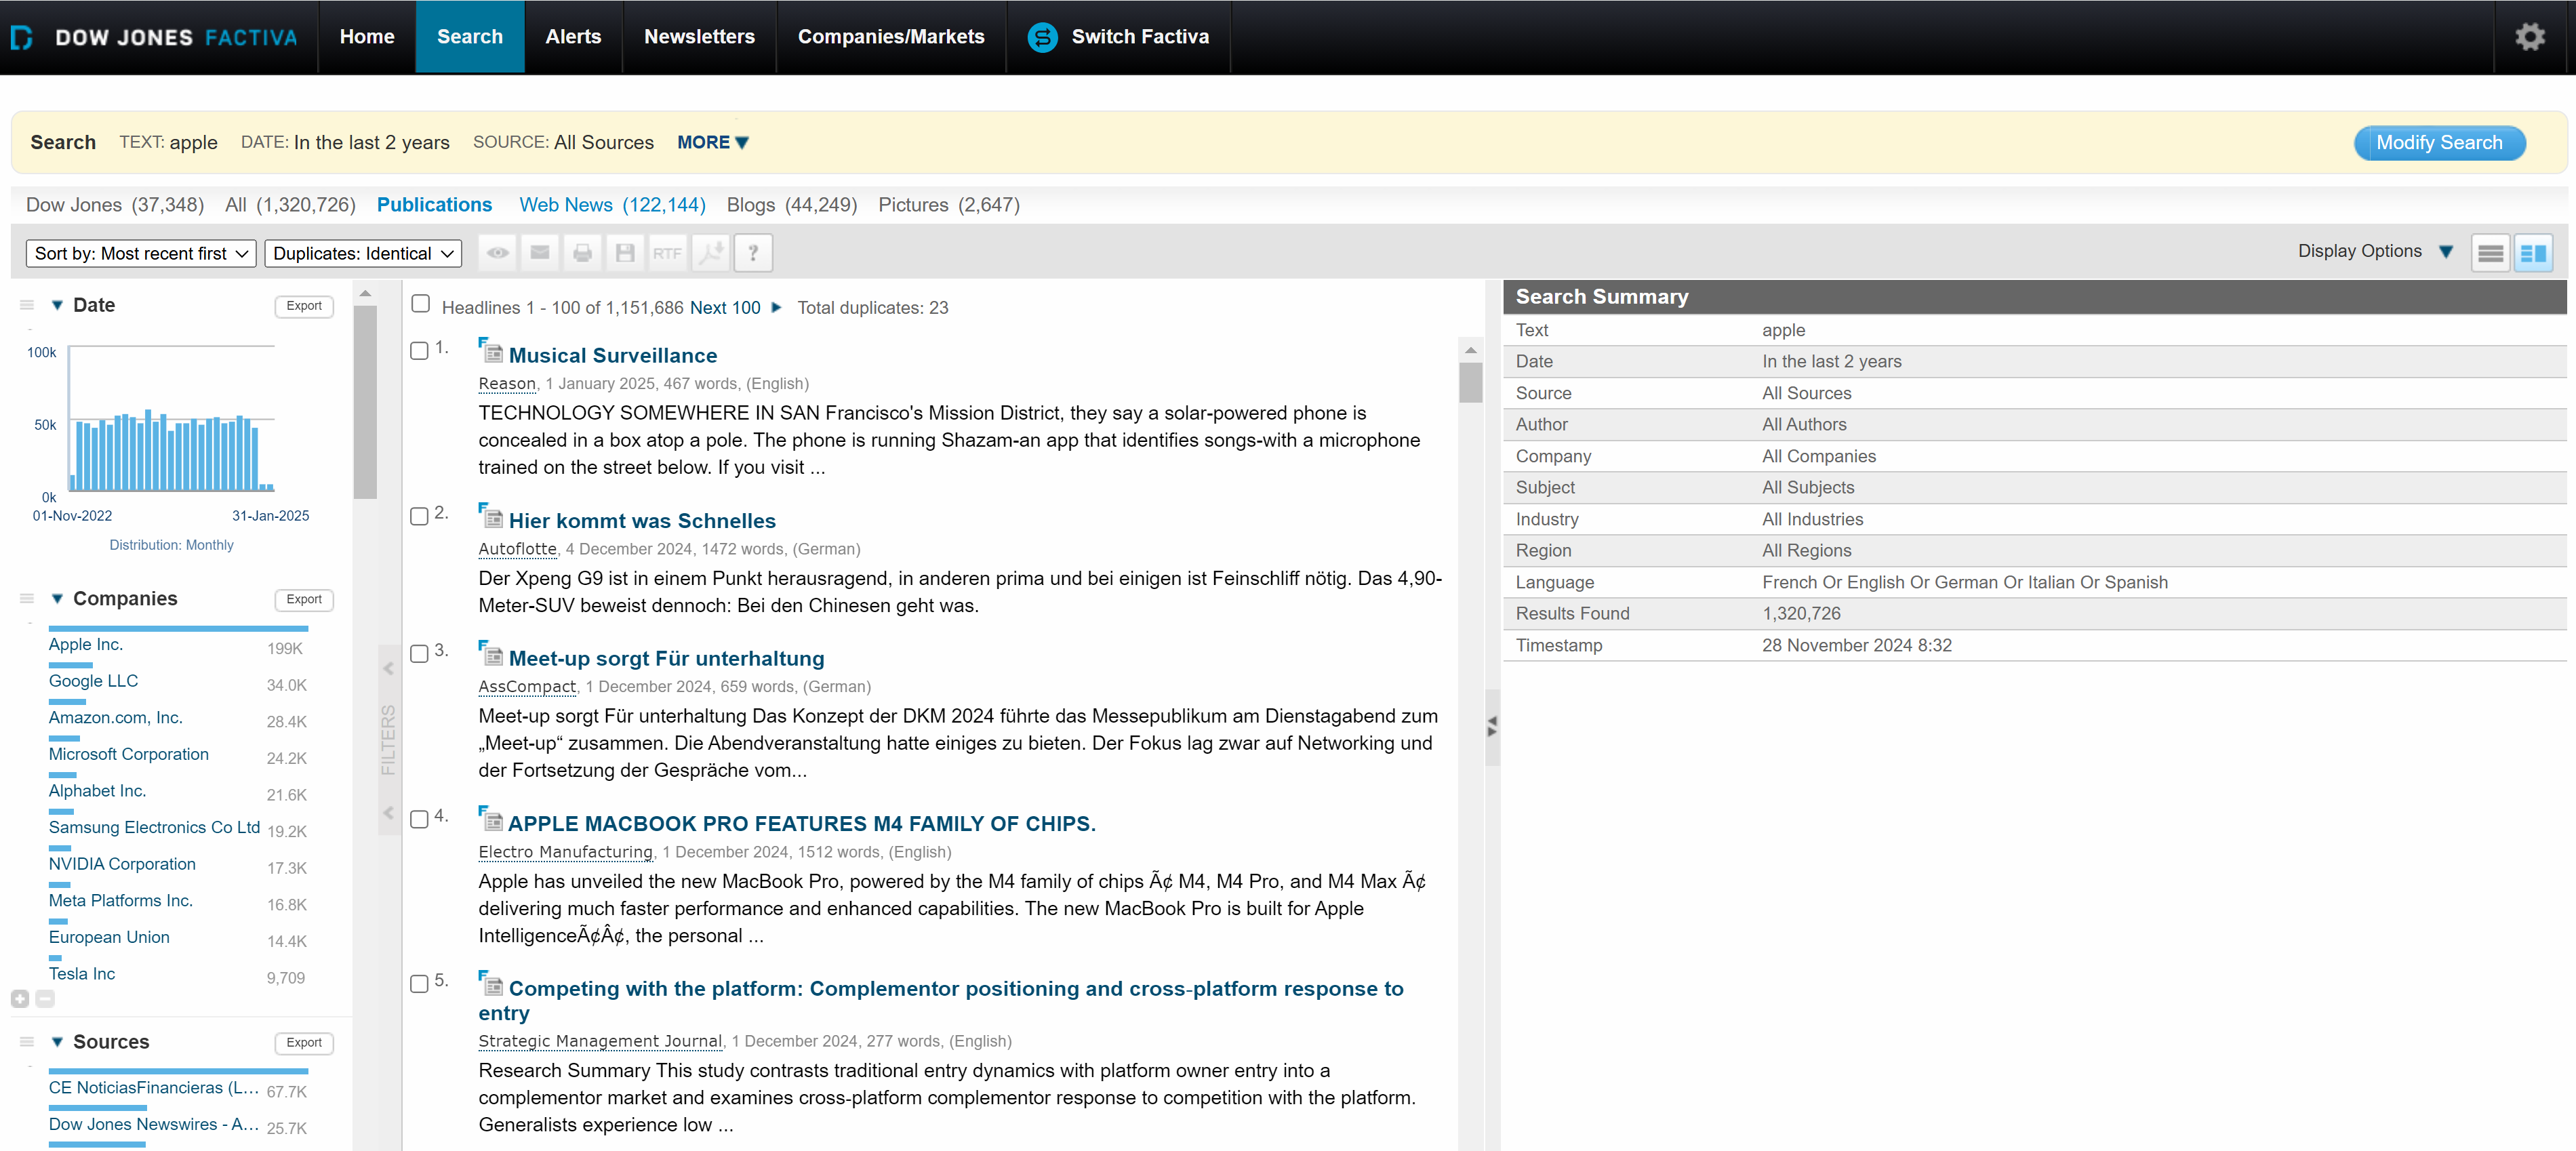
▶ Nithisha CHALLA Factiva
▶ Nithisha CHALLA Compustat
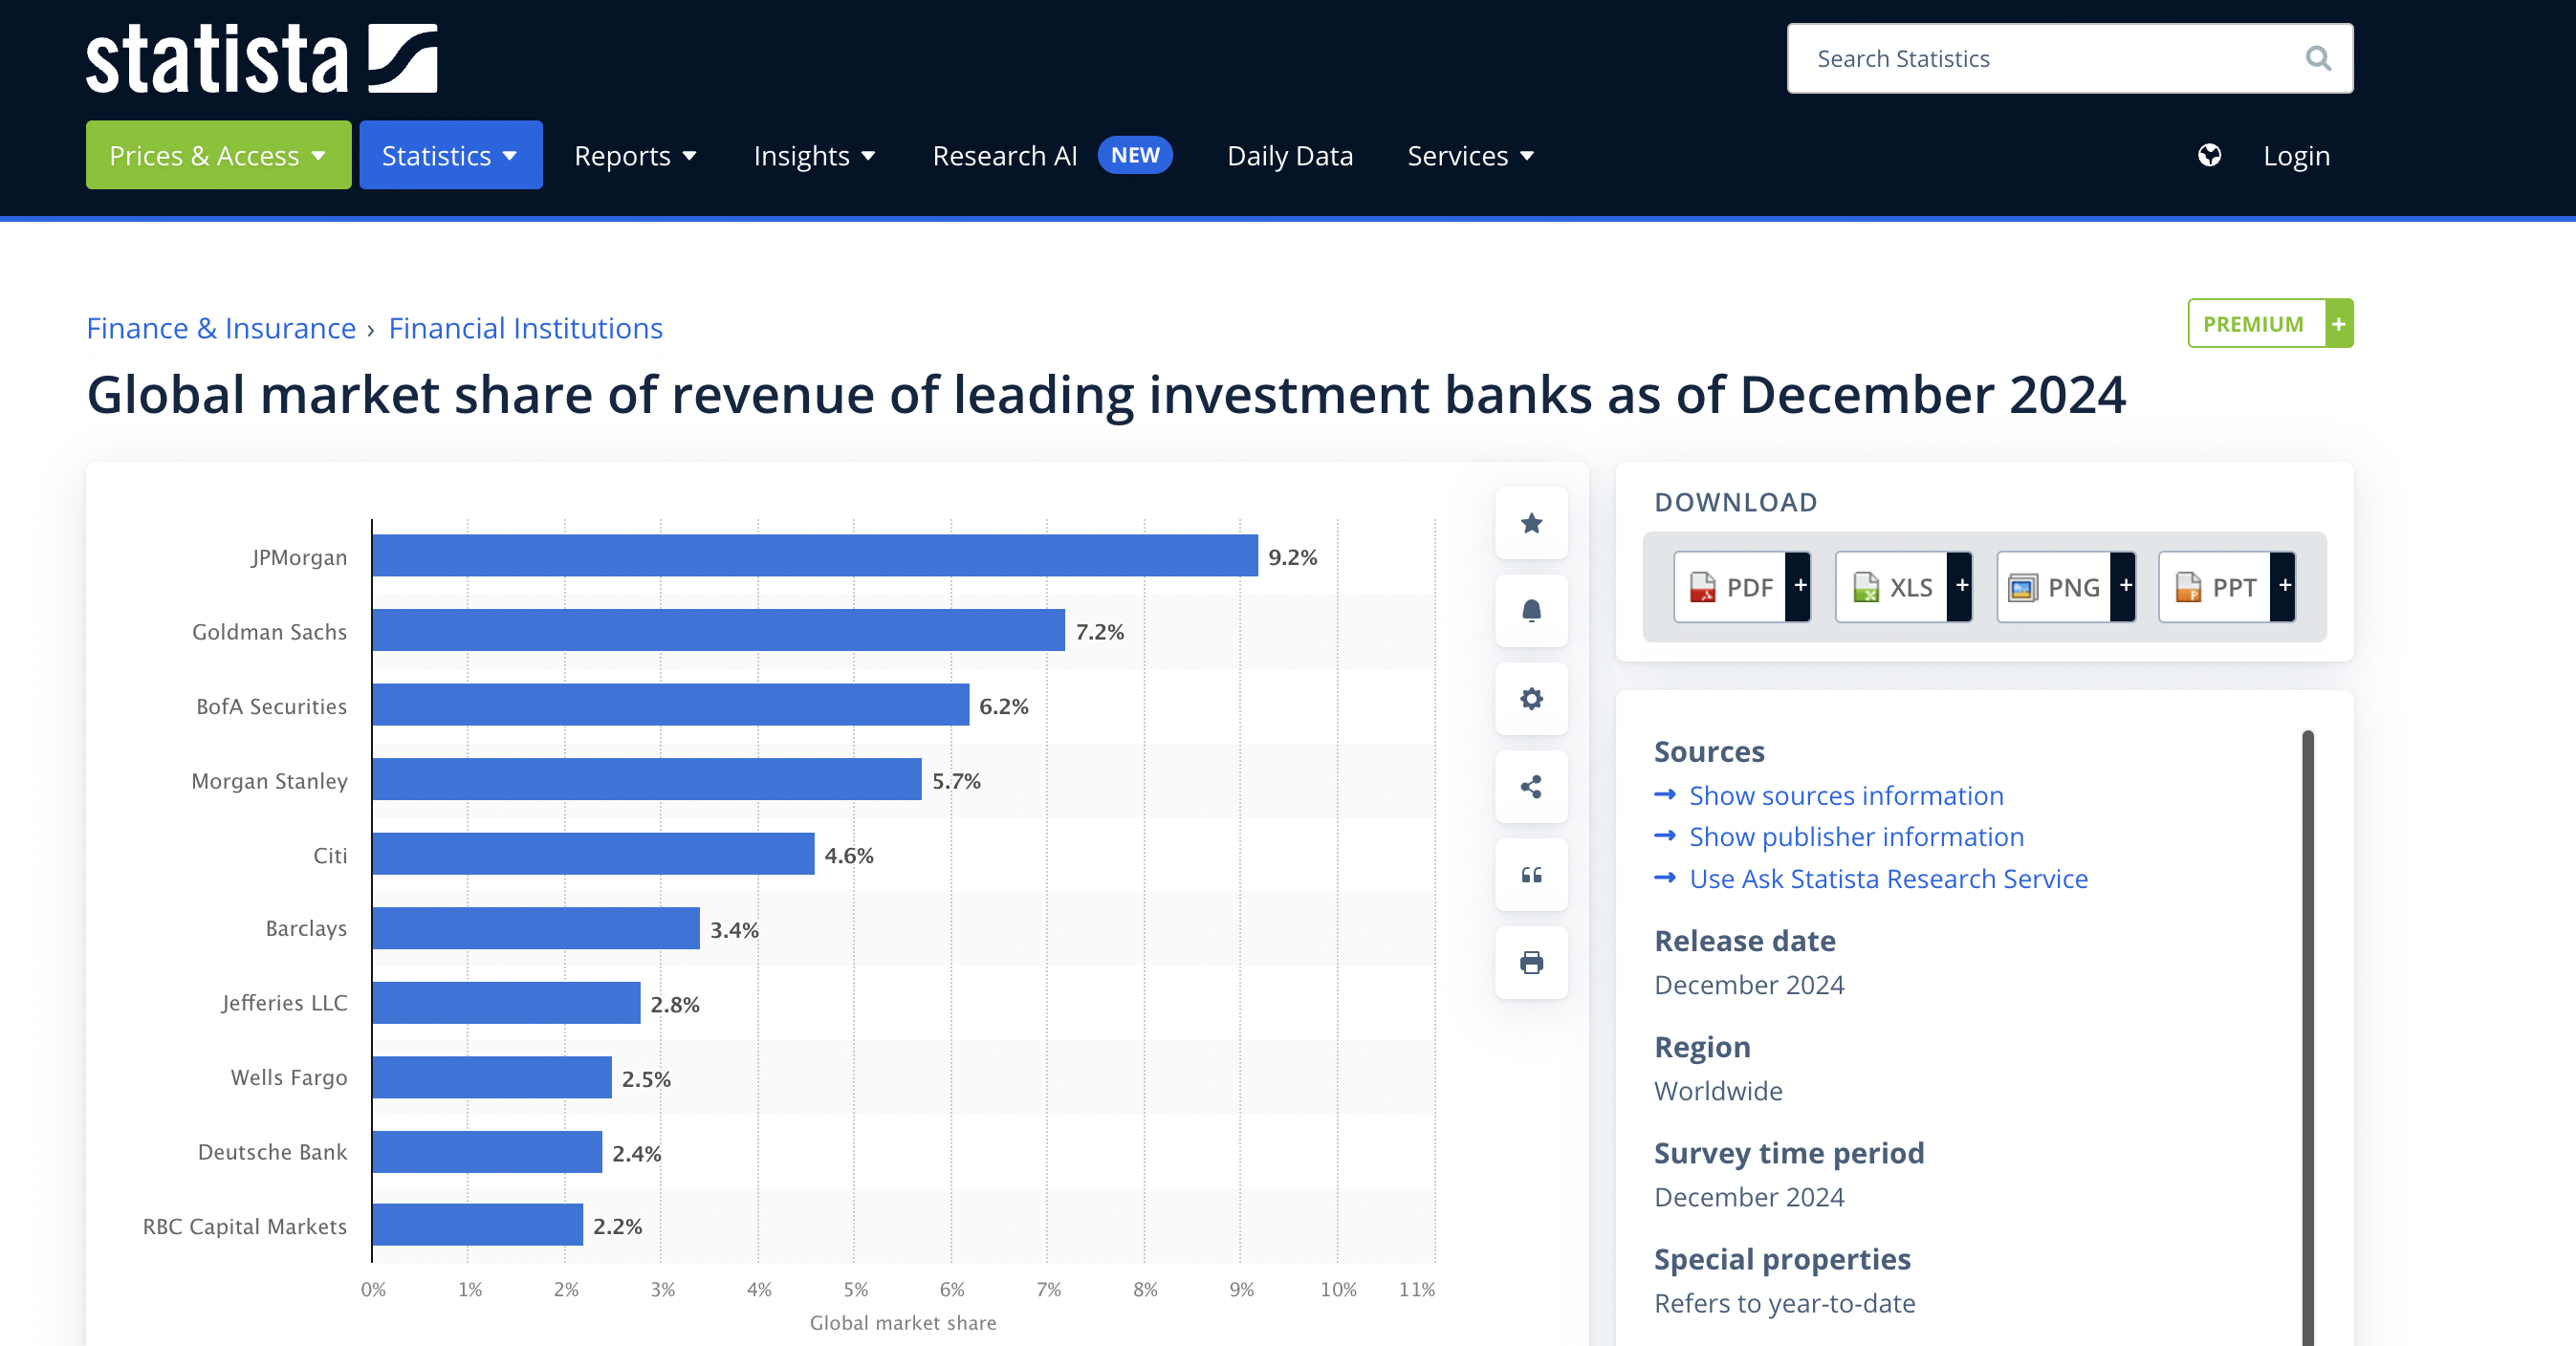
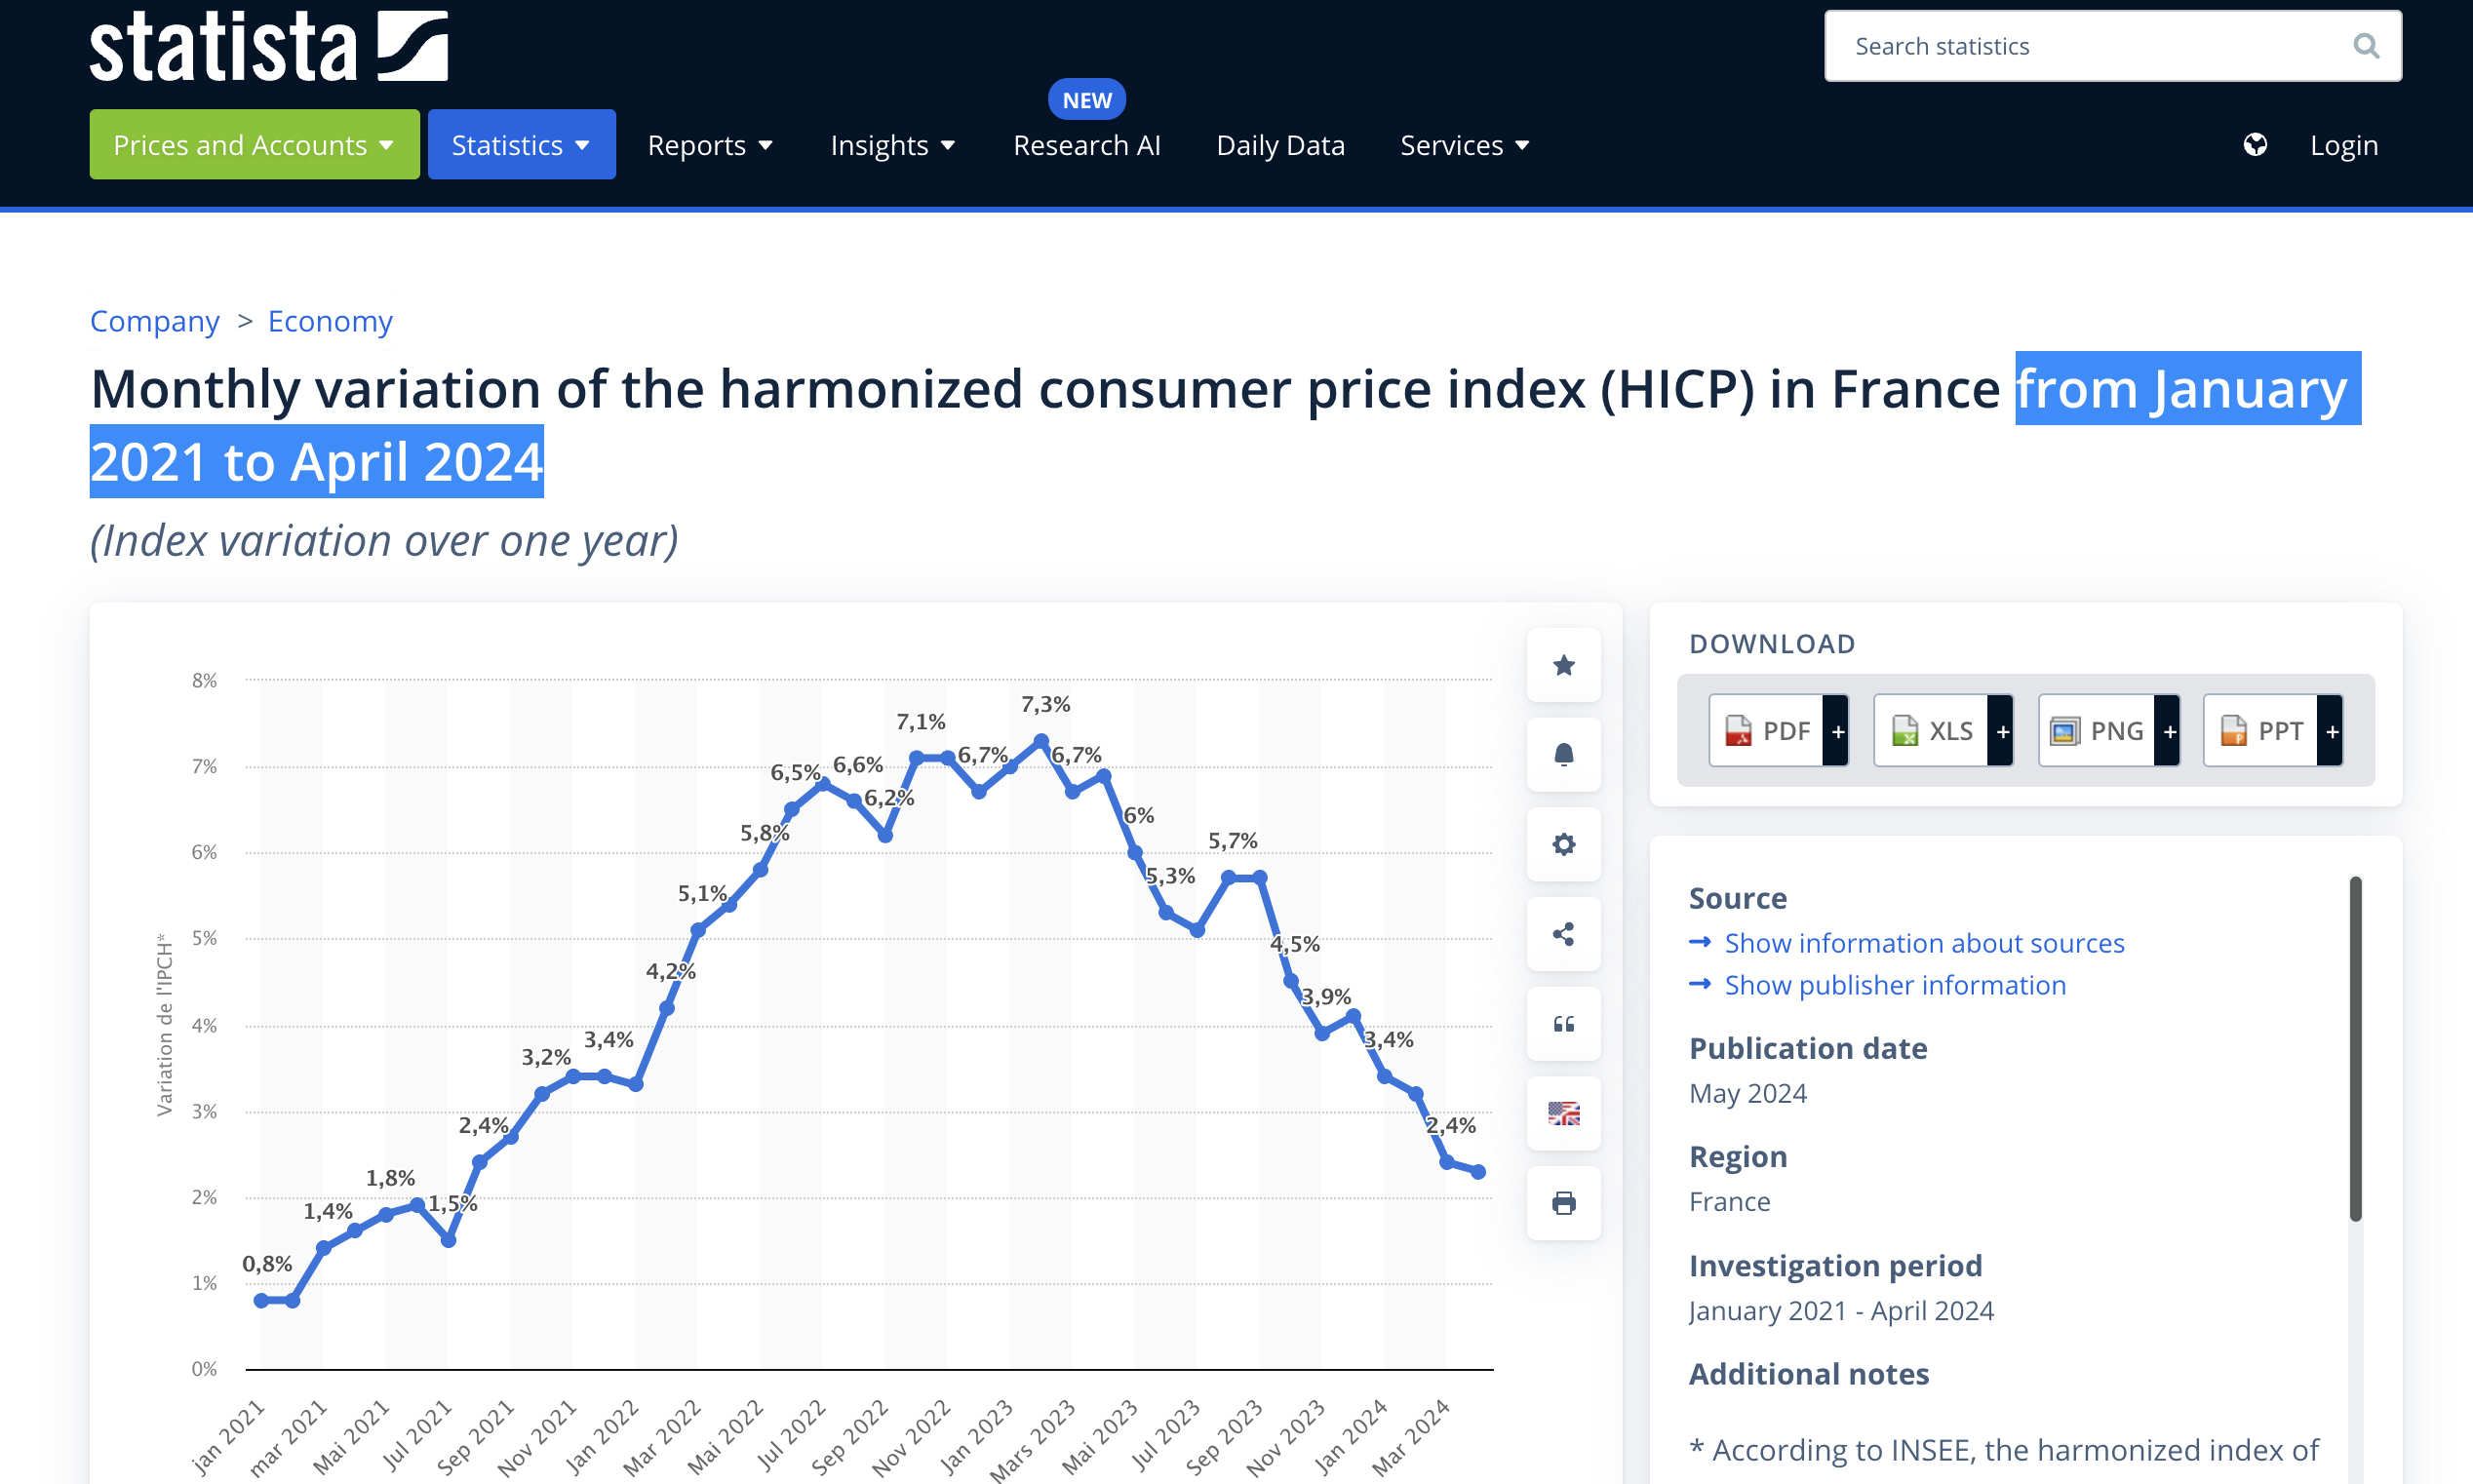
▶ Nithisha CHALLA Statista
Useful resources
CRSP CRSP research data products
Wikipedia Center for Research in Security Prices
About the author
The article was written in December 2024 by Nithisha CHALLA (ESSEC Business School, Grande Ecole Program – Master in Management (MiM), 2021-2024).