Top 5 companies in the technology sector

Top 5 companies in the technology sector

Nithisha CHALLA

In this article, Nithisha CHALLA (ESSEC Business School, Grande Ecole Program – Master in Management (MiM), 2021-2024) delves into the top five companies in the technology sector by market capitalization. For each tech company, I provide information into their origins, latest announcements, and notable developments to provide financial professionals and students with actionable insights.

Introduction

The top tech companies are not only industry innovators but also major drivers of global financial markets. Their influence extends from stock market trends to shaping global investment strategies. Their products and services help other companies to improve their productivity. These companies, Apple, Nvidia, Microsoft, Amazon, and Alphabet, dominate global market capitalizations through their relentless focus on advanced technologies like artificial intelligence (AI), cloud computing, and digital services. We examine below the top five tech firms by market capitalization, delving deeper into their financial performance, innovation strategies, and implications for finance professionals.

The picture below shows the world’s 50 valuable companies by market capitalization (Companies Market Cap, August 2024). We can observe that the top 5 companies are related to the technology industry.

World’s top 50 valuable companies by market capitalization
Source: Companies Market Cap.

The market capitalization, commonly called a “market cap”, is the total market value of a publicly traded company’s outstanding shares and is widely used to measure how much a company is worth. In most cases, it can be easily calculated by multiplying the share price with the amount of outstanding shares.

Apple

Apple Inc was founded in 1976 by Steve Jobs, Steve Wozniak, and Ronald Wayne in Cupertino, California. Known for its consumer electronics like the iPhone, Mac, and Apple Watch, Apple also thrives in services such as the App Store and Apple Music, contributing to over 20% of its revenue. Apple consistently generates substantial revenue from its ecosystem of devices and services. In fiscal 2024, its services division alone brought in over $70 billion, reflecting a 25.17% change in the market capitalization growth from the previous year.

Logo of Apple Inc.
 Logo of Apple Inc tech company
Source: the company.

As of December 2024 Apple has a market cap of $3.748 Trillion USD. This makes Apple the world’s most valuable tech company by market cap according to “companies market cap” company data.

The picture below shows the market capitalization history of Apple from 1996 to 2024.

Market cap history of Apple from 1996 to 2024
Source: Companies Market Cap.

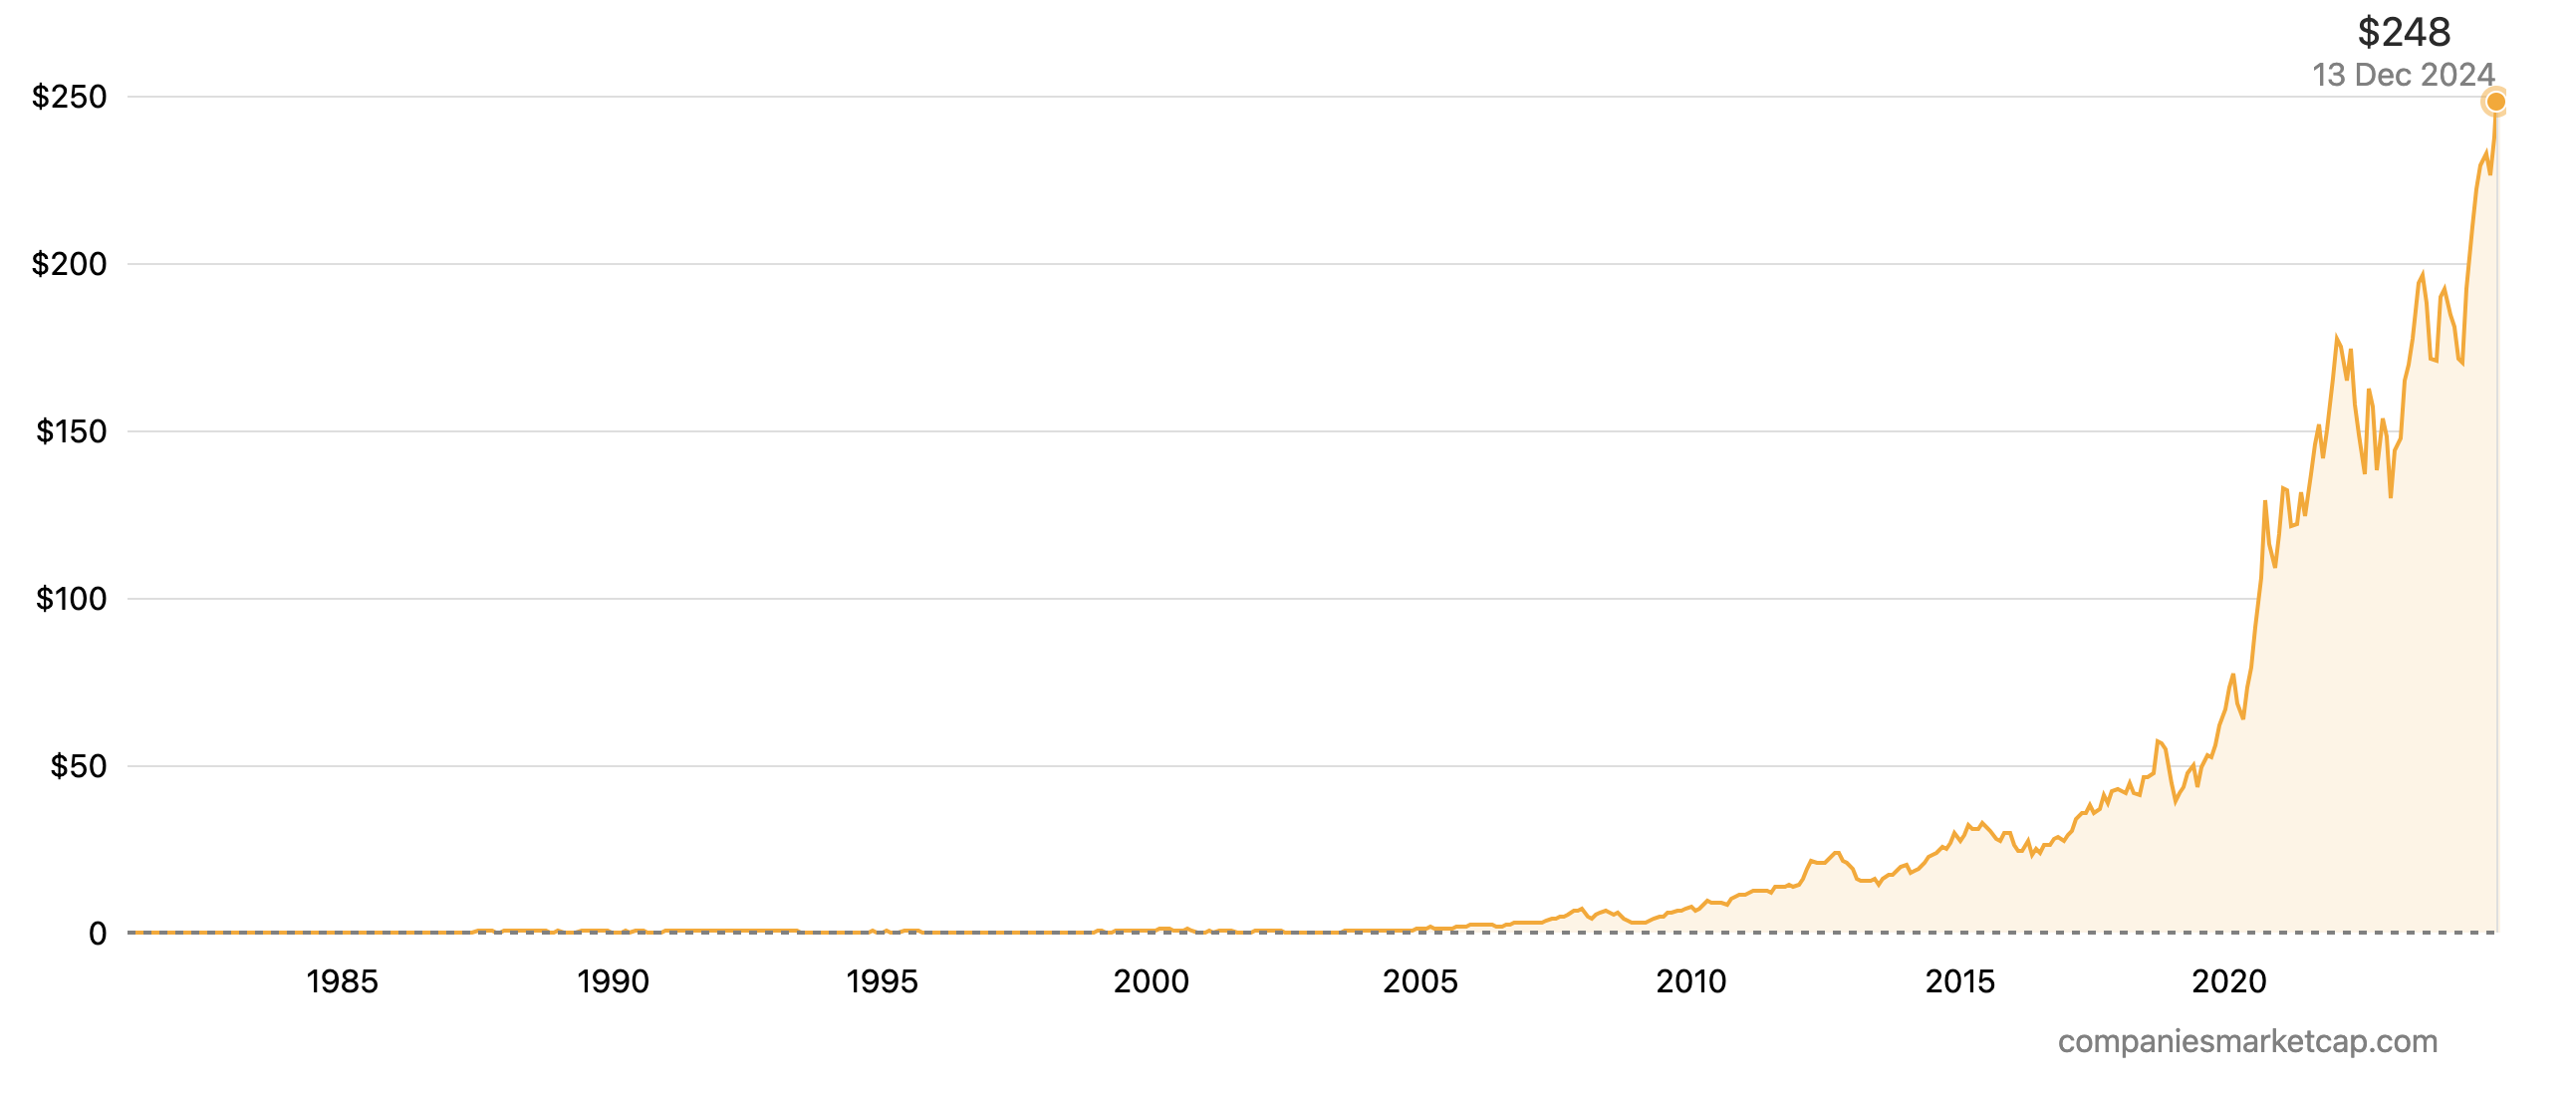
The picture below shows the stock price history of Apple from 1980 to 2024.

Stock price history of Apple from 1980 to 2024
Source: Companies Market Cap.

The company’s stock remains a popular choice for institutional investors due to its consistent performance and market leadership. Apple has steadily increased its dividend and share buybacks, returning over $100 billion to shareholders annually in recent years. Despite declining iPhone sales, Apple’s diversification into wearables and services helped sustain strong financials. It also topped the list of the world’s most valuable global brands in 2023 with a brand value of $880 billion (Business 2 community, 2024).

Initially focused on personal computers, Apple has evolved into a consumer electronics powerhouse. In recent years, its technological innovations, including the Vision Pro mixed-reality headset announced in 2023, underscore its push into augmented and virtual reality spaces. Its expansion into India has been a game-changer, with manufacturing operations set to reduce costs and increase market penetration in one of the fastest-growing smartphone markets.

Initially focused on personal computers, Apple has evolved into a consumer electronics powerhouse. In recent years, its technological innovations, including the Vision Pro mixed-reality headset announced in 2023, underscore its push into augmented and virtual reality spaces. Its expansion into India has been a game-changer, with manufacturing operations set to reduce costs and increase market penetration in one of the fastest-growing smartphone markets.

Nvidia

Founded in 1993, Nvidia Corporation is a leader in Graphics Processing Unit (GPU) development, powering the AI revolution. Its AI hardware is critical for training large language models (LLMs), cementing its role in both consumer gaming and enterprise-level AI solutions. In fiscal 2024, its services division alone brought in over $1.8 trillion, reflecting a 178.92% change in the market capitalization growth from the previous year.

Logo of Nvidia
Logo of Nvidia tech company
Source: the company.

As of December 2024, Nvidia has a market cap of $3.411 Trillion USD. This makes Nvidia the world’s 2nd most valuable tech company by market cap according to “companies market cap” company data. The market capitalization, commonly called market cap, is the total market value of a publicly traded company’s outstanding shares and is widely used to measure how much a company is worth.

The picture below shows the market capitalization history of Nvidia from 1999 to 2024.

Market cap history of Nvidia from 1999 to 2024
Source: Companies Market Cap.

The picture below shows the Stock price history of Nvidia from 1999 to 2024.

Stock price history of Nvidia from 1999 to 2024
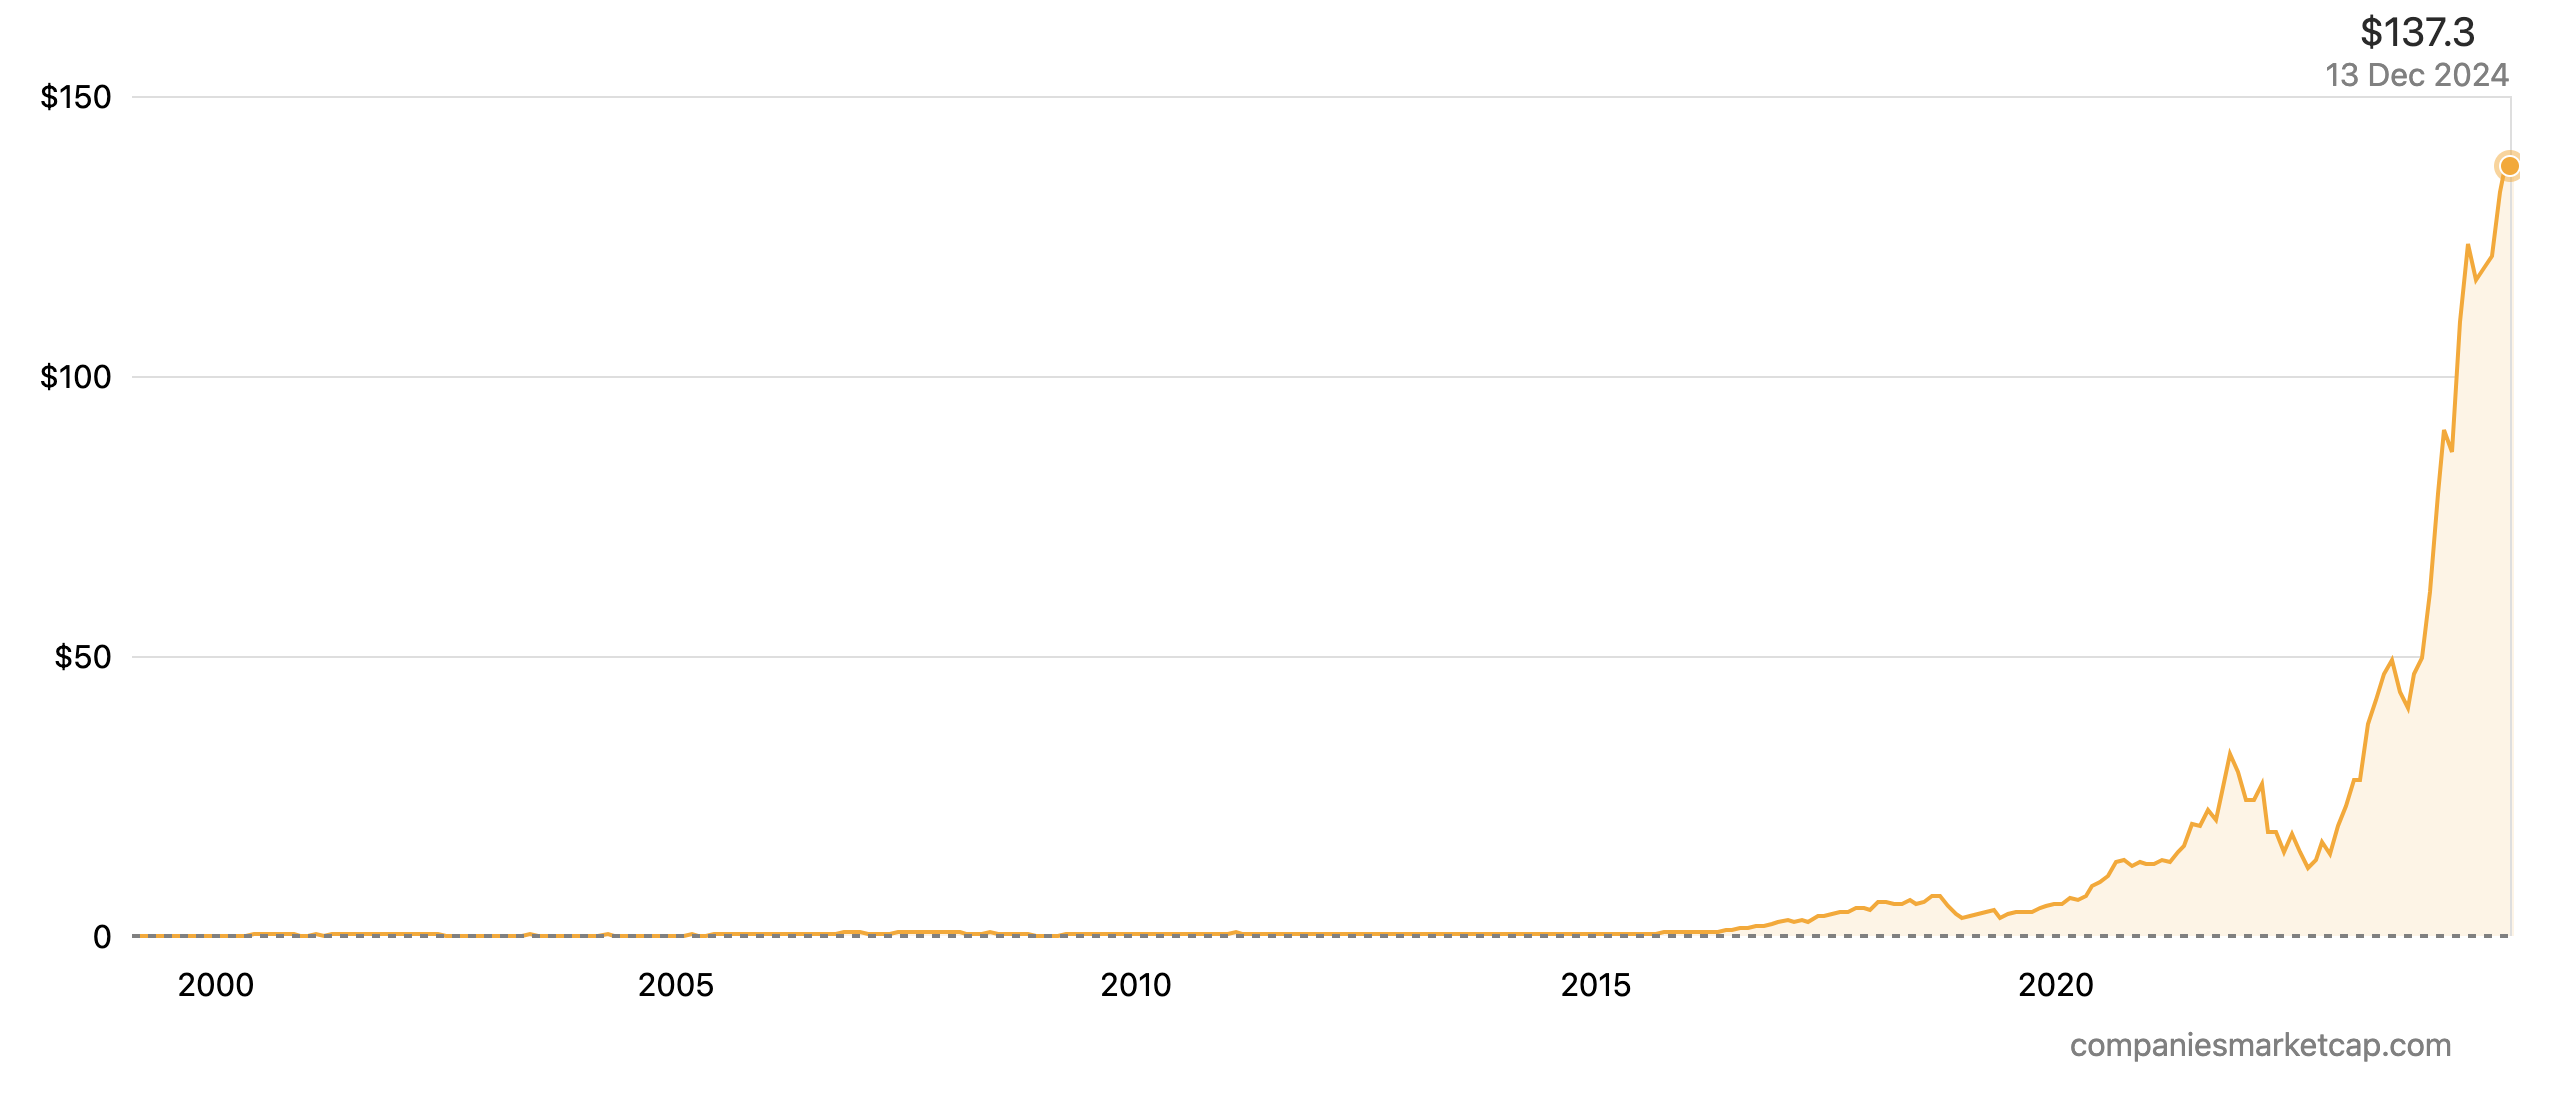
Stock price history of NVIDIA from 1999 to 2024
Source: Companies Market Cap.

Nvidia dominates the GPU market, controlling over 85% of the discrete GPU space globally. It boasts a gross margin of approximately 65%, one of the highest in the semiconductor industry. According to the Business 2 community, Nvidia’s revenue surged, particularly in its data center segment, which accounted for $15 billion in 2023. Its AI chipsets have become a cornerstone for AI development across industries, leading to increased investor confidence.

Nvidia is integral to AI, as its GPUs are critical for training large language models (LLMs) and generative AI tools. This has led to surging demand for its A100 and H100 chips. Nvidia announced collaborations with Tesla and other automakers for AI-driven autonomous driving technologies.

The company continues to expand its AI reach through strategic investments in startups and partnerships with cloud providers like Amazon Web Services (AWS). Its Omniverse platform is being adopted for digital twins, a technology with applications in industrial design and smart cities.

Microsoft

Established in 1975 by Bill Gates and Paul Allen, Microsoft Corporation has been at the forefront of software development. Its strategic investment in OpenAI and integration of generative AI into its Office suite and Azure cloud services have significantly bolstered its growth. Investors and students can learn from Microsoft’s ability to adapt its business model over decades, sustaining growth in both legacy and emerging markets. In fiscal 2024, its services division alone brought in over $70 billion, reflecting a 19.59% change in the market capitalization growth from the previous year.

Logo of Microsoft Corporation
 Logo of Microsoft Corporation tech company
Source: the company.

As of December 2024 Microsoft has a market cap of $3.342 Trillion USD. This makes Microsoft the world’s 3rd most valuable tech company by market cap according to “companies market cap” company data. The market capitalization, commonly called market cap, is the total market value of a publicly traded company’s outstanding shares and is widely used to measure how much a company is worth.

The picture below shows the market capitalization history of Microsoft from 1996 to 2024.

Market cap history of Microsoft from 1996 to 2024
Source: Companies Market Cap.

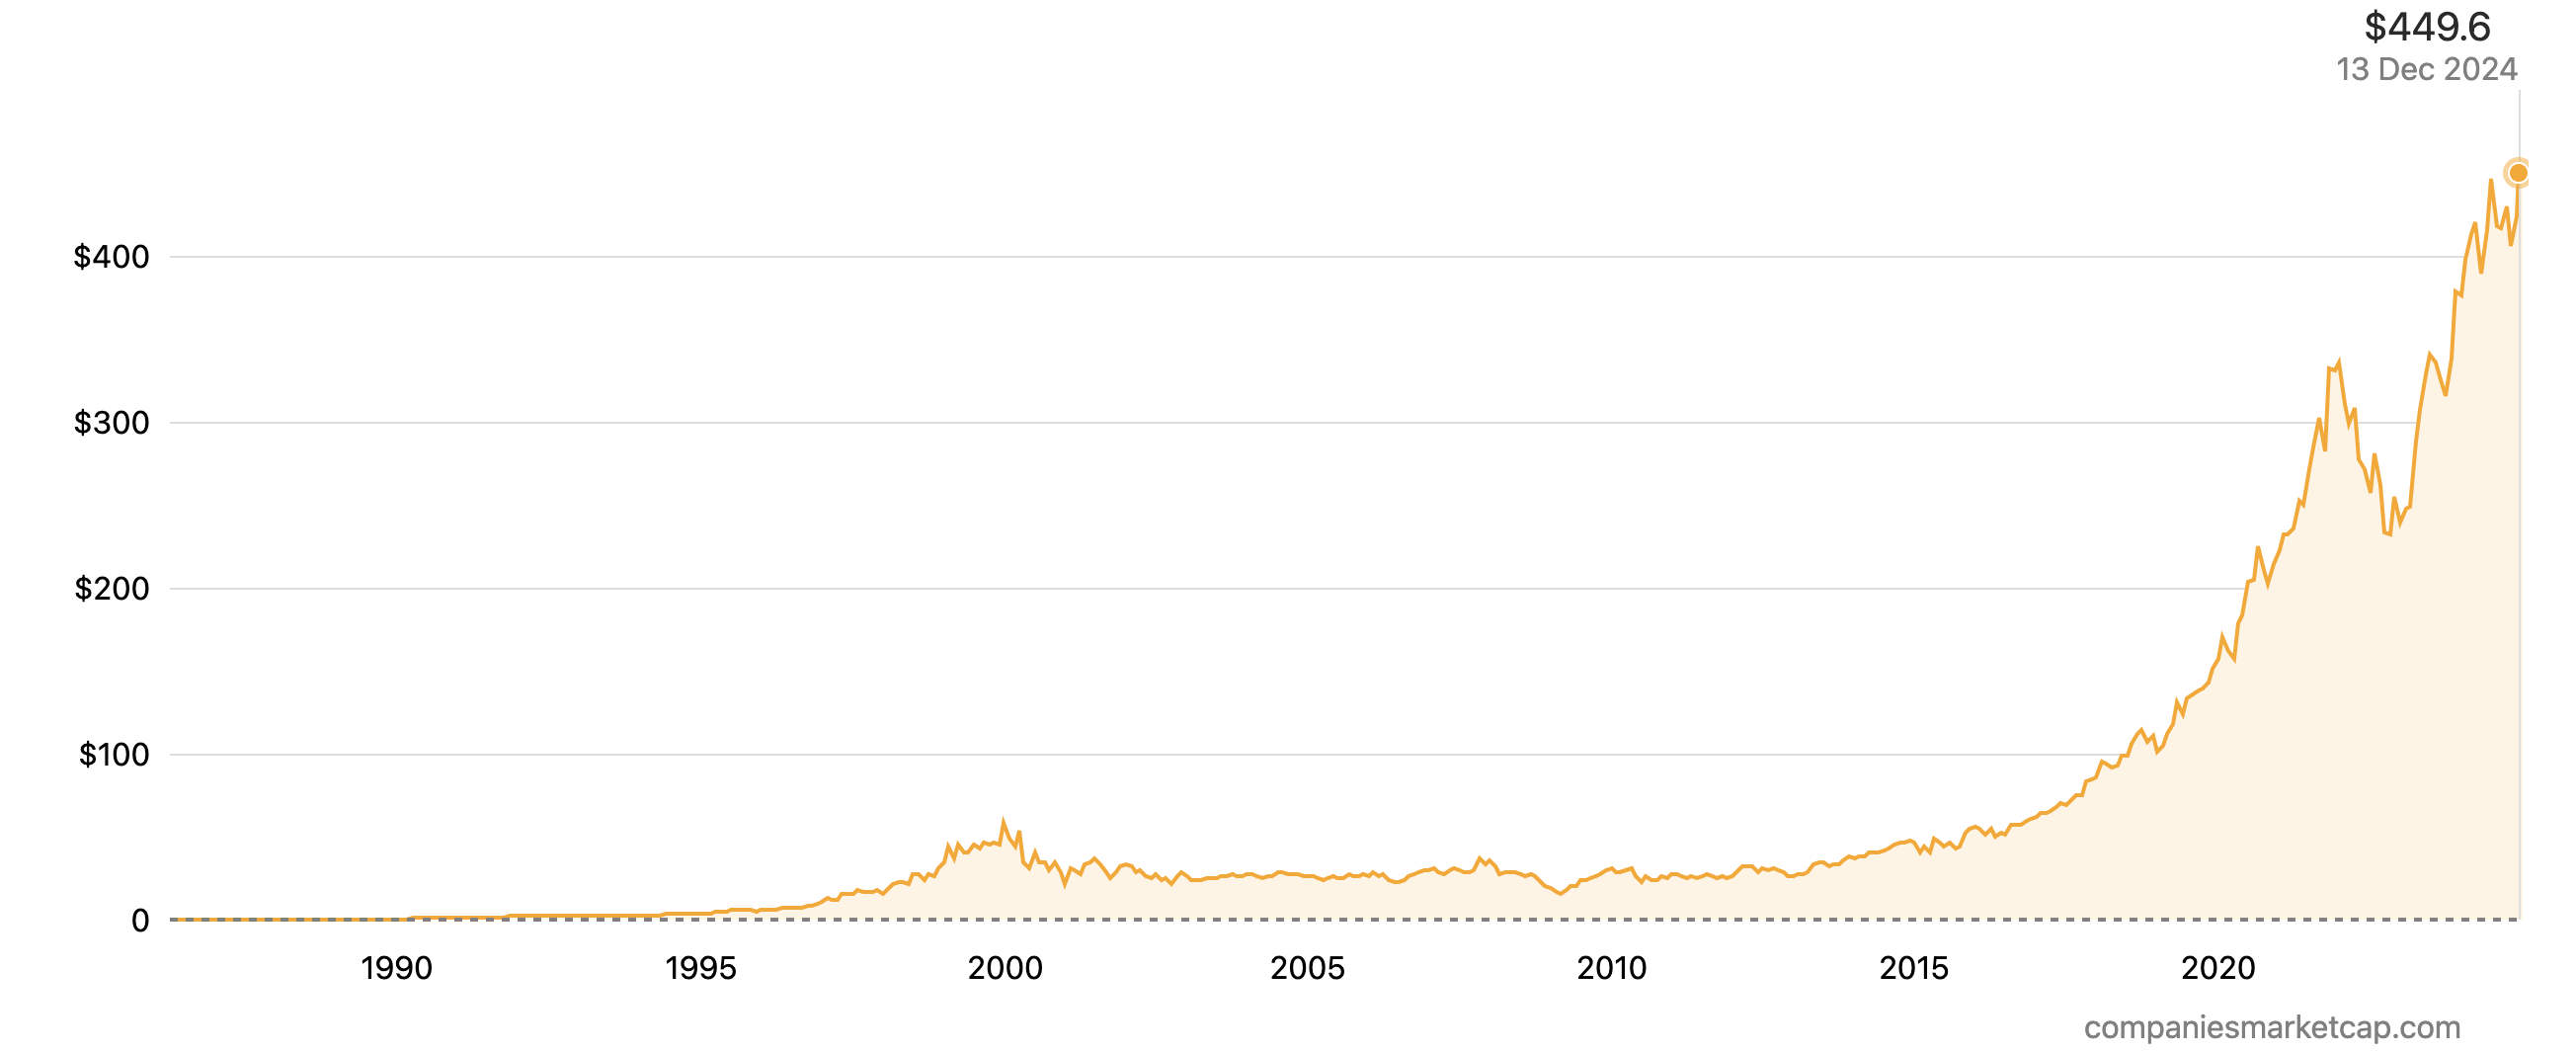
The picture below shows the stock price history of Microsoft from 1986 to 2024.

Stock price history of Microsoft from 1986 to 2024
Source: Companies Market Cap.

Microsoft has surpassed a $3 trillion market cap for the first time in January 2024. It has made a significant investment in quantum computing with the development of its Azure Quantum platform.

Microsoft’s Copilot AI has been integrated across its Office Suite, including Word, Excel, and PowerPoint, revolutionizing productivity software. Recent news in June 2024 states that it has strengthened its partnership with OpenAI to bring advanced AI tools to Azure, making enterprise AI more accessible globally.

Amazon

Amazon Inc, founded in 1994 by Jeff Bezos, revolutionized e-commerce before expanding into cloud computing and entertainment. Amazon Web Services (AWS) remains a dominant player in the cloud sector, while its AI capabilities support logistics, retail, and media content. In fiscal 2024, its services division alone brought in over $85 billion, reflecting a 54.2% change in the market capitalization growth from the previous year.

Logo of Amazon
Logo of Amazon tech company
Source: the company.

As of December 2024 Amazon has a market cap of $2.421 Trillion USD. This makes Amazon the world’s 4th most valuable tech company by market cap according to “companies market cap” company data.

The picture below shows the market capitalization history of Amazon from 1997 to 2024.

Market cap history of Amazon from 1997 to 2024
Source: Companies Market Cap.

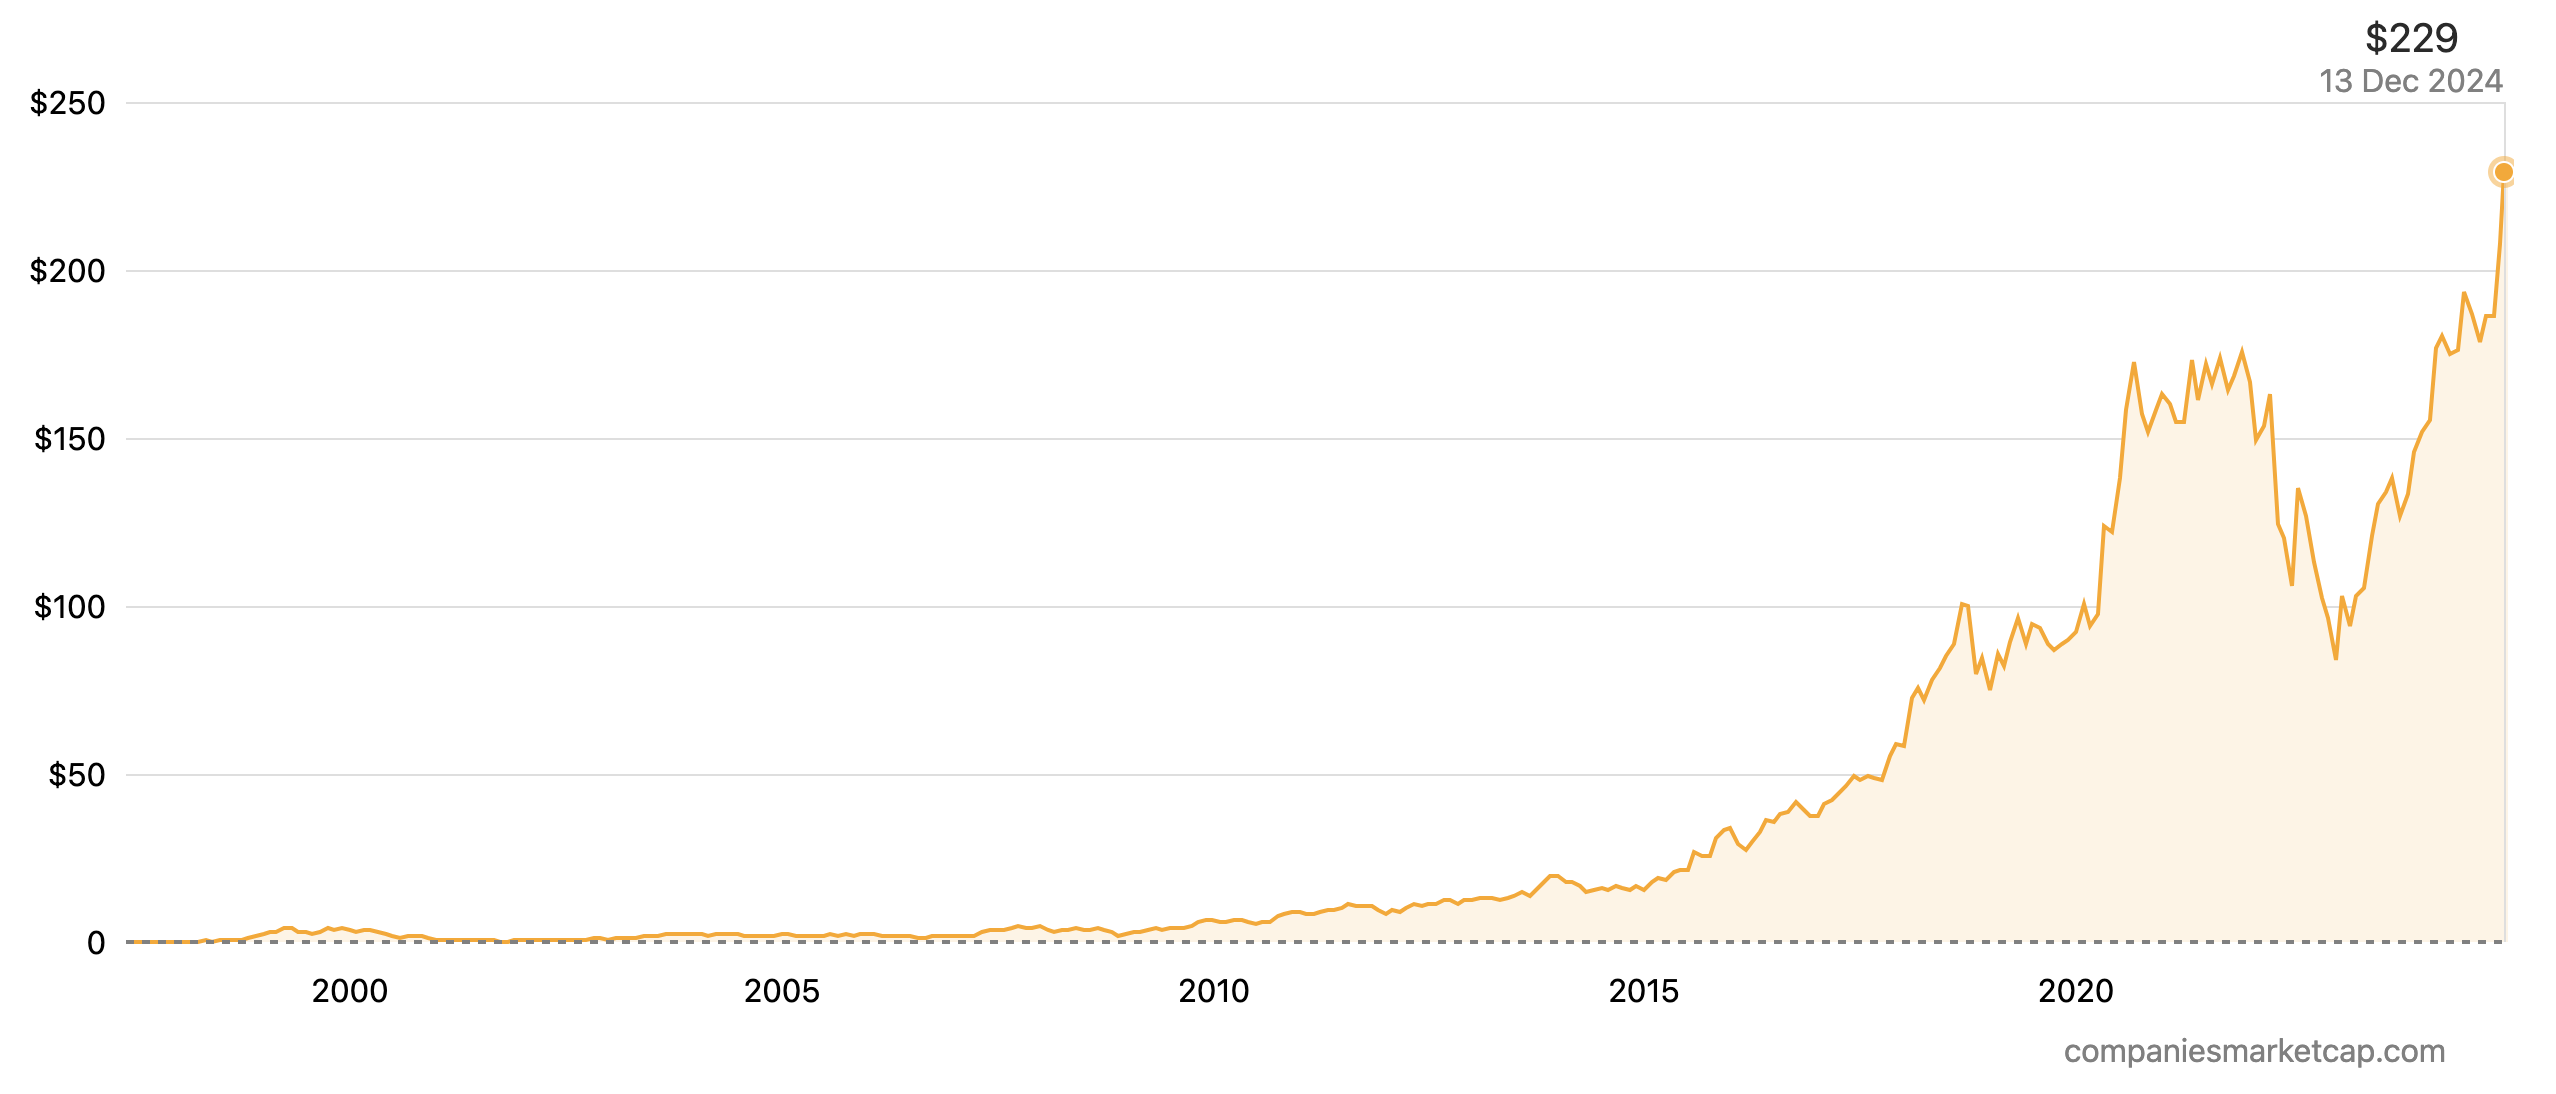
The picture below shows the Stock price history of Amazon from 1997 to 2024.

Stock price history of Amazon from 1997 to 2024
Source: Companies Market Cap.

Amazon’s Bedrock AI service has enabled enterprises to deploy customized AI models, further enhancing its AWS offerings. According to CRN, AWS held a 31% market share in the third quarter of 2024 and generated $27.5 billion in total sales during this period.

And according to CRN, Microsoft’s Intelligent Cloud business generated $24.1 billion in sales during the third quarter of 2024, up 20 percent year over year. It has also ramped up investments in drone technology, with Prime Air expanding to multiple cities for rapid deliveries. Its expansion into healthcare, with telemedicine services and pharmacy offerings, demonstrates diversification into high-growth industries.

Amazon’s continued investment in AI, including generative AI tools for its AWS customers, has strengthened its competitive edge in cloud services. Its e-commerce business has also seen growth, particularly in emerging markets contributing significantly, with innovations in logistics and Prime memberships driving customer retention.

Alphabet (Google)

Alphabet was founded in 1998 as Google by Larry Page and Sergey Brin in Menlo Park, California (later restructured as Alphabet Inc. in 2015). Google’s dominance in search and online advertising is complemented by its ventures in AI, particularly through its DeepMind subsidiary. It leverages its dominance in digital advertising while investing heavily in AI, autonomous driving (Waymo), and cloud services. Some of the companies under Alphabet are Calico, GV, Capital G, Verily, Waymo, X and Google Fiber. In fiscal 2024, its services division alone brought in over $65 billion, reflecting a 36.57% change in the market capitalization growth from the previous year.

Logo of Alphabet
Logo of Alphabet tech company
Source: the company.

As of December 2024 Alphabet (Google) has a market cap of $2.399 Trillion USD. This makes Alphabet (Google) the world’s 5th most valuable tech company by market cap according to “companies market cap” company data.

The picture below shows the market capitalization history of Alphabet from 2014 to 2024.

Market cap history of Alphabet from 2014 to 2024
Source: Companies Market Cap.

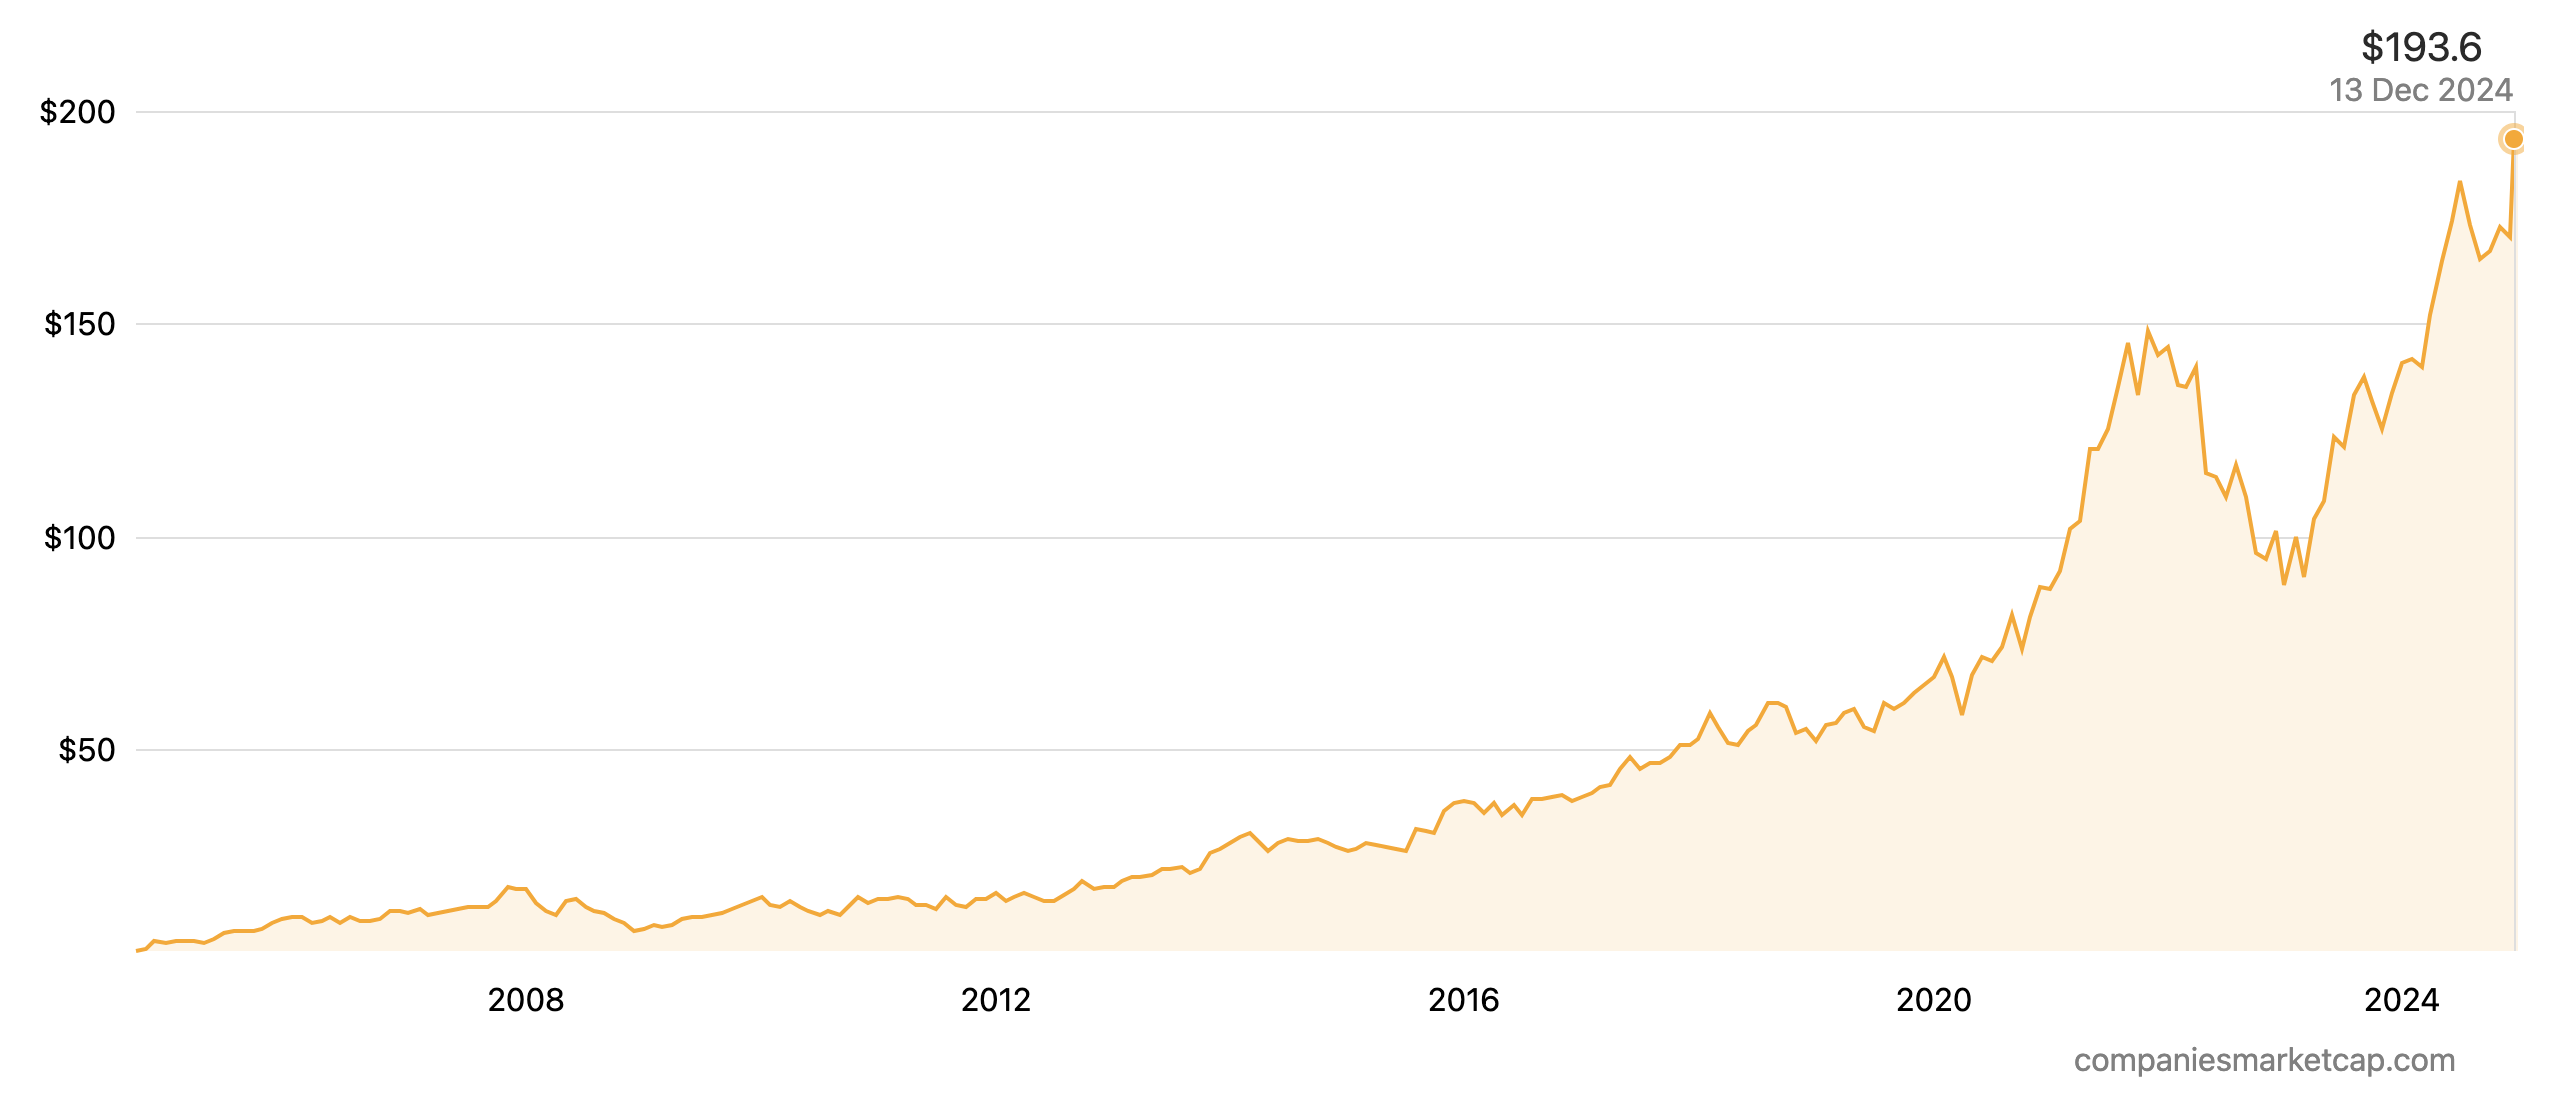
The picture below shows the stock price history of Alphabet from 2004 to 2024.

Stock price history of Alphabet from 2004 to 2024
Source: Companies Market Cap.

Nearly eight years into their journey as an AI-first company, Alphabet launched Gemini AI, a generative AI model to compete with OpenAI’s GPT, integrated into Google Workspace and search functions. Alphabet’s significant developments in Waymo, an autonomous vehicle subsidiary has an expansion of robotaxi services in major U.S. cities.

Recently Alphabet announced an ambitious plan to power all operations with 100% renewable energy by 2030. Its advertising revenues saw a resurgence in 2024 after a decline due to privacy changes in prior years.

Conclusion

The dominance of the top five technology firms Apple, Microsoft, Nvidia, Amazon, and Alphabet, is a testament to their ability to innovate, adapt, and lead in a rapidly evolving market landscape. Their influence extends beyond their respective industries, shaping global economic trends, investment strategies, and technological advancements. Their products and services help other companies to improve their productivity. Their market cap rankings serve as a barometer for the health of the tech sector and the global economy, making them essential for any professional seeking to navigate today’s financial landscape effectively.

Why should I be interested in this post?

For finance professionals, the performance and strategic moves of these tech giants offer valuable lessons in market resilience, innovation-driven growth, and capital allocation. Understanding the trajectories and current strategies of these firms helps in identifying investment opportunities and evaluating risks in the tech sector.

Related posts on the SimTrade blog

   ▶ Nithisha CHALLATop 5 companies by market capitalization in the US

   ▶ Nithisha CHALLA Market Capitalization

   ▶ Nithisha CHALLAThe NASDAQ index

Useful resources

Companies market cap Largest tech companies by market cap

Invest News Network (INN) Technology Stocks: 10 Biggest Companies in 2024

Business 2 Community Top 10 Tech Companies in the World by Market Capitalization in 2024

Computer Reseller News (CRN) Cloud Market Share For $84B Q3 2024: AWS, Microsoft, Google Cloud Lead

Visual Capitalist Ranked: The 50 Most Valuable Companies in the World in 2024

About the author

The article was written in December 2024 by Nithisha CHALLA (ESSEC Business School, Grande Ecole Program – Master in Management (MiM), 2021-2024).

Top 5 companies by market capitalization in the US

Top 5 companies by market capitalization in the US

Nithisha CHALLA

In this article, Nithisha CHALLA (ESSEC Business School, Grande Ecole Program – Master in Management, 2021-2023) presents the top 5 companies by market capitalization in the US.

Introduction to market capitalization

Market capitalization, often referred to as “market cap,” is a key metric used in the financial world to assess the size and value of a publicly traded company. Market capitalization provides insights into a company’s position in the market and its relative size compared to other companies. It is a measure of a company’s total market value, calculated by multiplying its current stock price by the total number of outstanding shares.

Market capitalization is an important indicator for investors, analysts, and market participants as it reflects the perceived worth of a company by the investing public. Note that market capitalization assesses the size of the company in the equity market, but the total value of the company measured by its assets or the sum of its liabilities and shareholders’ equity may larger if the company uses debt (financial leverage).

The top 5 corporations in the US market according to market capitalization by 2023 are as follows:

1) Apple Inc.
2) Microsoft Corporation
3) Amazon.com, Inc.
4) Alphabet Inc. (formerly Google)
5) Meta Platforms Inc. (formerly Facebook Inc.)

By looking at these top 5 companies, we observe that these companies mainly belong to the technology sector.

We detail below the characteristics of each company: statistics, analysis of revenues, and stock market data.

#1 Apple Inc.

Logo of Apple Inc.
 Logo of Apple Inc
Source: the company.

Statistics (2023)

Market capitalization: $2,514 billion
Inclusion in stock market indexes: NASDAQ-100, S&P 500
Listing on stock exchanges: NASDAQ
Industry: Technology (Consumer Electronics)
Location of headquarters: Cupertino, California, United States
Year founded: 1976
Number of employees: 164,000

Revenues

Apple is a multinational technology company that designs, manufactures, and sells consumer electronics, software, and online services. It is best known for its iconic products such as the iPhone, iPad, Mac, and Apple Watch. The company has a strong ecosystem of hardware, software, and services, including the App Store, Apple Music, iCloud, and Apple Pay. Apple has a reputation for innovation and user-friendly designs, and it has a loyal customer base worldwide.

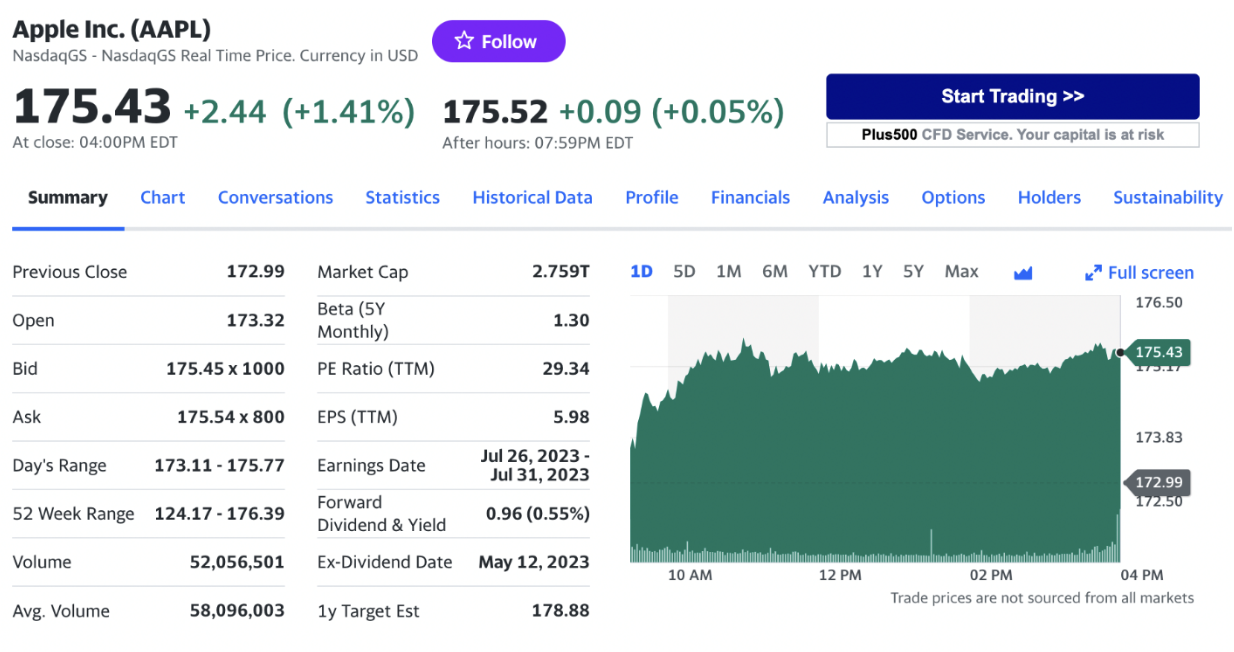
Stock chart

Stock chart for Apple Inc.
Source: Yahoo! Finance.

The historical data for Apple stock prices can be downloaded from Yahoo! Finance website: Download the data for Apple

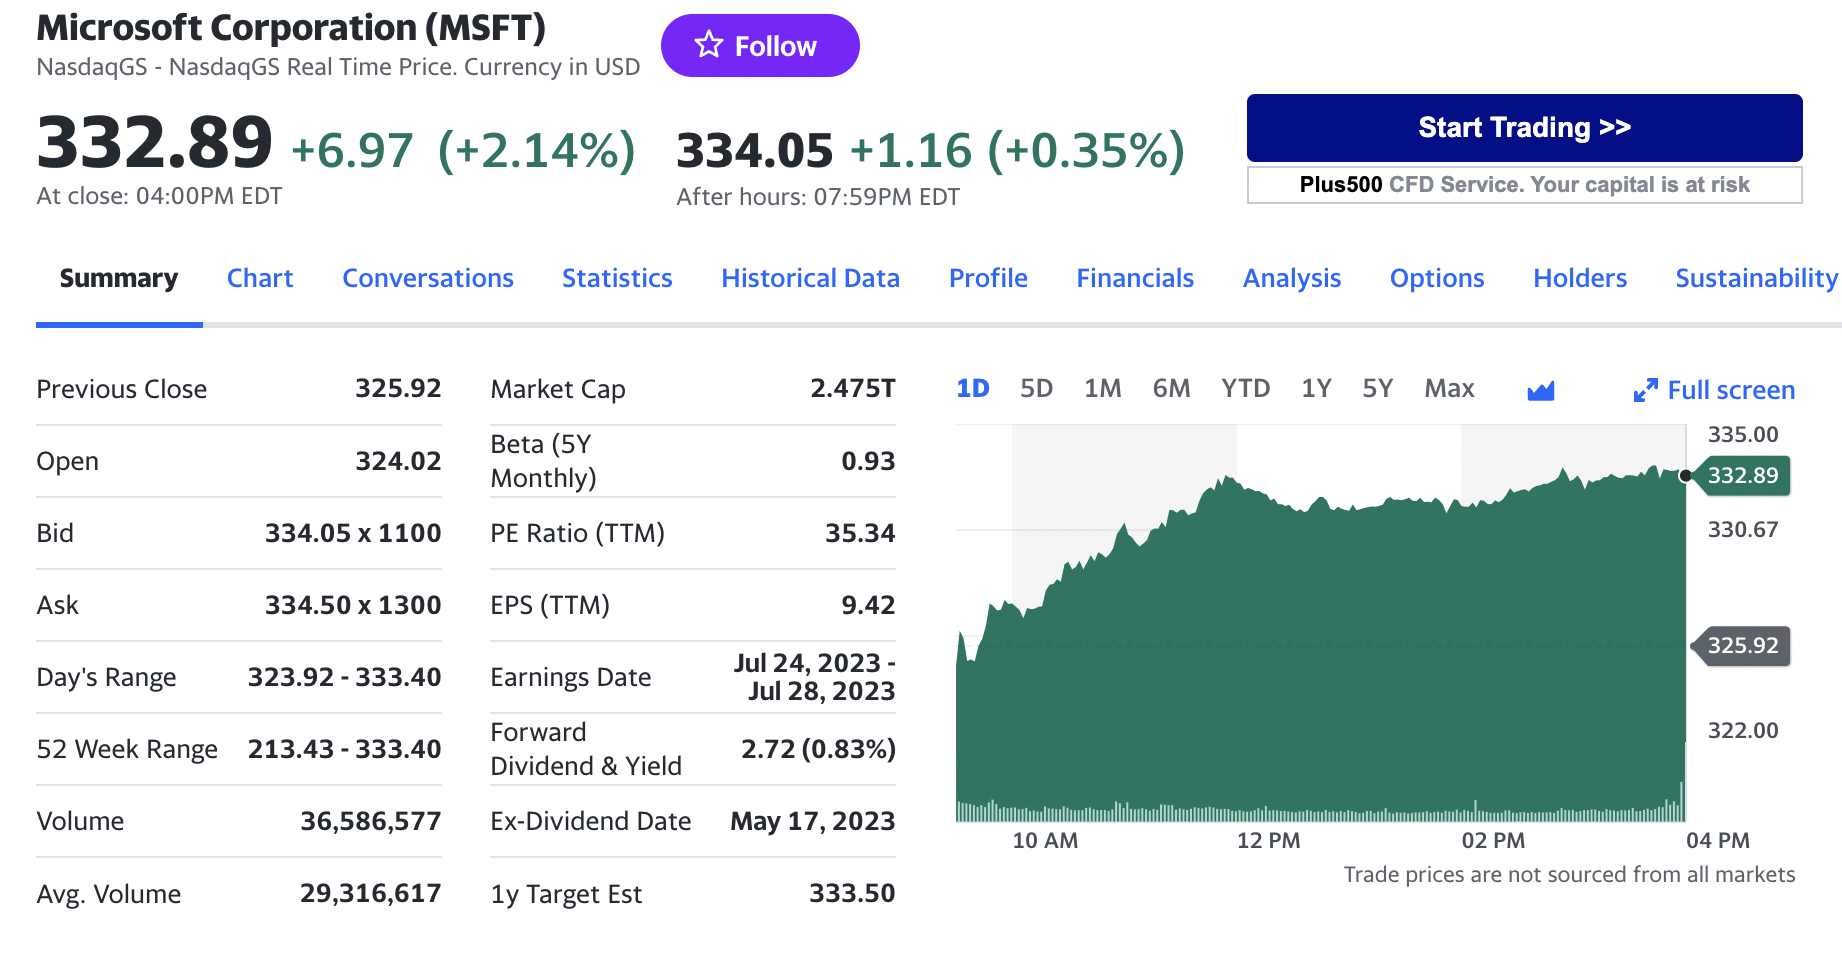
#2 Microsoft Corporation

Logo of Microsoft Corporation
 Logo of Microsoft Corporation
Source: the company.

Statistics (2023)

Market capitalization: $2,066 billion
Inclusion in stock market indexes: NASDAQ-100, S&P 500
Listing on stock exchanges: NASDAQ
Industry: Technology (Software)
Location of headquarters: Redmond, Washington, United States
Year founded: 1975
Number of employees: 221,000

Revenues

Microsoft is a multinational technology corporation that develops, manufactures, licenses, supports, and sells computer software, consumer electronics, personal computers, and related services. It is widely known for its flagship products such as the Windows operating system and Microsoft Office suite. The company has expanded into various other technology sectors, including cloud computing (Azure), gaming (Xbox), and enterprise software (Microsoft Dynamics). Microsoft has a strong presence in both consumer and enterprise markets.

Stock chart

Stock chart for Microsoft Corporation.
Stock chart for Microsoft Corporation
Source: Yahoo! Finance.

The historical data for Microsoft stock prices can be downloaded from Yahoo! Finance website: Download the data for Microsoft Corporation

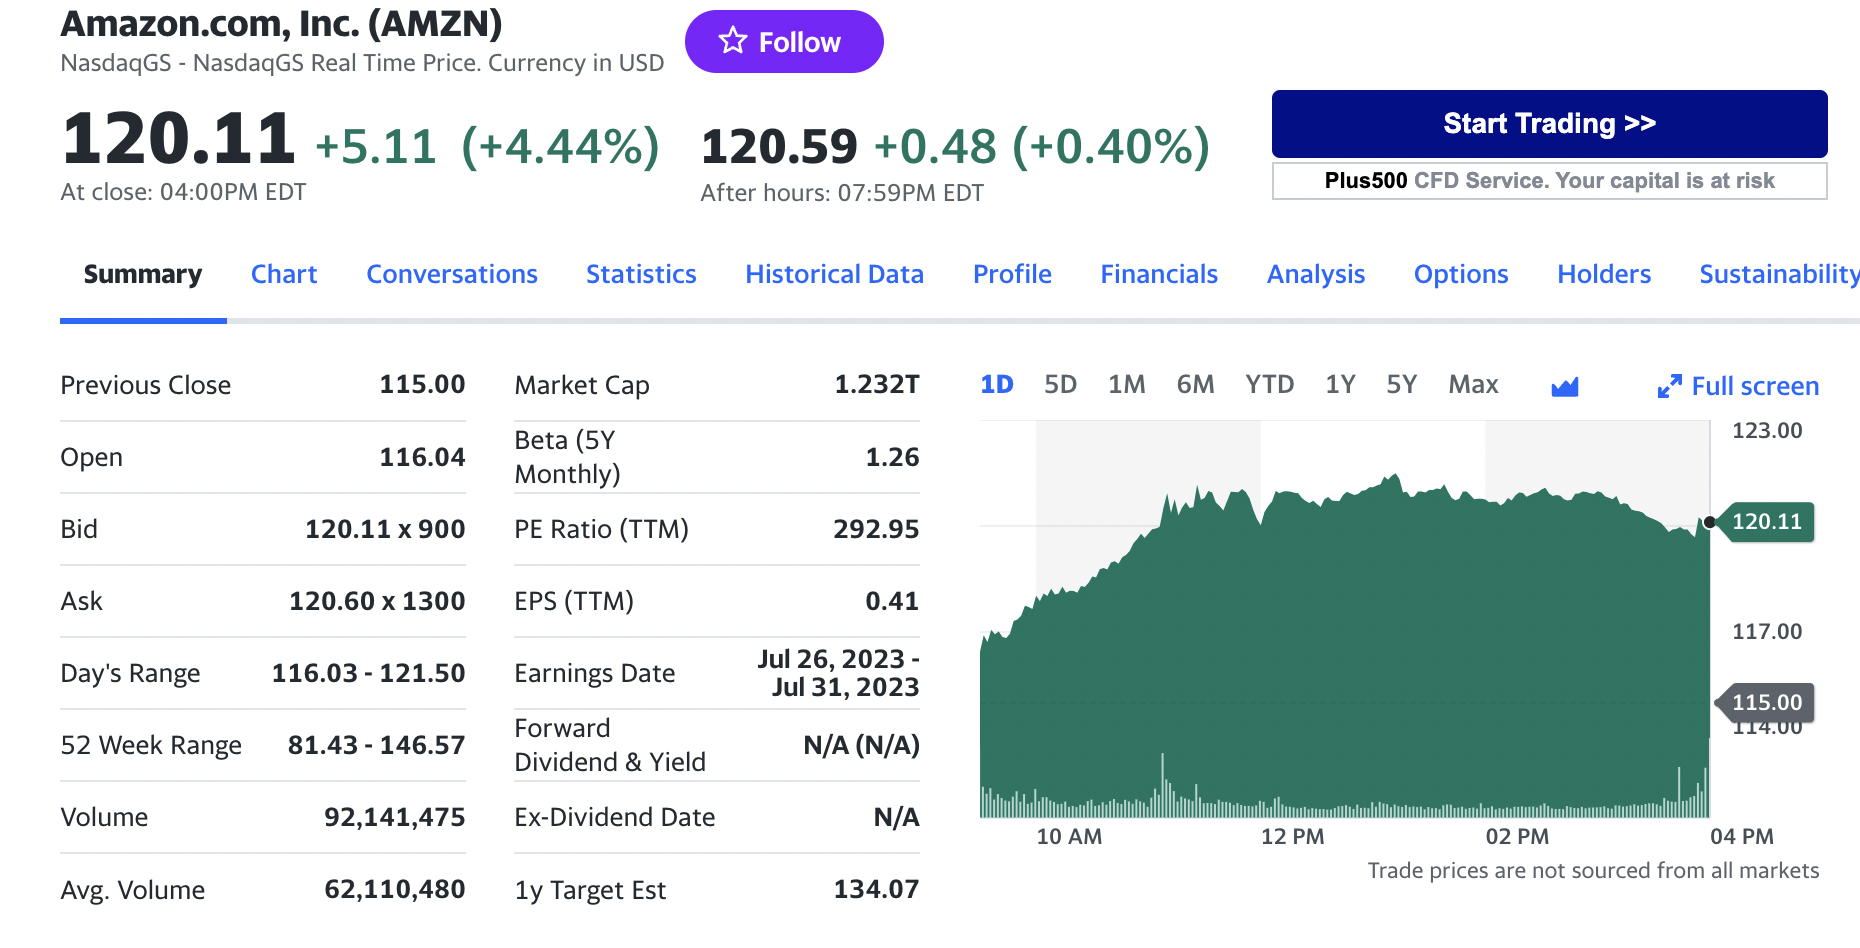
#3 Amazon Inc.

Logo of Amazon
Logo of Amazon
Source: the company.

Statistics (2023)

Market Capitalization: $1,011 billion
Inclusion in stock market indexes: NASDAQ-100, S&P 500
Listing on stock exchanges: NASDAQ
Industry: Retail (E-Commerce), Cloud Computing
Location of headquarters: Seattle, Washington, United States
Year founded: 1994
Number of employees: 1,465,000

Revenues

Amazon.com, Inc. is an American multinational conglomerate that focuses on e-commerce, cloud computing, digital streaming, and artificial intelligence. It is the world’s largest online marketplace and offers a wide range of products and services through its websites and platforms. Amazon’s services include Amazon Prime, Amazon Web Services (AWS), Kindle e-readers, and Amazon Echo devices. The company has also ventured into other areas, such as entertainment production and grocery retail. Amazon has experienced significant growth and expansion since its inception.

Stock chart

Stock chart for Amazon Inc.
Stock chart for Amazon Inc
Source: Yahoo! Finance.

The historical data for Amazon stock prices can be downloaded from Yahoo! Finance website: Download the data for Amazon

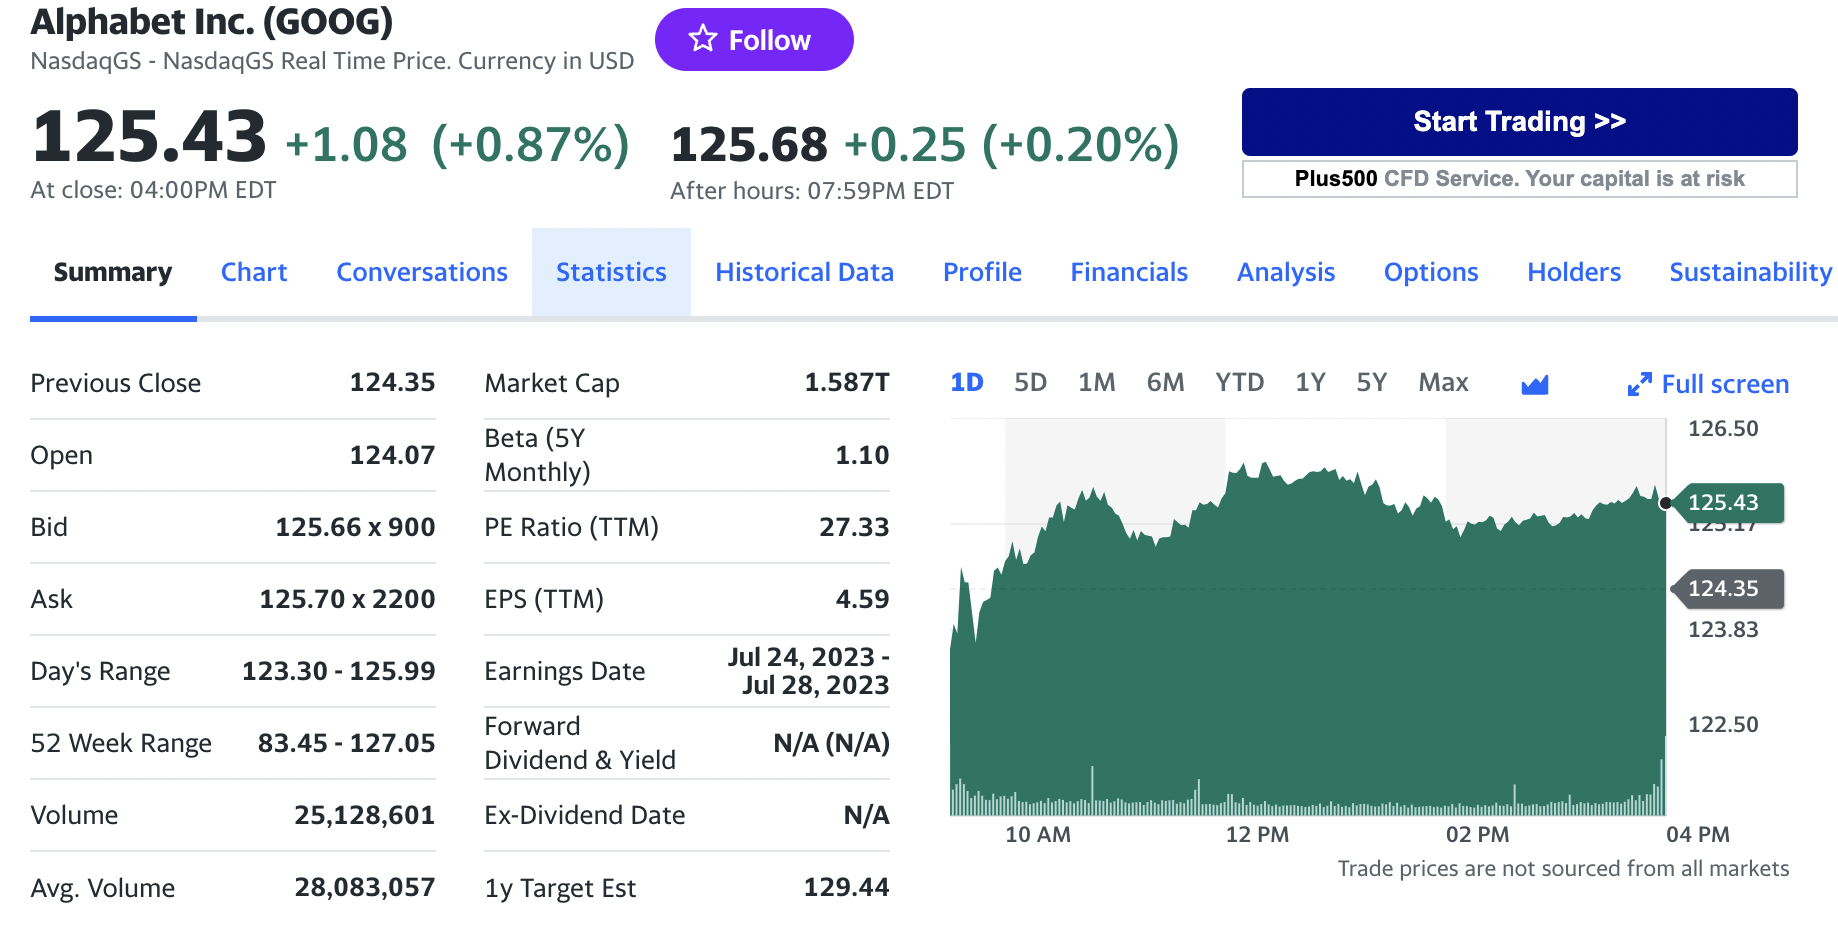
#4 Alphabet Inc. (formerly Google Inc.)

Logo of Alphabet
Logo of Alphabet
Source: the company.

Statistics (2023)

Market Capitalization: $1,356 billion
Inclusion in stock market indexes: NASDAQ-100, S&P 500
Listing on stock exchanges: NASDAQ
Industry: Technology (Internet Services)
Location of headquarters: Mountain View, California, United States
Year founded: 1998
Number of employees: 190,711

Revenues

Alphabet Inc. is a multinational conglomerate that serves as the parent company of Google and several other subsidiaries. Google, as a subsidiary of Alphabet Inc., is a technology company that generates a significant portion of Alphabet’s overall revenues. While specific revenue figures for Google are not provided separately in Alphabet’s financial reports, Google’s advertising business constitutes the majority of Alphabet’s revenue stream. Google primarily generates revenue through its advertising platforms, including Google Search, YouTube, Google Display Network, and Google Ads.

Stock chart

Stock chart for Alphabet Inc.
Stock chart for Alphabet
Source: Yahoo! Finance.

The historical data for Amazon stock prices can be downloaded from Yahoo! Finance website: Download the data for Alphabet

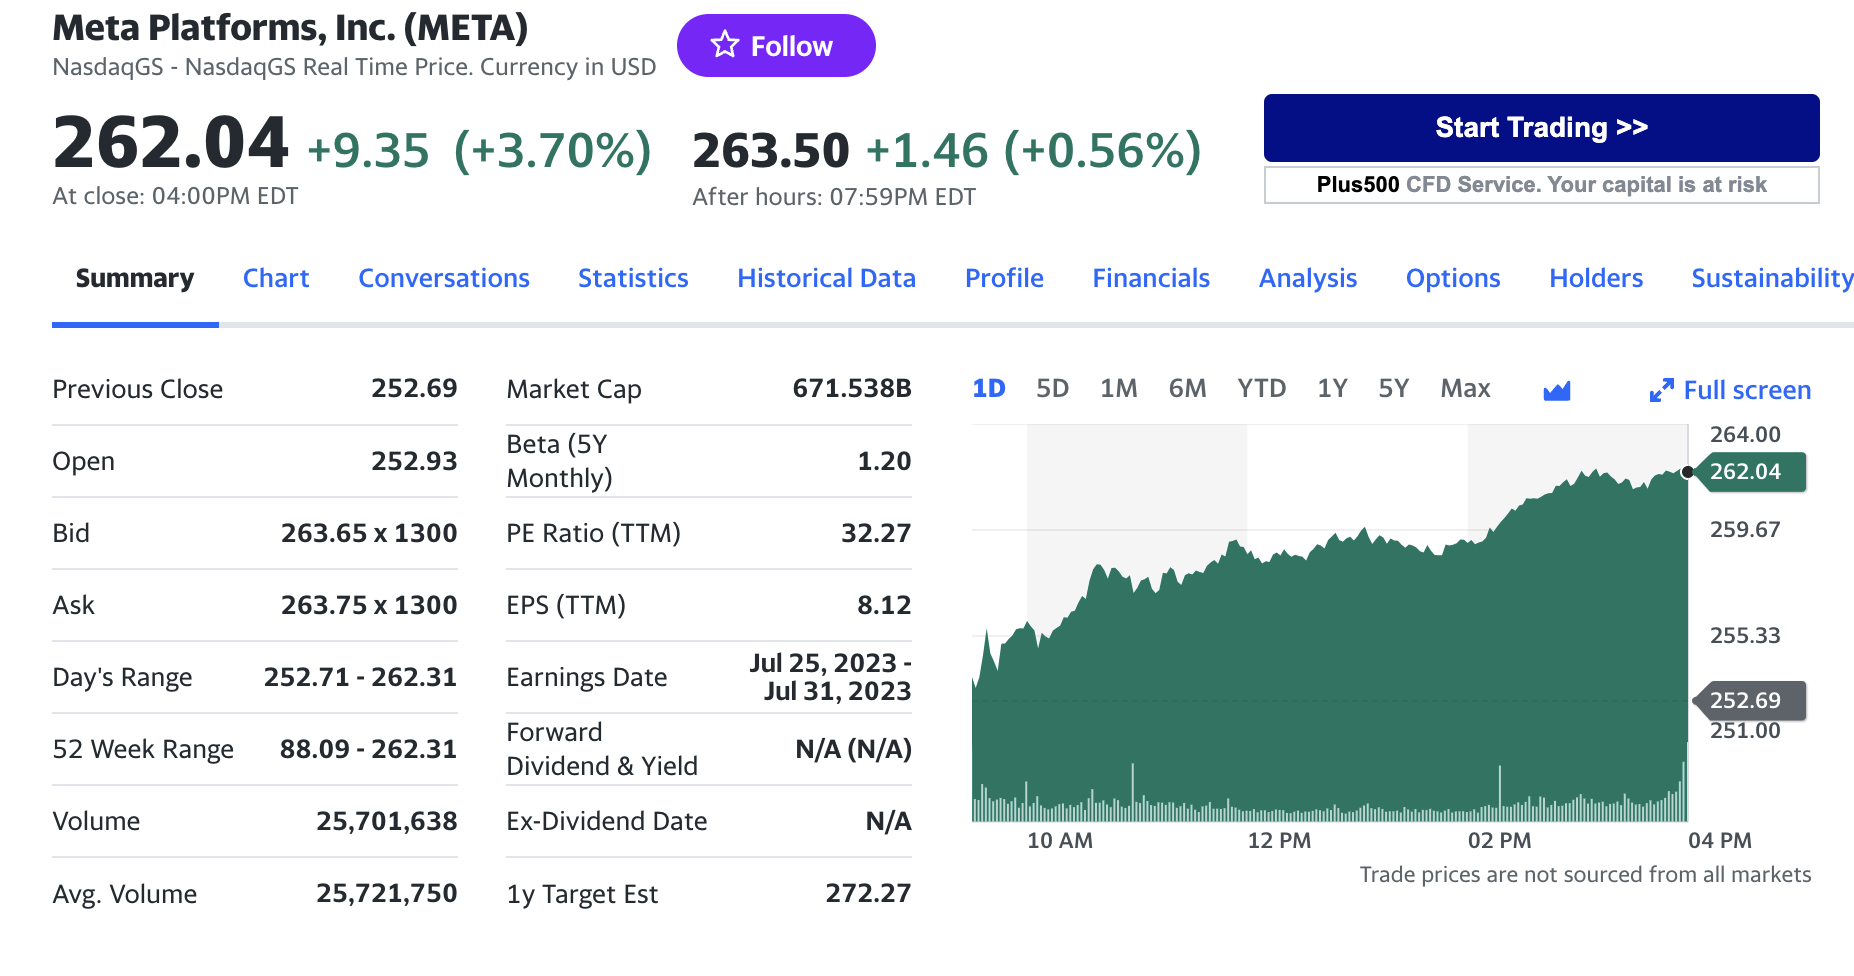
#5 Meta Platforms Inc. (formerly Facebook Inc.)

Logo of Meta
Logo of Meta
Source: the company.

Statistics (2023)

Market capitalization: $529 billion
Inclusion in stock market indexes: NASDAQ-100, S&P 500
Listing on stock exchanges: NASDAQ
Industry: Technology (Social Media)
Location of headquarters: Menlo Park, California, United States
Year founded: 2004
Number of employees: 86,482

Revenues

Meta Platforms Inc., previously known as Facebook Inc., is a social media and technology company that focuses on connecting people and enabling social interactions. The company operates various social networking platforms, including Facebook, Instagram, WhatsApp, and Messenger. These platforms offer users the ability to share content, communicate with others, and engage in online communities. Meta Platforms Inc. also provides advertising and marketing solutions to businesses, leveraging the vast user base of its platforms. The company has expanded into areas such as virtual reality (Oculus) and artificial intelligence research. It plays a significant role in shaping the digital landscape and has a global user reach.

Stock chart

Stock chart for Meta Platforms
Logo of  Meta Platforms Inc.
Source: the company.

The historical data for Meta Platforms stock prices can be downloaded from Yahoo! Finance website: Download the data for Meta Platforms

Why should I be interested in this post?

As a management student, understanding the top companies in different markets and their market capitalization holds significant value. It provides you with industry insights, allowing you to comprehend the competitive landscape and trends within specific sectors.

Analyzing market capitalization aids in investment analysis, enabling you to assess the size, growth potential, and financial health of companies. Moreover, studying successful companies (success being measured by their market capitalization) provides valuable lessons in competitive strategy, organizational management, and leadership practices.

Related posts on the SimTrade blog

All posts about financial techniques

▶ Nithisha CHALLA Market capitalization

▶ Nithisha CHALLA Top 5 companies by market capitalization in China

▶ Nithisha CHALLA Top 5 companies by market capitalization in India

▶ Nithisha CHALLA Top 5 companies by market capitalization in Europe

Useful resources

Companies Market Cap Largest American companies by market capitalization

Yahoo! The 30 Largest Companies on the Stock Market

About the author

The article was written in June 2023 by Nithisha CHALLA (ESSEC Business School, Grande Ecole Program – Master in Management, 2021-2023).

My internship experience as a marketing intern at Amazon

My internship experience as a marketing intern at Amazon

Fatimata KANE

In this article, Fatimata KANE (ESSEC Business School, Master in Strategy & Management of International Business, 2022-2023) shares her professional experience as a marketing intern at Amazon.

About the company

Amazon is a multinational technology company that was founded in 1994 by Jeff Bezos. Originally started as an online bookstore, the company has since expanded to become the world’s largest online retailer, selling a vast array of products and services across various categories, including electronics, fashion, home goods, groceries, and digital content.

Logo of Amazon.
Logo of  Amazon
Source: the company.

In addition to its e-commerce platform, Amazon has also expanded into other areas such as cloud computing (Amazon Web Services), digital streaming (Amazon Prime Video), smart home devices (Amazon Echo), and artificial intelligence (Amazon Alexa). The company is headquartered in Seattle, Washington, and operates in over 200 countries worldwide.

Amazon is known for its customer-centric approach and has a reputation for offering fast and convenient delivery options, competitive pricing, and a wide selection of products. The company’s mission statement is to “be Earth’s most customer-centric company, where customers can find and discover anything they might want to buy online.”

Amazon France

Amazon France is the French subsidiary of Amazon, which is the world’s largest online retailer. The company’s French website, Amazon.fr, was launched in 2000 and offers customers in France a wide selection of products across various categories, including electronics, books, fashion, home goods, and more.

As of 2021, Amazon France has over 22,000 employees and operates several distribution centers and warehouses throughout the country to ensure fast and reliable delivery to customers. The company also offers various delivery options, including same-day delivery and Amazon Prime, which provides free shipping and access to additional services such as streaming video and music.

I worked as a General Marketing Specialist Intern at Amazon France, in the retail business unit.

My internship

As a general marketing specialist intern at Amazon.fr, my role was to support the retail team in executing various marketing campaigns and initiatives to drive traffic, sales, and customer engagement on the website.

My missions

For example, I could assist in creating and publishing content on Amazon.fr’s social media accounts to promote products and engage with customers. This could include writing copy, designing graphics, and scheduling posts. I also created email campaigns to promote new products, sales, and other marketing initiatives. This could involve designing email templates, writing copy, and analyzing performance metrics.

I could also assist in managing Amazon.fr’s search engine marketing (SEM) campaigns to increase visibility and drive traffic to the website. This could involve keyword research, ad copy creation, and performance monitoring. Besides marketing content creation, I also oversaw auditing the marketing performances, and designed marketing plans for brands.

Required skills and knowledge

Working in this role required creativity, eagerness to learn, good communication skills, and high prioritization capacity.

What I learned

My internship experience with Amazon provided me with exceptional learning opportunities.

First, Amazon has a strong customer-centric approach, and this is reflected in all aspects of its marketing strategy. As an intern, I learned the importance of understanding customer needs and preferences and creating marketing campaigns that resonate with them.

Moreover, Amazon relies heavily on data analysis to inform its marketing decisions, and I had the opportunity to work with various analytics tools to measure the performance of marketing campaigns. This helped me develop a better understanding of the importance of data-driven decision-making.

Furthermore, in a large organization like Amazon, collaboration is essential. As an intern, I had the opportunity to work with different teams and departments to execute marketing campaigns. This taught me the importance of effective communication and teamwork.

Plus, Digital marketing is constantly evolving, and Amazon is at the forefront of innovation in the industry. As an intern, I had access to various training resources and had the opportunity to attend industry events and webinars to stay up-to-date with the latest trends and best practices.

Lastly, Amazon has a reputation for providing a seamless customer experience, and this requires a high level of attention to detail in all aspects of marketing. I thus learned the importance of quality assurance and attention to detail in all aspects of marketing campaigns, from copywriting to design.

Overall, my experience as a general marketing specialist intern at Amazon.fr was invaluable in helping me develop a better understanding of digital marketing and how it can be used to drive business growth and customer satisfaction.

Financial concepts related my internship

Although not focused on finance, my internship in marketing still allowed me to be in touch with several financial concepts such as:

Return on Investment (ROI)

As a marketing intern, I learned the importance of measuring the ROI of marketing campaigns. This involves calculating the revenue generated by a campaign compared to the cost of the campaign. This concept is related to financial analysis, where businesses must analyze the return on investment for any project or initiative.

Cost of Goods Sold (COGS)

COGS is a financial concept that represents the direct costs associated with producing and selling a product or service. As an intern, I learned how Amazon calculates the COGS for each product and how this impacts pricing and profitability.

Gross Margin

Gross margin is a financial concept that represents the difference between revenue and COGS. As an intern, I learned how Amazon manages its gross margin by optimizing pricing strategies, managing inventory levels, and reducing costs.

Why should I be interested in this post?

I greatly appreciated my experience at Amazon and would recommend the company to any curious and eager-to-learn individual who is interested in marketing and retail.

Related posts on the SimTrade blog

   ▶ All posts about professional experiences

   ▶ Bijal GANDHI Cost of goods sold

Useful resources

Amazon France

About the author

The article was written in April 2023 by Fatimata KANE (ESSEC Business School, Master in Strategy & Management of International Business, 2022-2023).