Can technical analysis actually help to make better trading decisions?

Can technical analysis actually help to make better trading decisions?

Theo SCHWERTLE

In this article, Theo SCHWERTLE (Maastricht University, School of Business and Economics, Bachelor in International Business, 2023) explains how technical analysis can actually help to make better trading decisions (or not).

Market efficiency

Let’s take a look at the different levels of market efficiency and their implications for a trader.

The efficient market hypothesis (EMH) posits that market prices fully incorporate all available information. If this hypothesis is verified, it is infeasible to consistently achieve higher returns than the market on a risk-adjusted basis. According to the EMH, stocks are believed to consistently trade at their fair value on exchanges, precluding the possibility of purchasing undervalued stocks or selling overvalued ones, thus implicitly dismissing the efficiency of technical analysis (TA) and fundamental analysis. As such, the EMH suggests that outperforming the overall market through security selection or market timing is infeasible, and the only way for investors to attain higher returns is by taking on increased risk in their investments.

Definitions

The EMH has three forms: the weak form, the semi-strong form and the strong form. The weak form of the EMH asserts that historical market data (transaction prices and volumes) cannot be used to predict future price movements. The semi-strong form of the EMH asserts that publicly available information (historical market data, financial account published by firms, reports written by financial analysts, etc.) cannot be used to predict future price movements. The strong form of the EMH asserts that both public and private information cannot be used to predict future movements.

Tests of the EMH

Though the strong form of the EMH is generally rejected, scholars are less consistent with evidence for or against the weak or semi-strong form of the EMH. Focusing on technical analysis, a significant body of literature has examined the relationship between EMH and technical analysis (TA), with many scholars rejecting the weak form (Leigh et al., 2002; Eugster and Uhl, 2022). The results of the tests seem to depend on the length of the investment period, the EMH being less rejected for a longer investment period.

Technical analysis

In the world of finance, Technical Analysis serves as an essential tool for investors and traders alike. The methodology involves forecasting future price movements based on the historical data of financial instruments. This strategy pivots on two core principles: the market discounts everything, and prices move in trends (Kirkpatrick & Dahlquist, 2010).

Chartism is one of the oldest techniques in technical analysis. It rests on the identification and analysis of chart patterns and price formations, with chartists meticulously studying these patterns to anticipate future market trends (Lo, Mamaysky, & Wang, 2000). This form of analysis operates on the principle that certain patterns are recurring and that understanding these patterns can provide insights into future price movements.

Another time-tested tool is Moving Averages, a technique that seeks to smooth out price data by creating a consistently updated average price. This approach comes in several variants, with the Simple Moving Average (SMA) and the Exponential Moving Average (EMA) being the most prevalent. These techniques help to clear out the ‘noise’ from random short-term price fluctuations and allow analysts to focus on the overall trend direction.

In stark contrast to these conventional methods stands the modern, technology-driven approach of High Frequency Trading (HFT). This innovative form of trading capitalizes on the power of advanced algorithms and high-speed data processing to execute trades at astonishing speeds. Unlike traditional technical analysis, which primarily focuses on transaction prices and volumes, HFT leverages real-time data from the order-flow and the order-book, exploring minute market discrepancies that might otherwise go unnoticed (Aldridge, 2010).

All we need is short-term market inefficiencies

Hirshleifer and Shumway (2003) gave meaningful insight into the relationship between the weather and daily market index return, demonstrating that sunshine is strongly and significantly correlated with stock returns. In line with that argumentation, Edmans et al. (2007) investigate the stock market reaction to sudden changes in investor mood, using international soccer results as the primary mood variable. The results show a significant market decline after soccer losses in equity markets of the losing teams, with a loss in the World Cup elimination stage leading to a next-day abnormal stock return of −49 basis points. This effect is more substantial in small stocks and more meaningful games and is robust to methodological changes. The same loss effect could also be documented for other international tournaments.

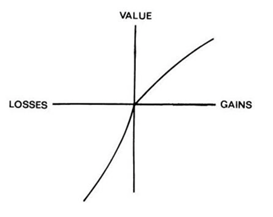
So what does that mean? There are human biases that make humans so different from the rational being many financial theories suggest we are.

Discussion about the feasibility of technical analysis for hedge funds

Hedge funds are also using technical analysis in their decision-making process; however, the degree of utilization varies significantly. The main area where TA is used by hedge funds is to find areas of liquidity to full big positions.

Kavajecz und Odders-White (2004) explored the relationship between TA and liquidity by testing the hypotheses that support and resistance levels coincide with peaks in depth on the limit order book and that moving-average forecasts reveal information about the relative position of depth on the book. They found that technical support/resistance levels, as well as moving average indicators, are significantly related to the state of liquidity on the limit order book and concluded that it is tied to the strategic behavior of limit order traders. This provides a reliable method for practitioners to locate liquidity in the book and reduce transaction costs.

The main advantage of TA is the low cost to construct a market perspective as it requires only market data. The implementation of TA is lower than acquiring and analyzing public or private information. So, if used adequately it is in face the cheaper and more accessible investment approach compared to traditional financial analysis tools.

Sounds good! Where is the catch?

According to Timmermann and Granger (2004), using new financial prediction methods may lead to short-term gains as the information is rapidly incorporated into market prices making the market the more efficient. As these new financial prediction methods become more widely used by other market participants, their effectiveness decreases over time. This idea is supported by studies showing that many stock market anomalies diminish, vanish, or even reverse after they are documented in academic literature (publication on the Social Science Research Network (SSRN) for example).

A broad study by Yamamoto (2012) investigated the profitability of exploiting short-term market inefficiencies and concluded that one could not generate consistent positive results that outperform a buy-and-hold strategy. Yamamoto (2012) analyzes technical strategies for 207 individual stocks in the Nikkei 225 over a one-year period and use two statistical procedures to reduce data-snooping bias (the data-snooping bias refers to the tendency to make false discoveries or draw incorrect conclusions when repeatedly testing and analyzing a dataset, often due to the increased likelihood of finding seemingly significant patterns or relationships by chance). The results indicate that all 9 technical trading strategies underperform the buy-and-hold strategy, suggesting that information on past prices and demand/supply imbalances are not sufficient for superior technical trading profits.

Conclusion

Short-term market inefficiencies can be exploited to generate positive returns. However, many of the found profitability diminish after introducing real market conditions, transaction fees or adjusting the returns for the increased risk. Generally, TA offers increased benefits over fundamental analysis in the short-term but loses ground with increased time as the market returns to efficiency. The difference in information costs motivates its popularity, but even if a profitable trading strategy is found, its benefits may only be enjoyed for a short time.

Why should I be interested in this post?

Technical analysis offers a different perspective on the market that is rarely touched on by university curriculums. This alternative approach is used by individual traders as well as institutional traders like hedge funds to find good entries and exits in the market. According to a survey by Menkhoff (2010), 77% of all hedge fund managers in their sample rate TA as really important to their decision-making, attributing a value of at least 10% to it in their decision-making process. About 20% of fund managers even indicate to prefer TA over fundamental analysis. So, it seems to offer some value, despite the academic criticism in line the efficiency of the market.

Related posts on the SimTrade blog

   ▶ Jayati WALIA Trend Analysis and Trading Signals

   ▶ Shruti CHAND Technical Analysis

   ▶ Martin VAN DER BORGHT Market efficiency

Useful resources

Academic articles

Edmans, A., García, D. & Norli, Y. (2007). Sports Sentiment and Stock Returns The Journal of Finance 62(4), 1967–1998.

Eugster, P. & Uhl, M. W. (2022). Technical analysis: Novel insights on contrarian trading. European Financial Management .

Fama, E. F. (1970). Efficient capital markets: A review of theory and empirical work. The Journal of Finance 25(2), 383-417.

Hirshleifer, D. & Shumway, T. (2003). Good Day Sunshine: Stock Returns and the Weather The Journal of Finance 58(3), 1009–1032.

Kavajecz, K. A. & Odders-White, E. R. (2004). Technical Analysis and Liquidity Provision Review of Financial Studies 17(4), 1043–1071.

Leigh, W., Purvis, R. & Ragusa, J. M. (2002). Forecasting the NYSE composite index with technical analysis, pattern recogniser, neural network, and genetic algorithm: a case study in romantic decision support Decision Support Systems 32(4), 361–377.

Lo, A. W., Mamaysky, H., & Wang, J. (2000). Foundations of technical analysis: Computational algorithms, statistical inference, and empirical implementation. The Journal of Finance 55(4), 1705-1770.

Menkhoff, L. (2010). The use of technical analysis by fund managers: International evidence. Journal of Banking & Finance 34(11), 2573–2586.

Timmermann, A. & Granger, C. W. (2004). Efficient market hypothesis and forecasting International Journal of Forecasting, 20(1), 15–27.

Yamamoto, R. (2012). Intraday technical analysis of individual stocks on the Tokyo Stock Exchange Journal of Banking & Finance, 36(11), 3033–3047.

Books

Aldridge, I. (2010). High-frequency trading: a practical guide to algorithmic strategies and trading systems. John Wiley & Sons.

Kirkpatrick II, C. D., & Dahlquist, J. R. (2010). Technical Analysis: The Complete Resource for Financial Market Technicians. FT press.

Lewis, M. (2014). Flash Boys: A Wall Street Revolt. W. W. Norton & Company.

About the author

The article was written in June 2023 by Theo SCHWERTLE (Maastricht University, School of Business and Economics, Bachelor in International Business, 2018-2023).

The Psychology of Trading

The Psychology of Trading

Theo SCHWERTLE

In this article, Theo SCHWERTLE (Maastricht University, School of Business and Economics, Bachelor in International Business, 2023) explains how behavioral biases can influence trading of market aprticiapnts.

Behavioral biases of investors

In complex decision environments, people use basic judgements and preferences to simplify the scenario rather than adhere to a strictly rational approach. This use of mental shortcuts is called heuristics, which are quick and instinctively appealing but may result in poor outcomes (Tversky and Kahneman, 1974). The traditional financial theory (based on expected utility theory) assumes that people are rational agents. In contrast to traditional financial theory, behavioral theories argue that people are generally risk-averse with a skewed view of probability (Kahneman and Tversky, 1979). Some common behavioral biases that have been identified in the literature on investment decisions include overconfidence, the disposition effect and herding behavior.

Prospect Theory

We start with the two main drivers of irrationality: value perception and probability perception.

Value perception. The value function proposed by Kahneman and Tversky (1979) is characterized by the following features. First, it is determined based on departures from a reference point. Second, it typically has a downward, concave slope for gains and an upward, convex slope for losses. This suggests that individuals perceive losses as more painful gains as shown in Figure 1.

Figure 1. Perceived value function.
Perceived value function
Source: Kahneman and Tversky (1979).

Probability perception. Individuals tend to assign a lower probability value to outcomes that are more likely to occur and, a higher probability value to outcomes that are less likely to occur as shown in Figure 2.

Figure 2. Perceived probability.
Perceived probability
Source: Kahneman and Tversky (1979).

Overconfidence

Overconfidence manifests as an inclination to have an irrationally excessive level of trust in one’s own abilities and opinions and has been thoroughly investigated across many fields (Fischhoff et al., 1977).

Gervais and Odean (2001) explore how overconfidence develops as a result of a dynamic change in beliefs about one’s ability after observing successes and failures. Successful traders tend to be overconfident due to attributing too much credit to their own ability. They showed that overconfidence is highest among inexperienced traders, as proper self-assessment only develops over time. This leads to suboptimal behavior, such as increased trading volume and volatility, lower expected profits, and poor information utilization (Statman et al., 2006).

Ekholm and Pasternack (2007) investigate the link between overconfidence and investor size.
They show that larger investors are less overconfident than small investors. They also show that larger investors, on average, react more positively to good news and more negatively to bad news than smaller investors. Evidence suggests that smaller, more overconfident investors have worse performance following negative news (Ekholm and Pasternack, 2007).

Grinblatt and Keloharju (2009) argue that sensations seekers (people receiving more speeding tickets) and those who showed more overconfidence as measured by a psychological assessment traded more than the average, even after controlling for other factors that might explain trading activity like age, income and gender. Similarly, individual investors tend to buy stocks that have recently caught their attention, like stocks with high trading volume, extreme one-day returns, or those in the news, whereas institutional investors, especially those who follow a value strategy, do not (Barber and Odean, 2007). These results are confirmed by Barber et al. (2022) as Robinhood users, which are, as evidence suggests, less experienced traders, trade substantially more high-attention stocks.

Additionally, men are more prone to overconfidence than women, particularly in male-dominated industries like finance. Thus, men trade more than women and perform worse in terms of returns. Male investors not only engage in more frequent trading but, compared to female investors, also hold larger and less diversified portfolios (Barber & Odean, 2001; Lepone et al., 2022).

Why should I be interested in this post?

This post explores heuristics and behavioral biases in decision-making, particularly in the context of investment decisions. Overconfidence can lead to poor outcomes. Additionally, it touches on gender differences, with men being more prone to overconfidence and engaging in more frequent trading. By understanding these biases, readers can gain insights into human behavior, make more informed investment decisions, and explore the impact of gender on financial outcomes. Overall, this post offers valuable insights into decision-making processes and their implications.

Related posts on the SimTrade blog

   ▶ Jayati WALIA Trend Analysis and Trading Signals

   ▶ Shruti CHAND Technical Analysis

Useful resources

Barber, B.M. and Odean, T. (2007) All That Glitters: The Effect of Attention and News on the Buying Behavior of Individual and Institutional Investors Review of Financial Studies 21(2):785–818.

Barber, B.M. and Odean, T. (2001) Boys will be Boys: Gender, Overconfidence, and Common Stock Investment The Quarterly Journal of Economics 116(1):261–292.

Ekholm, A. and Pasternack, D. (2007) Overconfidence and Investor Size European Financial Management.

Fischhoff, B., Slovic, P. and Lichtenstein, S. (1977) Knowing with certainty: The appropriateness of extreme confidence. Journal of Experimental Psychology: Human Perception and Performance 3(4):552–564.

Gervais, S. and Odean, T. (2001) Learning to Be Overconfident Review of Financial Studies 14(1):1–27.

Grinblatt, M. and Keloharju, M. (2009) Sensation Seeking, Overconfidence, and Trading Activity The Journal of Finance 64(2):549–578.

Kahneman, D. and Tversky, A. (1979) Prospect Theory: An Analysis of Decision under Risk Econometrica 47(2): 263.

Lepone, G., Westerholm, J. and Wright, D. (2022) Speculative trading preferences of retail investor birth cohorts Accounting & Finance.

Statman, M., Thorley, S. and Vorkink, K. (2006) Investor Overconfidence and Trading Volume Review of Financial Studies 19(4):1531–1565.

Tversky, A. and Kahneman, D. (1974) Judgment under Uncertainty: Heuristics and Biases Science 185(4157):1124–1131.

About the author

The article was written in May 2023 by Theo SCHWERTLE (Maastricht University, School of Business and Economics, Bachelor in International Business, 2018-2023).

My professional experience as B2B Project assistant manager at Dance

My professional experience as B2B Project assistant manager at Dance

Theo SCHWERTLE

In this article, Theo SCHWERTLE (Maastricht University, School of Business and Economics, Bachelor in International Business, 2023) shares his experience as a B2B Project assistant manager at Dance which is a start-up in urban mobility.

About the company

Dance is a progressive company that is reshaping urban mobility by providing an electric mobility subscription service. The company offers members the freedom to explore their city with an electric bike or moped, with maintenance and repairs included in the membership. Founded by the creators of SoundCloud and Jimdo, Dance is currently operating in Berlin, Hamburg, Munich, Vienna, and Paris, with a focus on making urban commuting more connected, convenient, and environmentally friendly.

Logo of the company.
Logo of Dance
Source: Dance.

My internship

As part of the Dance for Business department, I was privileged to contribute to various crucial aspects of the business, including the development and standardization of Business-to-Business (B2B) playbooks for client outreach, engagement, and account management. I also had the opportunity to manage the company pipeline using our Customer Relationship Management (CRM) tool, conduct competitive market research, and collaborate with cross-functional teams to execute lead generation strategies and client retention initiatives.

My missions

My mission at Dance was multifaceted, encompassing both client relationship management and sales strategy. I was responsible for creating and developing B2B pitch decks, preparing and supporting pitch meetings with new clients, and building long-term relationships with our clients to provide the best service possible. Serve as the first point of contact for all B2B clients, but also to find new strategies to acquire more customers. Furthermore, we were making Partnership deals with other service providers to spread the word about the mobility solution that Dance offers.

Required skills and knowledge

This role required strong interpersonal skills for building and maintaining client relationships, as well as proficiency in using CRM tools to manage the company pipeline. It also called for a solid understanding of sales strategies and market research methodologies. Since we were only a small team, communication and constant prioritization of tasks was paramount. Interpersonal skills have strongly increased during that time since I was constantly pitching to the management of firms like AboutYou or Inditex while also taking care of our current clients.

What I learned

Project Management: In preparing B2B pitch decks and supporting pitch meetings, you would have honed your project management and organization skills.

Communication: Being the first point of contact for all B2B clients and building long-term relationships with them would have strengthened your communication and interpersonal skills.

Strategic Thinking: Conducting competitive market research and collaborating on lead generation strategies likely helped develop your strategic thinking and market analysis abilities.

Problem Solving: Proposing solutions in line with business objectives and incorporating new initiatives shows your problem-solving capabilities.

Financial concepts related my internship

Customer Acquisition Cost (CAC)

Customer Acquisition Cost (CAC) refers to the total expenses a company incurs to convince a potential customer to purchase its product or service. It includes costs related to marketing and sales efforts and is a key metric for determining the return on investment for acquisition strategies.

Contribution Margin

Contribution Margin is a financial metric that calculates the profitability for individual items sold by a company. It is determined by subtracting the variable costs (costs that change with the amount of goods or services produced) associated with a product from the revenue generated by that product.

Customer Lifetime Value

Customer Lifetime Value (LTV) is a projection of the total net profit a company expects to earn from a customer throughout the business relationship. It takes into account the revenue a customer would generate, the costs of acquiring and serving the customer, and the duration of the relationship with the customer.

Why should I be interested in this post?

If you’re looking to gain insights into the world of business operations or contemplating a career in a similar industry, this post should be of high interest to you. The financial concepts discussed here form the backbone of many successful businesses. Understanding these concepts can help you view business operations from a new perspective, providing you with a solid base for making informed decisions.

Furthermore, sharing my experience at Dance provides an insider’s perspective into how the start-up operates and how different roles contribute to its success.

My experience at Dance was nothing short of enriching. With the right blend of motivation, attention to detail, and focus on business objectives, I was able to contribute effectively to the company’s success. I hope my insights will inspire and guide those looking to embark on a similar professional journey.

Related posts on the SimTrade blog

   ▶ All posts about Professional experiences

   ▶ Jayna MELWANI My professional experience as a Global Development and Learning Intern at Danone

Useful resources

Dance

About the author

The article was written in May 2023 by Theo SCHWERTLE (Maastricht University, School of Business and Economics, Bachelor in International Business, 2018-2023).