

In this article , Raphael TRAEN (ESSEC Business School, Global BBA, 2023-2024) explains about the Volume-Weighted Average Price (abbreviated as VWAP), a statistic used by traders to determine the average trading taking into account transaction volume.
Definition
The volume-weighted average price (VWAP) is a measurement that shows the average price of a security, adjusted for its volume. It is calculated during a specific trading session by taking the total dollar value of trading in the security (sum of the products of the price by the quantity of each trade during the trading session) and dividing it by the total volume of trades (sum of the quantities of each trade during the trading session). The formula for calculating VWAP is given by
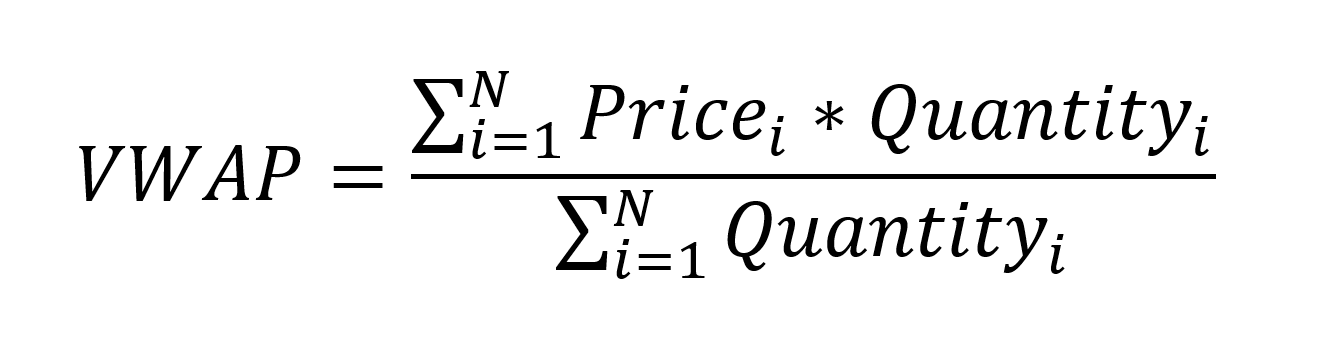
Where N is the number of transactions during the trading session (trading day).
VWAP can also be computed for consecutive time intervals during the trading sessions.
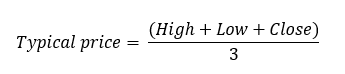
Sometimes, the price is replaced by a “typical price” computed as the average of the minimal price, maximal price, and closing price observe over a time interval.
Interpreting the VWAP indicator / Key takeaways
Volume-weighted average price (VWAP) is a popular technical indicator used by traders and investors to identify trends, support and resistance levels, and potential entry and exit points. It can also be used for example to assess the liquidity and market depth of a security. If the VWAP is closely clustered around the current price, it suggests that there is a lot of liquidity and that the market is well-balanced. If the VWAP is spread out over a wide range of prices, it suggests that the market is less liquid and that there is a higher risk of wide price swings.
Breakout above the VWAP line suggests a bullish trend
A breakout above VWAP suggests that the price has momentum and is moving upwards. This could be due to increased buying pressure from investors, indicating a shift in sentiment towards the security. Once the price breaks above VWAP, it can act as a support level, making it more difficult for the price to fall below that level.
This could be an opportunity to enter a long position, anticipating the price to continue rising.
Breakdown below the VWAP line suggests a bearish trend
If the price of a security breaks below the VWAP line, it may signal a potential bearish trend. This could be an opportunity to enter a short position, anticipating the price to continue falling.
VWAP line can act as support or resistance level
The VWAP line can also function as a support or resistance level, representing a price range where the price of the security may tend to bounce off.
VWAP to identify trends
If the VWAP line is trending upwards, it suggests an overall upward trend in the price of the security. This could indicate favorable conditions for long-term investments. Conversely, if the VWAP line is trending downwards, it suggests an overall downward trend in the price of the security. This could indicate caution for long-term investments.
Conclusion
It is important to note that VWAP is just one indicator, and it should not be used in isolation. It is always a good idea to consider other technical indicators, such as the moving average convergence divergence (MACD) and the relative strength index (RSI), before making any trading decisions.
Often, multiple interpretations are possible and because of this, it is important to use the VWAP in combination with other indicators.
As I said, a breakdown below the VWAP may suggest a bearish trend. But it can also be interpreted as the following: Stocks with prices below the VWAP are considered as undervalued and those with prices above it, overvalued.
So while some institutions may prefer to buy when the price of the security is below the VWAP or sell when it is above, VWAP is not the only factor to consider. In strong uptrends, the price may continue to move higher for many days without dropping below the VWAP at all. Therefore, waiting for the price to fall below the VWAP could mean a missed opportunity if prices are rising quickly.
Why should I be interested in this post?
This article will provide students interested in business and finance a comprehensive overview of VWAP and how it is used by traders and investors. By understanding this fundamental concept in technical analysis, students will gain a valuable tool for making informed investment decisions.
Related posts on the SimTrade blog
▶ Shruti CHAND Technical analysis
▶ Shruti CHAND Technical Analysis, Moving Averages
▶ Theo SCHWERTLE Can technical analysis actually help to make better trading decisions
▶ Giovanni PAGLIARDI Tail relation between return and volume
Useful resources
Academic articles
Menkhoff, L. (2010) The use of technical analysis by fund managers: International evidence, Journal of Banking & Finance 34(11): 2573-2586.
Kirkpatrick II, C. D., and J.R. Dahlquist (2010) Technical Analysis: The Complete Resource for Financial Market Technicians. FT press.
Videos
Humbled Trader VWAP Trading Strategy Crash Course (YouTube video)
MHFIN VWAP Explained For Beginners In Under 5 Minutes (YouTube video)
About the author
The article was written in December 2023 by Raphael TRAEN (ESSEC Business School, Global BBA, 2023-2024).


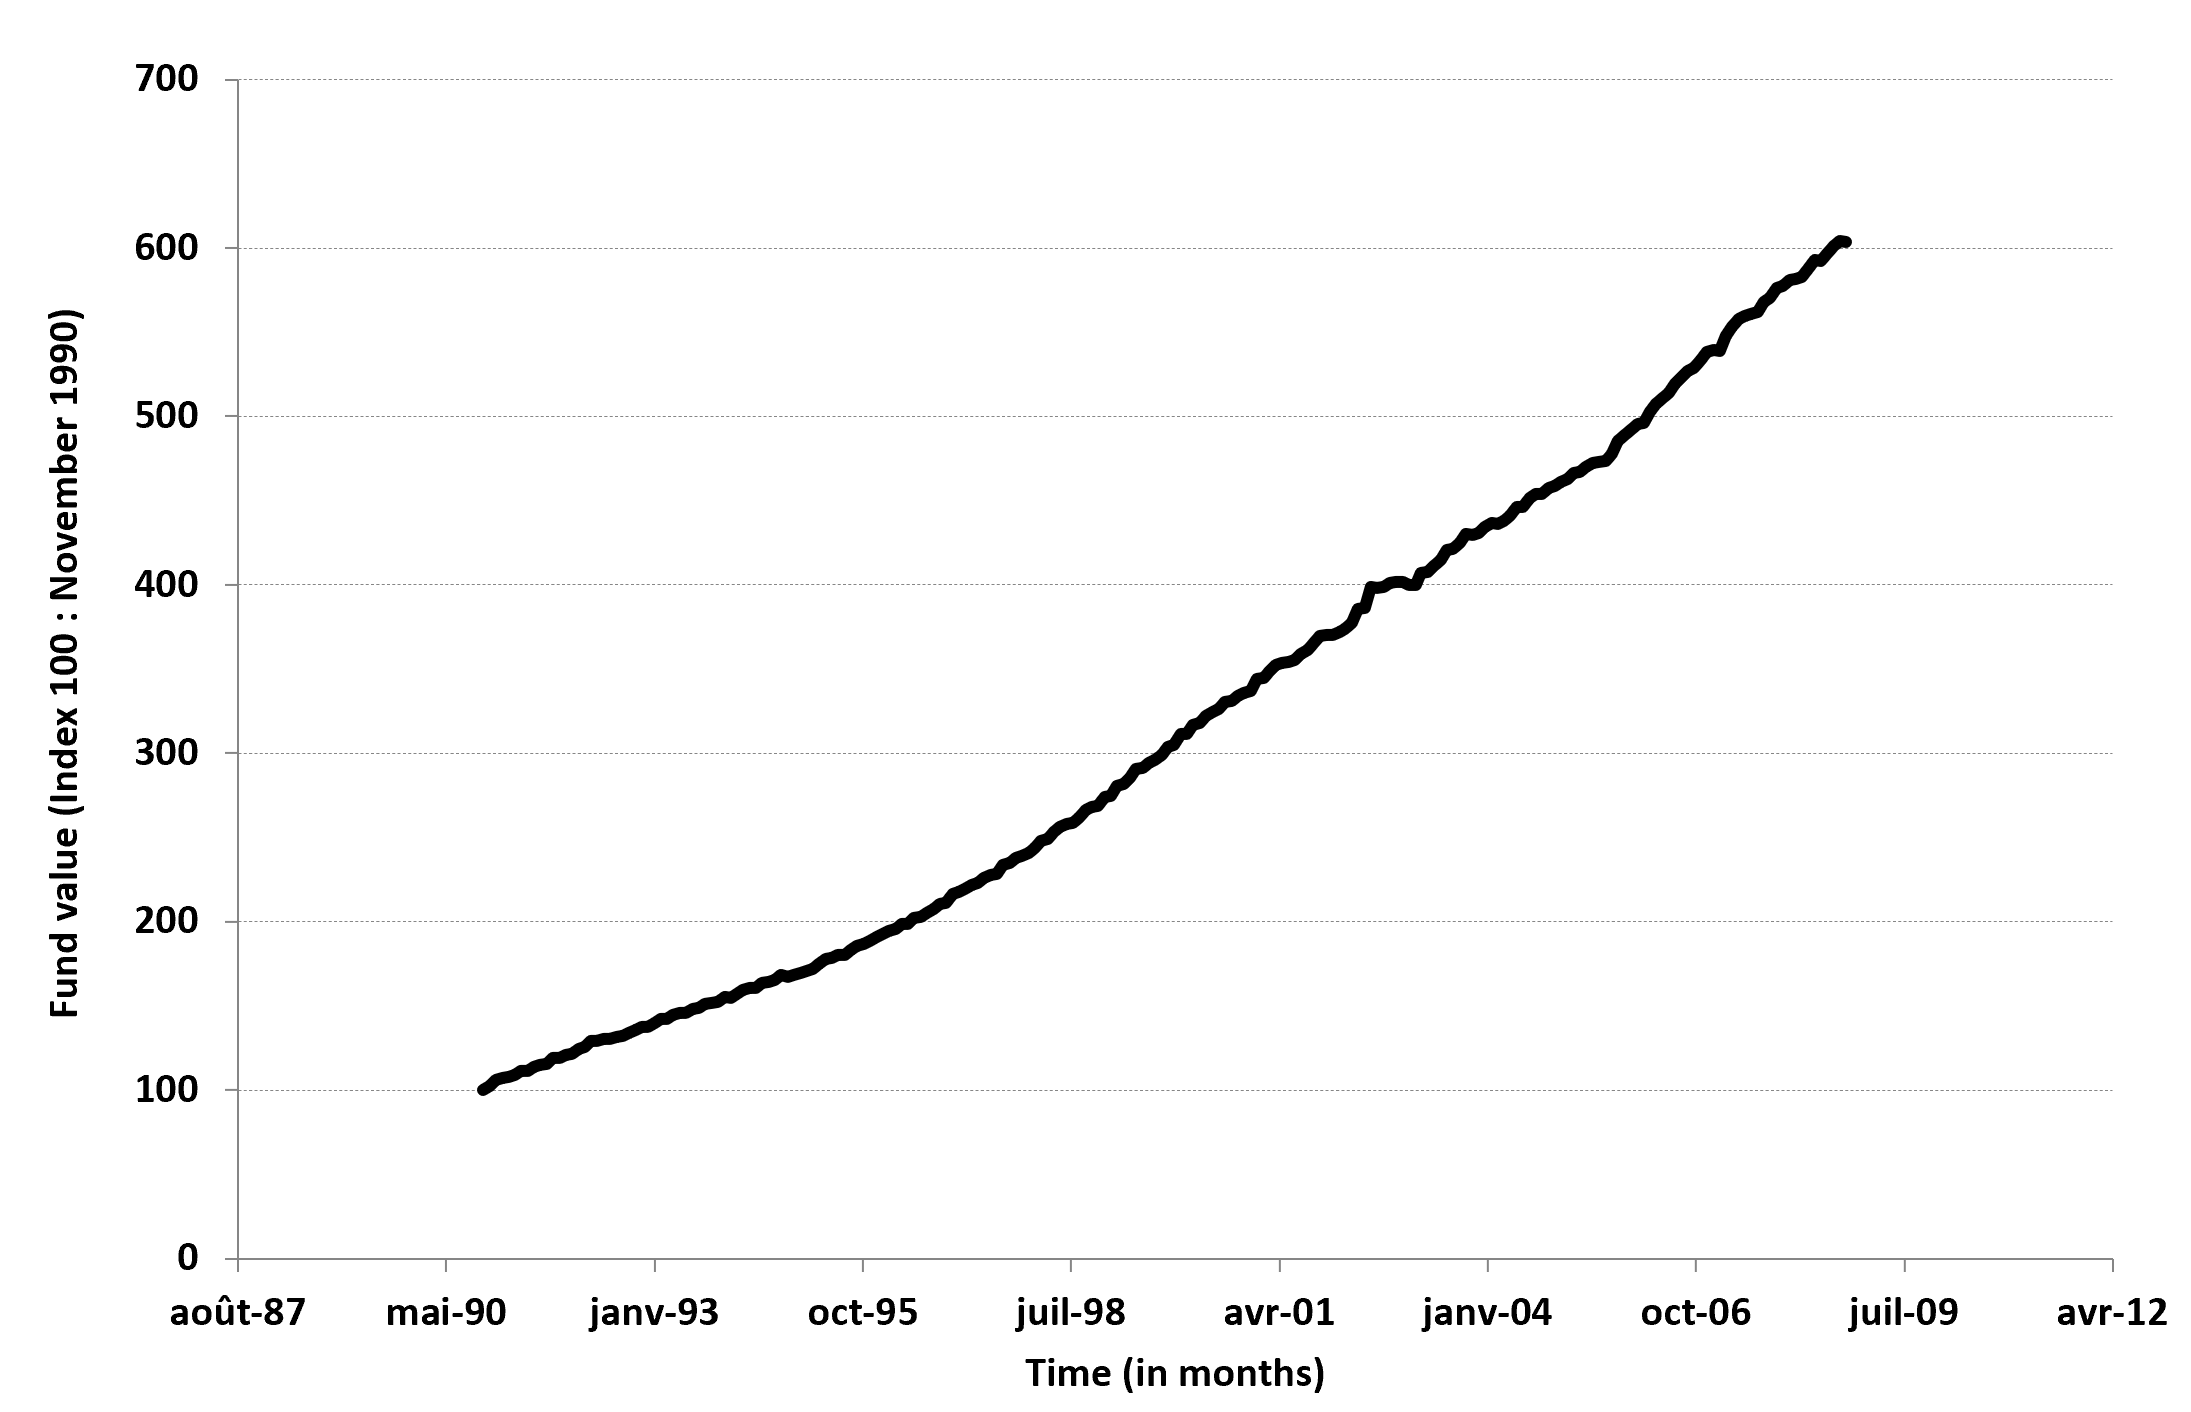 Source: Madoff
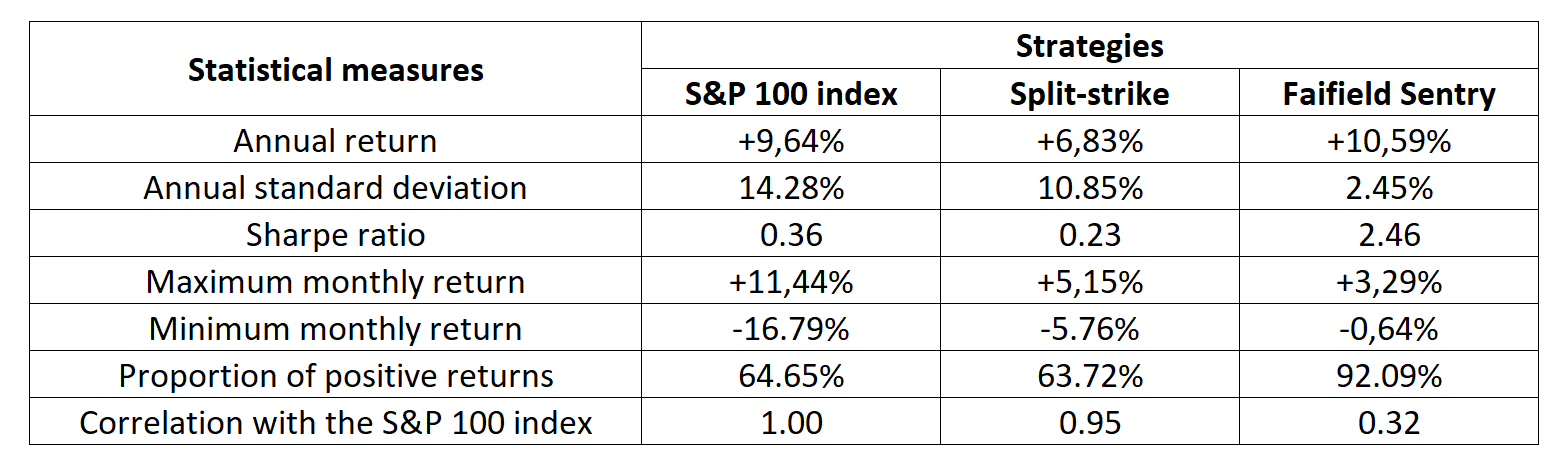 Source: Bernard and Boyle (2009)