Market Making

Market Making

Martin VAN DER BORGHT

In this article, Martin VAN DER BORGHT (ESSEC Business School, Master in Finance, 2022-2024) explains the activity of market making which is key to bring liquidity in financial markets.

Market Making: What is It and How Does It Work?

Market making is a trading strategy that involves creating liquidity in a security by simultaneously being ready to buy and sell amount of that security. Market makers provide an essential service to the market by providing liquidity to buyers and sellers, which helps to keep stock prices stable (by limiting the price impact of incoming orders). This type of trading is often done by large institutional investors such as banks. In this article, I will explore what market making is, how it works, and provide some real-life examples of market makers in action.

What is Market Making?

Market making is a trading strategy that involves simultaneously being ready to buy and sell amounts of a security in order to create or improve market liquidity for other participants. Market makers are also known as “specialists” or “primary dealers” on the stock market. They act as intermediaries between buyers and sellers, providing liquidity to the market by always being willing to buy and sell a security at a certain price (or more precisely at two prices: a price to buy and a price to sell). The remuneration of a market maker is obtained by making a profit by taking the spread between the bid and ask prices of a security.

How Does Market Making Work?

Market makers create liquidity by always having an inventory of securities that they can buy and sell. They are willing to buy and sell a security at any given time, and they do so at a certain price. The price they buy and sell at may be different from the current market price, as market makers may be trying to influence the price of a security in order to make a profit.

Market makers buy and sell large amounts of a security in order to maintain an inventory, and they use a variety of techniques to do so. For example, they may buy large amounts of a security when the price is low and sell it when the price is high. They may also use algorithms to quickly buy and sell a security in order to take advantage of small price movements.

By providing liquidity to the market, market makers help to keep stock prices stable. They are able to do this by quickly buying and selling large amounts of a security in order to absorb excess demand or supply. This helps to prevent large price fluctuations and helps to keep the price of a security within a certain range.

Market making nowadays

One of the most well-known examples of market making is the role played by Wall Street banks. These banks act as market makers for many large stocks on the NYSE and NASDAQ. They buy and sell large amounts of a security in order to maintain an inventory, and they use algorithms to quickly buy and sell a security in order to take advantage of small price movements.

Another example of market making is the practice of high-frequency trading. In his book Flash Boys, author Michael Lewis examines the impact of high frequency trading (HFT) on market making. HFT uses powerful computers and sophisticated algorithms to rapidly analyze large amounts of data, allowing traders to make trades in milliseconds. This has led to an increased use of HFT for market making activities, which has caused some to argue that it may be harming market liquidity and efficiency. Market makers have begun using HFT strategies to gain an edge over traditional market makers, allowing them to make markets faster and at narrower spreads. This has resulted in tighter spreads and higher trading volumes, but it has also been argued that it has led to increased volatility and decreased liquidity. As a result, some investors have argued that HFT strategies have created an uneven playing field, where HFT firms have an advantage over traditional market makers.

The use of HFT has also raised concerns about the fairness of markets. HFT firms have access to large amounts of data, which they can use to gain an informational advantage over other market participants. This has raised questions about how well these firms are able to price securities accurately, and whether they are engaging in manipulative practices such as front running. Additionally, some argue that HFT firms are able to take advantage of slower traders by trading ahead of them and profiting from their trades.

These concerns have led regulators to take a closer look at HFT and market making activities. The SEC and other regulators have implemented a number of rules designed to protect investors from unfair or manipulative practices. These include Regulation NMS, which requires market makers to post their best bid and ask prices for securities, as well as Regulation SHO, which prohibits naked short selling and other manipulative practices. Additionally, the SEC has proposed rules that would require exchanges to establish circuit breakers and limit the amount of order cancellations that can be done in a certain period of time. These rules are intended to ensure that markets remain fair and efficient for all investors.

Conclusion

In conclusion, market making is a trading strategy that involves creating liquidity in a security by simultaneously being ready to buy and sell large amounts of that security. Market makers provide an essential service to the market by providing liquidity to buyers and sellers, which helps to keep stock prices stable. Wall Street banks and high-frequency traders are two of the most common examples of market makers.

Related posts on the SimTrade blog

   ▶ Akshit GUPTA Market maker – Job Description

Useful resources

SimTrade course Market making

Michael Lewis (2015) Flash boys.

U.S. Securities and Exchange Commission (SEC) Specialists

About the author

The article was written in January 2023 by Martin VAN DER BORGHT (ESSEC Business School, Master in Finance, 2022-2024).

Evidence of underpricing during IPOs

Evidence of underpricing during IPOs

Martin VAN DER BORGHT

In this article, Martin VAN DER BORGHT (ESSEC Business School, Master in Finance, 2022-2024) exposes the results of various studies concerning IPO underpricing.

What is IPO Underpricing?

Underpricing is estimated as the percentage difference between the price at which the IPO shares were sold to investors (the offer price) and the price at which the shares subsequently trade in the market. As an example, imagine an IPO for which the shares were sold at $20 and that the first day of trading shows shares trading at $23.5, thus the associated underpricing induced is (23.5 / 20) -1 = 17.5%.

In well-developed capital markets and in the absence of restrictions on how much prices are allowed to fluctuate by from day to day, the full extent of underpricing is evident fairly quickly, certainly by the end of the first day of trading as investor jump on an occasion to reflect the fair value of the asset entering the market, and so most studies use the first-day closing price when computing initial underpricing returns. Using later prices, say at the end of the first week of trading, is useful in less developed capital markets, or in the presence of ‘daily volatility limits’ restricting price fluctuations, because aftermarket prices may take some time before they equilibrate supply and demand.

In the U.S. and increasingly in Europe, the offer price is set just days (or even more typically, hours) before trading on the stock market begins. This means that market movements between pricing and trading are negligible and so usually ignored. But in some countries (for instance, Taiwan and Finland), there are substantial delays between pricing and trading, and so it makes sense to adjust the estimate of underpricing for interim market movements.

As an alternative to computing percentage initial returns, underpricing can also be measured as the (dollar) amount of ‘money left on the table’. This is defined as the difference between the aftermarket trading price and the offer price, multiplied by the number of shares sold at the IPO. The implicit assumption in this calculation is that shares sold at the offer price could have been sold at the aftermarket trading price instead—that is, that aftermarket demand is price-inelastic. As an example, imagine an IPO for which the shares were sold at $20 and that the first day of trading shows shares trading at $23.5, with 20 million shares sold. The initial IPO in dollars was $400,000,000 and at the end of the first trading day this amount goes down to $470,000,000, inducing an amount of money left on the table of $70,000,000.

The U.S. probably has the most active IPO market in the world, by number of companies going public and by the aggregate amount of capital raised. Over long periods of time, underpricing in the U.S. averages between 10 and 20 percent, but there is a substantial degree of variation over time. There are occasional periods when the average IPO is overpriced, and there are periods when companies go public at quite substantial discounts to their aftermarket trading value. In 1999 and 2000, for instance, the average IPO was underpriced by 71% and 57%, respectively. In dollar terms, U.S. issuers left an aggregate of $62 billion on the table in those two years alone. Such periods are often called “hot issue markets”. Given these vast amounts of money left on the table, it is surprising that issuers appear to put so little pressure on underwriters to change the way IPOs are priced. A recent counterexample, however, is Google’s IPO which unusually for a U.S. IPO, was priced using an auction.

Why Has IPO Underpricing Changed over Time?

Underpricing is the difference between the price of a stock when it is first offered on the public market (the offer price) and the price at which it trades after it has been publicly traded (the first-day return). Various authors note that underpricing has traditionally been seen as a way for firms to signal quality to potential investors, which helps them to attract more investors and raise more capital.

In their study “Why Has IPO Underpricing Changed over Time? “, authors Tim Loughran and Jay Ritter discuss how the magnitude of underpricing has varied over time. They note that the average underpricing was particularly high in the 1970s and 1980s, with average first-day returns of around 45%. However, they also find that underpricing has declined significantly since then, with average first-day returns now hovering around 10%.

They then analyze the reasons for this decline in underpricing. They argue that the increased availability of information has made it easier for potential investors to assess a company’s quality prior to investing, thus reducing the need for firms to signal quality through underpricing. Additionally, they suggest that increased transparency and reduced costs of capital have also contributed to the decline in underpricing. Finally, they suggest that improved liquidity has made it easier for firms to raise capital without relying on underpricing.

These changes in underpricing have affected both existing and potential investors. Main arguments are that existing shareholders may benefit from reduced underpricing because it reduces the amount of money that is taken out of their pockets when a company goes public. On the other hand, potential investors may be disadvantaged by reduced underpricing because it reduces the return they can expect from investing in an IPO.

In conclusion we can note that while underpricing has declined significantly over time, there is still some evidence of underpricing in today’s markets. It suggests that further research is needed to understand why this is the case and how it affects investors. Many argue that research should focus on how different types of IPOs are affected by changes in underpricing, as well as on how different industries are affected by these changes. Additionally, they suggest that researchers should investigate how different investor groups are affected by these changes, such as institutional investors versus retail investors.

Overall, studies provide valuable insight into why IPO underpricing has changed so dramatically over the past four decades and how these changes have affected both existing shareholders and potential investors. It provides convincing evidence that increased access to information, greater transparency, reduced costs of capital, and improved liquidity have all contributed to the decline in underpricing. While it is clear that underpricing has declined significantly over time, further research is needed to understand why some IPOs still exhibit underpricing today and what effect this may have on different investor groups.

Related posts on the SimTrade blog

▶ Louis DETALLE A quick review of the ECM (Equity Capital Market) analyst’s job…

▶ Marie POFF Film analysis: The Wolf of Wall Street

Useful resources

Ljungqvist A. (2004) IPO Underpricing: A Survey, Handbook in corporate finance: empirical corporate finance, Edited by B. Espen Eckbo.

Loughran T. and J. Ritter (2004) Why Has IPO Underpricing Changed over Time? Financial Management, 33(3), 5-37.

Ellul A. and M. Pagano (2006) IPO Underpricing and After-Market Liquidity The Review of Financial Studies, 19(2), 381-421.

About the author

The article was written in January 2023 by Martin VAN DER BORGHT (ESSEC Business School, Master in Finance, 2022-2024).
Market efficiency

Market efficiency

Martin VAN DER BORGHT

In this article, Martin VAN DER BORGHT (ESSEC Business School, Master in Finance, 2022-2024) explains the key financial concept of market efficiency.

What is Market Efficiency?

Market efficiency is an economic concept that states that financial markets are efficient when all relevant information is accurately reflected in the prices of assets. This means that the prices of assts reflect all available information and that no one can consistently outperform the market by trading on the basis of this information. Market efficiency is often measured by the degree to which prices accurately reflect all available information.

The efficient market hypothesis (EMH) states that markets are efficient and that it is impossible to consistently outperform the market by utilizing available information. This means that any attempt to do so will be futile and that all investors can expect to earn the same expected return over time. The EMH is based on the idea that prices are quickly and accurately adjusted to reflect new information, which means that no one can consistently make money by trading on the basis of this information.

Types of Market Efficiency

Following Fama’s academic works, there are three different types of market efficiency: weak, semi-strong, and strong.

Weak form of market efficiency

The weak form of market efficiency states that asset prices reflect all information from past prices and trading volumes. This implies that technical analysis, which is the analysis of past price and volume data to predict future prices, is not an effective way to outperform the market.

Semi-strong form of market efficiency

The semi-strong form of market efficiency states that asset prices reflect all publicly available information, including financial statements, research reports, and news. This implies that fundamental analysis, which is the analysis of a company’s financial statements and other publicly available information to predict future prices, is also not an effective way to outperform the market.

Strong form of market efficiency

Finally, the strong form of market efficiency states that prices reflect all available information, including private information. This means that even insider trading, which is the use of private information to make profitable trades, is not an effective way to outperform the market.

The Grossman-Stiglitz paradox

If financial markets are informationally efficient in the sense they incorporate all relevant information available, then considering this information is useless when making investment decisions in the sense that this information cannot be used to beat the market on the long term. We may wonder how this information can be incorporate in the market prices if no market participants look at information. This is the Grossman-Stiglitz paradox.

Real-Life Examples of Market Efficiency

The efficient market hypothesis has been extensively studied and there are numerous examples of market efficiency in action.

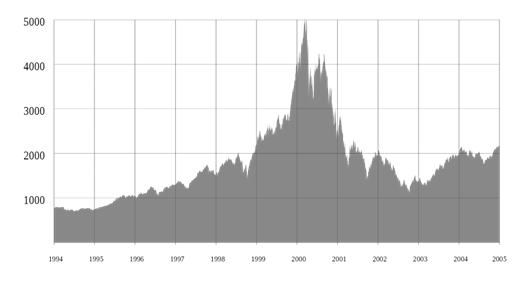
NASDAQ IXIC 1994 – 2005

One of the most famous examples is the dot-com bubble of the late 1990s. During this time, the prices of tech stocks skyrocketed to levels that were far higher than their fundamental values. This irrational exuberance was quickly corrected as the prices of these stocks were quickly adjusted to reflect the true value of the companies.

NASDAQ IXIC Index, 1994-2005

Source: Wikimedia.

The figure “NASDAQ IXIC Index, 1994-2005” shows the Nasdaq Composite Index (IXIC) from 1994 to 2005. During this time period, the IXIC experienced an incredible surge in value, peaking in 2000 before its subsequent decline. This was part of the so-called “dot-com bubble” of the late 1990s and early 2000s, when investors were optimistic about the potential for internet-based companies to revolutionize the global economy.

The IXIC rose from around 400 in 1994 to a record high of almost 5000 in March 2000. This was largely due to the rapid growth of tech companies such as Amazon and eBay, which attracted huge amounts of investment from venture capitalists. These investments drove up stock prices and created a huge market for initial public offerings (IPOs).

However, this rapid growth was not sustainable, and by the end of 2002 the IXIC had fallen back to around 1300. This was partly due to the bursting of the dot-com bubble, as investors began to realize that many of the companies they had invested in were unprofitable and overvalued. Many of these companies went bankrupt, leading to large losses for their investors.

Overall, the figure “Indice IXIC du NASDAQ, 1994-2005” illustrates the boom and bust cycle of the dot-com bubble, with investors experiencing both incredible gains and huge losses during this period. It serves as a stark reminder of the risks associated with investing in tech stocks. During this period, investors were eager to pour money into internet-based companies in the hopes of achieving huge returns. However, many of these companies were unprofitable, and their stock prices eventually plummeted as investors realized their mistake. This led to large losses for investors, and the bursting of the dot-com bubble.

In addition, this period serves as a reminder of the importance of proper risk management when it comes to investing. While it can be tempting to chase high returns, it is important to remember that investments can go up as well as down. By diversifying your portfolio and taking a long-term approach, you can reduce your risk profile and maximize your chances of achieving successful returns.

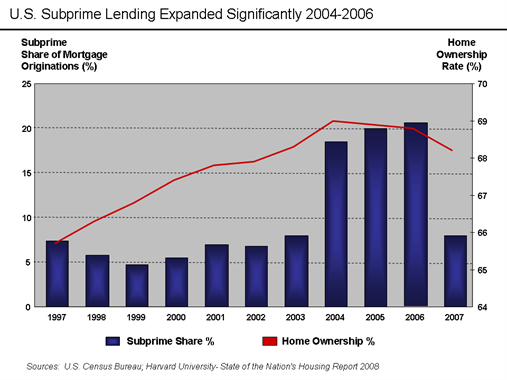
U.S. Subprime lending expanded dramatically 2004–2006.

Another example of market efficiency is the global financial crisis of 2008. During this time, the prices of many securities dropped dramatically as the market quickly priced in the risks associated with rising defaults and falling asset values. The market was able to quickly adjust to the new information and the prices of securities were quickly adjusted to reflect the new reality.

U.S. Subprime Lending Expanded Significantly 2004-2006

Source: US Census Bureau.

The figure “U.S. Subprime lending expanded dramatically 2004–2006” illustrates the extent to which subprime mortgage lending in the United States increased during this period. It shows a dramatic rise in the number of subprime mortgages issued from 2004 to 2006. In 2004, less than $500 billion worth of mortgages were issued that were either subprime or Alt-A loans. By 2006, that figure had risen to over $1 trillion, an increase of more than 100%.

This increase in the number of subprime mortgages being issued was largely driven by lenders taking advantage of relaxed standards and government policies that encouraged home ownership. Lenders began offering mortgages with lower down payments, looser credit checks, and higher loan-to-value ratios. This allowed more people to qualify for mortgages, even if they had poor credit or limited income.

At the same time, low interest rates and a strong economy made it easier for people to take on these loans and still be able to make their payments. As a result, many people took out larger mortgages than they could actually afford, leading to an unsustainable increase in housing prices and eventually a housing bubble.

When the bubble burst, millions of people found themselves unable to make their mortgage payments, and the global financial crisis followed. The dramatic increase in subprime lending seen in this figure is one of the primary factors that led to the 2008 financial crisis and is an illustration of how easily irresponsible lending can lead to devastating consequences.

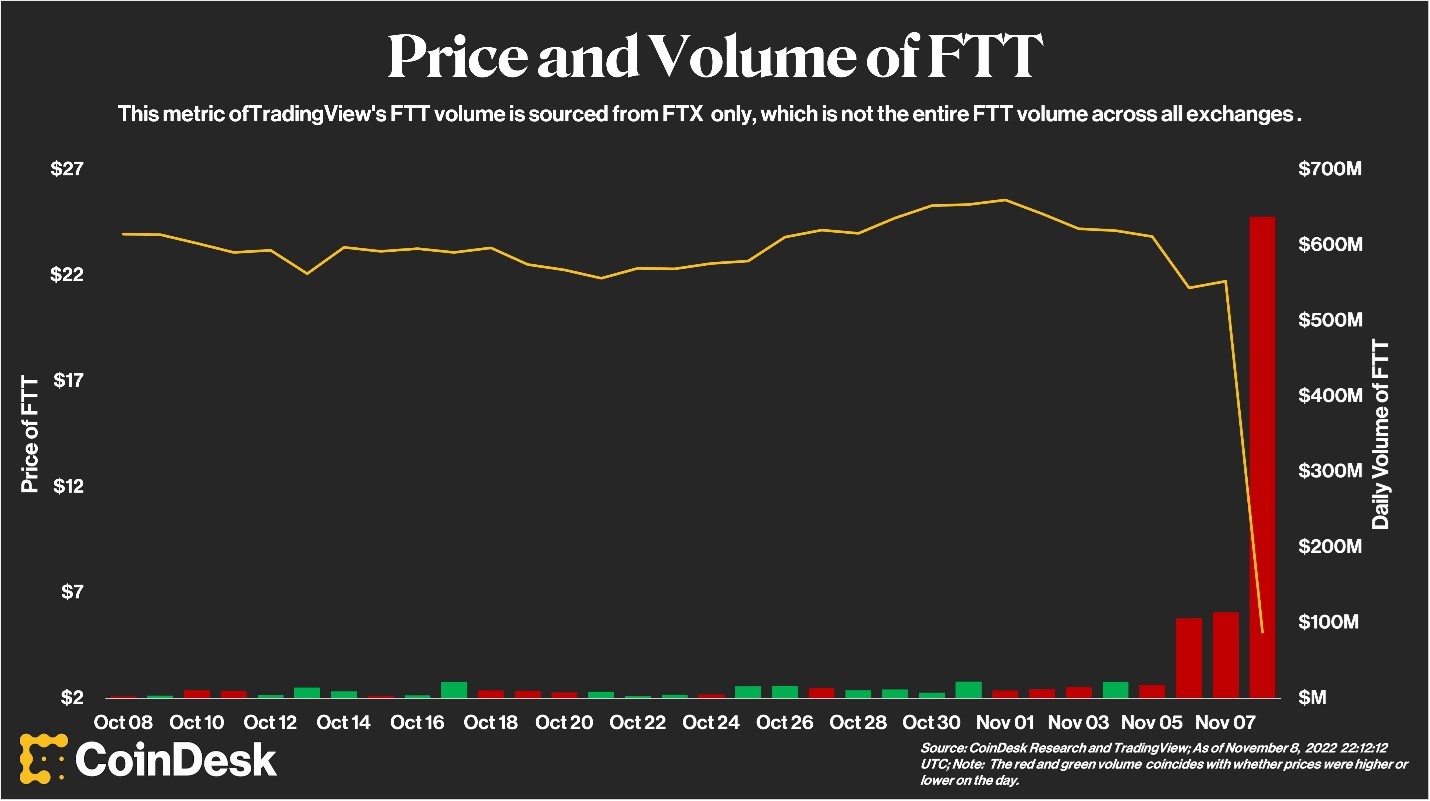
Impact of FTX crash on FTT

Finally, the recent rise (and fall) of the cryptocurrency market is another example of market efficiency. The prices of cryptocurrencies have been highly volatile and have been quickly adjusted to reflect new information. This is due to the fact that the market is highly efficient and is able to quickly adjust to new information.

Price and Volume of FTT

Source: CoinDesk.

FTT price and volume is a chart that shows the impact of the FTX exchange crash on the FTT token price and trading volume. The chart reflects the dramatic drop in FTT’s price and the extreme increase in trading volume that occurred in the days leading up to and following the crash. The FTT price began to decline rapidly several days before the crash, dropping from around $3.60 to around $2.20 in the hours leading up to the crash. Following the crash, the price of FTT fell even further, reaching a low of just under $1.50. This sharp drop can be seen clearly in the chart, which shows the steep downward trajectory of FTT’s price.

The chart also reveals an increase in trading volume prior to and following the crash. This is likely due to traders attempting to buy low and sell high in response to the crash. The trading volume increased dramatically, reaching a peak of almost 20 million FTT tokens traded within 24 hours of the crash. This is significantly higher than the usual daily trading volume of around 1 million FTT tokens.

Overall, this chart provides a clear visual representation of the dramatic impact that the FTX exchange crash had on the FTT token price and trading volume. It serves as a reminder of how quickly markets can move and how volatile they can be, even in seemingly stable assets like cryptocurrencies.

Today, the FTT token price has recovered somewhat since the crash, and currently stands at around $2.50. However, this is still significantly lower than it was prior to the crash. The trading volume of FTT is also much higher than it was before the crash, averaging around 10 million tokens traded per day. This suggests that investors are still wary of the FTT token, and that the market remains volatile.

Conclusion

Market efficiency is an important concept in economics and finance and is based on the idea that prices accurately reflect all available information. There are three types of market efficiency, weak, semi-strong, and strong, and numerous examples of market efficiency in action, such as the dot-com bubble, the global financial crisis, and the recent rise of the cryptocurrency market. As such, it is clear that markets are generally efficient and that it is difficult, if not impossible, to consistently outperform the market.

Related posts on the SimTrade blog

   ▶ All posts related to market efficiency

   ▶ William ANTHONY Peloton’s uphill battle with the world’s return to order

   ▶ Aamey MEHTA Market efficiency: the case study of Yes bank in India

   ▶ Aastha DAS Why is Apple’s new iPhone 14 release line failing in the first few months?

Useful resources

SimTrade course Market information

Academic research

Fama E. (1970) Efficient Capital Markets: A Review of Theory and Empirical Work, Journal of Finance, 25, 383-417.

Fama E. (1991) Efficient Capital Markets: II Journal of Finance, 46, 1575-617.

Grossman S.J. and J.E. Stiglitz (1980) On the Impossibility of Informationally Efficient Markets The American Economic Review, 70, 393-408.

Chicago Booth Review (30/06/2016) Are markets efficient? Debate between Eugene Fama and Richard Thaler (YouTube video)

Business resources

CoinDesk These Four Key Charts Shed Light on the FTX Exchange’s Spectacular Collapse

Bloomberg Crypto Prices Fall Most in Two Weeks Amid FTT and Macro Risks

About the author

The article was written in January 2023 by Martin VAN DER BORGHT (ESSEC Business School, Master in Finance, 2022-2024).
Special Acquisition Purpose Companies (SPAC)

Special Acquisition Purpose Companies (SPAC)

Martin VAN DER BORGHT

In this article, Martin VAN DER BORGHT (ESSEC Business School, Master in Finance, 2022-2024) develops on the SPACs.

What are SPACs

Special purpose acquisition companies (SPACs) are an increasingly popular form of corporate finance for businesses seeking to go public. SPACs are publicly listed entities created with the objective of raising capital through their initial public offering (IPO) and then using that capital to acquire a private operating business. As the popularity of this financing method has grown, so have questions about how SPACs work, their potential risks and rewards, and their implications for investors. This essay will provide an overview of SPAC structures and describe key considerations for investors in evaluating these vehicles.

How are SPACs created

A special purpose acquisition company (SPAC) is created by sponsors who typically have a specific sector or industry focus; they use proceeds from their IPO to acquire target companies within that focus area without conducting the usual due diligence associated with traditional IPOs. The target company is usually identified prior to the IPO taking place; after it does take place, shareholders vote on whether or not they would like to invest in the acquisition target’s stock along with other aspects such as management compensation packages.

The SPAC process

The process begins when sponsors form a shell corporation that issues share via investment banks’ underwriting services; these shares are then offered in an IPO which typically raises between $250 million-$500 million dollars depending on market conditions at time of launch. Sponsors can also raise additional funds through private placements before going public if needed and may even receive additional cash from selling existing assets owned by company founders prior to launching its IPO. This allows them more flexibility in terms of what targets they choose during search process as well as ability transfer ownership over acquired business faster than traditional M&A processes since no need wait secure regulatory approval beforehand. Once enough capital has been raised through IPO/private placement offerings, sponsor team begins searching for suitable candidate(s) purchase using criteria determined ahead time based off desired sector/industry focus outlined earlier mentioned: things like size revenue generated per quarter/yearly periods competitive edge offered current products compared competitors etcetera all come play here when narrowing down list candidates whose acquisitions could potentially help increase value long-term investments made original shareholders..

Advantages of SPACs

Unlike traditional IPOs where companies must fully disclose financial information related past performance future prospects order comply regulations set forth Securities & Exchange Commission (SEC), there far less regulation involved investing SPACs because purchase decisions already being made prior going public stage: meaning only disclose details about target once agreement reached between both parties – though some do provide general information during pre-IPO phase give prospective buyers better idea what expect once deal goes through.. This type of structure helps lower cost associated taking business public since much due diligence already done before opening up share offer investors thus allowing them access higher quality opportunities at fraction price versus those available traditional stock exchange markets. Additionally, because shareholder votes taken into consideration each step way, risk potential fraud reduced since any major irregularities discovered regarding selected targets become transparent common knowledge everyone voting upon proposed change (i.e., keeping board members accountable).

Disadvantages of SPACs

As attractive option investing might seem, there are still certain drawbacks that we should be aware such the high cost involved structuring and launching successful campaigns and the fact that most liquidation events occur within two years after listing date – meaning there is a lot of money spent upfront without guarantee returns back end. Another concern regards transparency: while disclosure requirements are much stricter than those found regular stocks, there is still lack of full disclosure regarding the proposed acquisitions until the deal is finalized making difficult to determine whether a particular venture is worth the risk taken on behalf investor. Lastly, many believe merging different types of businesses together could lead to the disruption of existing industries instead just creating new ones – something worth considering if investing large sums money into particular enterprise.

Examples of SPACs

VPC Impact Acquisition (VPC)

This SPAC was formed in 2020 and is backed by Pershing Square Capital Management, a leading hedge fund. It had an initial funding of $250 million and made three acquisitions. The first acquisition was a majority stake in the outdoor apparel company, Moosejaw, for $280 million. This acquisition was considered a success as Moosejaw saw significant growth in its business after the acquisition, with its e-commerce sales growing over 50% year-over-year (Source: Business Insider). The second acquisition was a majority stake in the lifestyle brand, Hill City, for $170 million, which has also been successful as it has grown its e-commerce and omnichannel businesses (Source: Retail Dive). The third acquisition was a minority stake in Brandless, an e-commerce marketplace for everyday essentials, for $25 million, which was not successful and eventually shut down in 2020 after failing to gain traction in the market (Source: TechCrunch). In conclusion, VPC Impact Acquisition has been successful in two out of three of its acquisitions so far, demonstrating its ability to identify successful investments in the consumer and retail sector.

Social Capital Hedosophia Holdings Corp (IPOE)

This SPAC was formed in 2019 and is backed by Social Capital Hedosophia, a venture capital firm co-founded by famed investor Chamath Palihapitiya. It had an initial funding of $600 million and has made two acquisitions so far. The first acquisition was a majority stake in Virgin Galactic Holdings, Inc. for $800 million, which has been extremely successful as it has become a publicly traded space tourism company and continues to make progress towards its mission of accessible space travel (Source: Virgin Galactic). The second acquisition was a majority stake in Opendoor Technologies, Inc., an online real estate marketplace, for $4.8 billion, which has been successful as the company has seen strong growth in its business since the acquisition (Source: Bloomberg). In conclusion, Social Capital Hedosophia Holdings Corp has been incredibly successful in both of its acquisitions so far, demonstrating its ability to identify promising investments in the technology sector.

Landcadia Holdings II (LCA)

This SPAC was formed in 2020 and is backed by Landcadia Holdings II Inc., a blank check company formed by Jeffery Hildebrand and Tilman Fertitta. It had an initial funding of $300 million and made one acquisition, a majority stake in Waitr Holdings Inc., for $308 million. Unfortunately, this acquisition was not successful and it filed for bankruptcy in 2020 due to overleveraged balance sheet and lack of operational improvements (Source: Reuters). Waitr had previously been a thriving food delivery company but failed to keep up with the rapid growth of competitors such as GrubHub and DoorDash (Source: CNBC). In conclusion, Landcadia Holdings II’s attempt at acquiring Waitr Holdings Inc. was unsuccessful due to market conditions outside of its control, demonstrating that even when a SPAC is backed by experienced investors and has adequate funding, there are still no guarantees of success.

Conclusion

Despite all these drawbacks, Special Purpose Acquisition Companies remain a viable option for entrepreneurs seeking to take advantage of the rising trend toward the digitalization of global markets who otherwise wouldn’t have access to the resources necessary to fund projects themselves. By providing unique opportunity to access higher caliber opportunities, this type of vehicle serves fill gap left behind many start-up ventures unable to compete against larger organizations given the limited financial capacity to operate self-sufficiently. For reasons stated above, it is clear why SPACs continue to gain traction both among investors entrepreneurs alike looking to capitalize quickly on changing economic environment we live today…

Related posts on the SimTrade blog

   ▶ Daksh GARG Rise of SPAC investments as a medium of raising capital

Useful resources

U.S. Securities and Exchange Commission (SEC) Special Purpose Acquisition Companies

U.S. Securities and Exchange Commission (SEC) What are the differences in an IPO, a SPAC, and a direct listing?

U.S. Securities and Exchange Commission (SEC) What You Need to Know About SPACs – Updated Investor Bulletin

PwC Special purpose acquisition companies (SPACs)

Harvard Business Review SPACs: What You Need to Know

Harvard Business Review SPACs: What You Need to Know

Bloomberg

Reuters

About the author

The article was written in January 2023 by Martin VAN DER BORGHT (ESSEC Business School, Master in Finance, 2022-2024).
My experience as an intern in the Corporate Finance department at Maison Chanel

My experience as an intern in the Corporate Finance department at Maison Chanel

Martin VAN DER BORGHT

In this article, Martin VAN DER BORGHT (ESSEC Business School, Master in Finance, 2022-2024) shares his professional experience as a Corporate Finance intern at Maison Chanel.

About the company

Chanel is a French company producing haute couture, as well as ready-to-wear, accessories, perfumes, and various luxury products. It originates from the fashion house created by Coco Chanel in 1910 but is the result of the takeover of Chanel by the company Les Parfums Chanel in 1954.

Chanel logo.
Channel logo
Source: Chanel.

In February 2021, the company opened a new building called le19M.This building was designed to bring together 11 Maisons d’art, the Maison ERES and a multidisciplinary gallery, la Galerie du 19M, under one same roof. Six hundred artisans and experts are gathered in a building offering working conditions favorable to the wellbeing of everyone and to the development of new perspectives at the service of the biggest names in fashion and luxury.

My internship

From September 2021 to February 2022, I was an intern in the Corporate Finance and Internal Control department at Maison Chanel, Paris, France. As part of Manufactures de Mode, subsidiary of Chanel, which aims to serve as support for all the Maisons d’art and Manufactures de Modes, located in le19M building, my internship was articulated around three main missions.

My missions

My first mission was to develop and implement an internal control process worldwide in every entity belonging to the fashion division of Chanel. The idea behind this was to make a single process that could be used in every entity, whatever its size, so all of them have the same, improving the efficiency during internal and external audits.

During the six months of my internship, we focus our development on a particular aspect of internal control that is called “segregation of duties” or SoD. The segregation of duties is the assignment of various steps in a process to different people. The intent behind doing so is to eliminate instances in which someone could engage in theft or other fraudulent activities by having an excessive amount of control over a process. In essence, the physical custody of an asset, the record keeping for it, and the authorization to acquire or dispose of the asset should be split among different people. We developed multiple procedures and matrix to allow the company to check whether their actual processes were at risk or not, with different level of risks, and adjustments proper to each entity.

My second mission was to value each company to test them for goodwill impairment in Chanel SAS consolidation. We use a discounted cash flow (DCF) model to value every company and based on the value determined, we tested the goodwill. Goodwill impairment is an earnings charge that companies record on their income statements after they identify that there is persuasive evidence that the asset associated with the goodwill can no longer demonstrate financial results that were expected from it at the time of its purchase.

Let me take an example. Imagine company X acquire company Y for $100,000 while company Y was valued at $60,000 in fair value. In this situation, the goodwill is $40,000 (=100,000 – 60,000). Now let’s say we are a year later, and the fair value of company Y is calculated as $45,000 while its recoverable amount is $80,000. The carrying amount of the asset and the goodwill (85,000) is now higher than the recoverable amount of the asset (80,000), and this is misleading, so we have to impair the goodwill by $5,000 (85,000 – 80,000) to account for this decrease in value. As the company was acquired at a price higher than the fair value, it is the goodwill that will be impaired of such a loss.

My last mission was a day-to-day exercise by which I had to assist and support each entity in its duties towards Chanel SAS. It could have been everything related to finance or accounting (reporting, valuation, integration post-acquisition, etc.), and sometimes not even related to finance but to the development of these companies (IT, audits, etc.). This last mission allowed me to travel and visit multiple Maisons d’art and Manufactures de modes to help prepared internal and external audits.

Required skills and knowledge

The main requirements for this internship were to be at ease with accounting and financial principle (reporting, consolidation, fiscal integration, valuation, etc.) to be able to communicate with a multitude of employees by writing and talking, and to be perfectly fluent in English as entities are located everywhere.

What I learned

This internship was a great opportunity to learn because it required a complete skillset of knowledge to be able to work at the same time on internal control aspects, financial aspects, accounting aspects, and globally audit aspects. It gave me the possibility to meet a huge number of people, all interesting and knowledgeable, to travel, to learn more about the fashion luxury industry at every stage of the creation process, and to discover how it is to work in a large company operating on a worldwide scale.

Three concepts I applied during my journey

Discounted cash flow (DCF)

Discounted cash flow (DCF) analysis is a valuation method used to estimate the value of an asset or business. It does this by discounting all future cash flows associated with the asset or business back to the present time, so that they have a consistent value in today’s terms. DCF analysis is one of the most commonly used methods for valuing a business and its assets, as it takes into account both current and expected future earnings potential.

The purpose of using DCF analysis is to determine an accurate value for an asset or company in order to make informed decisions about investing in it. The method takes into account all expected future cash flows from operating activities such as sales, expenses, taxes and dividends paid out over time when calculating its intrinsic worth. This allows investors to accurately evaluate how much they should pay for an investment today compared to what it could be worth in the future due to appreciation or other factors that may affect its price at any given moment over time.

The process involves estimating free cash flow (FCF), which includes net income plus non-cash items like depreciation and amortization minus capital expenditures required for day-to-day operations, then discounting this figure back at a rate determined by market conditions such as risk level and interest rates available on similar investments. The resulting number provides investors with both a present value (PV) which reflects what would be earned from holding onto their money without risking any capital gains tax if held long enough; as well as terminal value (TV) which considers what kind of return can be expected after taking into account growth rates for remaining years left on investments being considered.

Since DCF only takes into consideration anticipated figures based off research conducted prior through financial data points, there are certain limitations associated with using this type of calculation when trying to determine fair market values since unexpected events can occur during timespan between now until end date calculated period ends causing prices either rise above estimated figures proposed earlier before end date was reached thus creating higher returns than originally forecasted initially before actual event took place; at same opposite can occur where unforeseen economic downturns could lower prices below predicted projections resulting lower returns than assumed initially prior situation happening firstly. Therefore, while estimates provided via discounted cash flow are helpful tools towards making more informed decisions when considering buying/selling specific assets/companies, ultimately investor should also conduct additional due diligence beyond just relying solely upon these calculations alone before making final decision whether proceed further move ahead not regarding particular opportunities being evaluated currently.

Goodwill impairment is an analysis used to determine the current market value of a company’s intangible assets. It is usually performed when a company has acquired another company or has merged with another entity but can also be done in other situations such as when the fair value of the reporting unit decreases significantly due to market conditions or internal factors. The purpose of goodwill impairment analysis is to ensure that a company’s financial statements accurately reflect its financial position by recognizing any potential losses in intangible asset values associated with poor performance.

When conducting goodwill impairment analysis, companies must first calculate their total identifiable assets and liabilities at fair value less costs associated with disposal (FVLCD). This includes both tangible and intangible assets like trademarks, patents, and customer relationships. Next, they must subtract FVLCD from the acquisition price of the target entity to calculate goodwill. Goodwill represents any excess amount paid for an acquiree above its fair market value which cannot be attributed directly to specific tangible or intangible assets on its balance sheet. If this calculated goodwill amount is greater than zero, then it needs to be tested for potential impairment losses over time.
The most common method used for testing goodwill impairments involves comparing the implied fair value of each reporting unit’s net identifiable asset base (including both tangible and intangible components) against its carrying amount on the balance sheet at that moment in time. Companies may use either a discounted cash flow model or their own proprietary valuation techniques as part of this comparison process which should consider future expected cash flow streams from operations within each reporting unit affected by acquisitions prior years among other inputs including industry trends and macroeconomic factors etcetera where applicable. If there is evidence that suggests that either one would result in lower overall returns than originally anticipated, then it could indicate an impaired asset situation requiring additional accounting adjustments.

Goodwill

In summary, goodwill impairment analysis plays an important role in ensuring accurate accounting practices are followed by companies so that their financial statements accurately reflect current values rather than simply relying on historic acquisition prices which may not necessarily represent present day realities. By taking all relevant information into consideration during these tests, businesses can identify potential issues early on and make necessary changes accordingly without having too much negative impact downstream operations going forward.

Segregation of duties (SoD)

Segregation of duties (SoD) is an important part of any company’s internal control system. It involves the separation and assignment of different tasks to different people within a business, in order to reduce the risk that one person has too much power over critical functions. This segregation helps to ensure accuracy, integrity, and security in all areas.

Segregation of duties can be broken down into two main components: functional segregation and administrative segregation. Functional segregation involves assigning specific responsibilities or tasks to individuals with expertise or knowledge in that area while administrative segregation focuses on preventing an individual from having too much authority over a process or task by dividing those responsibilities among multiple people.

The purpose behind segregating duties is to limit potential risks associated with fraud, errors due to lack of proper supervision, mismanagement, waste, and misuse of resources as well as other potential criminal activities that could lead to loss for the business. Segregation also ensures accountability for everyone’s actions by making sure no single employee has access or control over more than one critical function at any given time: thereby reducing opportunities for mismanagement and manipulation without proper oversight from management personnel. Additionally, it allows businesses better manage their internal processes by providing checks-and-balances between departments; thus, promoting better coordination between them which can be beneficial when dealing with complex procedures such as budgeting cycles or payroll processing, etc.

In conclusion, segregating duties helps businesses reduce risks related not only fraud but also mismanagement, waste, misuse & other criminal activities which may lead businesses losses & create transparency & accountability within departments so they are able coordinate properly & execute operations efficiently. It is therefore an essential component business should consider implementing into their internal controls systems if they wish to ensure their financial stability long run.

Related posts on the SimTrade blog

   ▶ All posts about professional experience

   ▶ Emma LAFARGUE Mon expérience en contrôle de gestion chez Chanel

   ▶ Marie POFF Film analysis: Rogue Trader

   ▶ Louis DETALLE The incredible story of Nick Leeson & the Barings Bank

   ▶ Maite CARNICERO MARTINEZ How to compute the net present value of an investment in Excel

   ▶ William LONGIN How to compute the present value of an asset?

Useful resources

Maison Chanel

le19m

About the author

The article was written in January 2023 by Martin VAN DER BORGHT (ESSEC Business School, Master in Finance, 2022-2024).