In this article, Léopoldine FOUQUES (ESSEC Business School, Global Bachelor of Business Administration, 2017-2021) presents the IRR function in Excel to compute the internal rate of return of a series of cash flows.
About Excel
Excel is by far the most used financial modeling tool across the world to build models and perform analysis. Knowing which Excel function to use can help employees in the financial sector (financial analysts, fund managers, risk managers, traders, etc.) to work faster and build a more powerful model.
The internal rate of return (IRR)
Definition
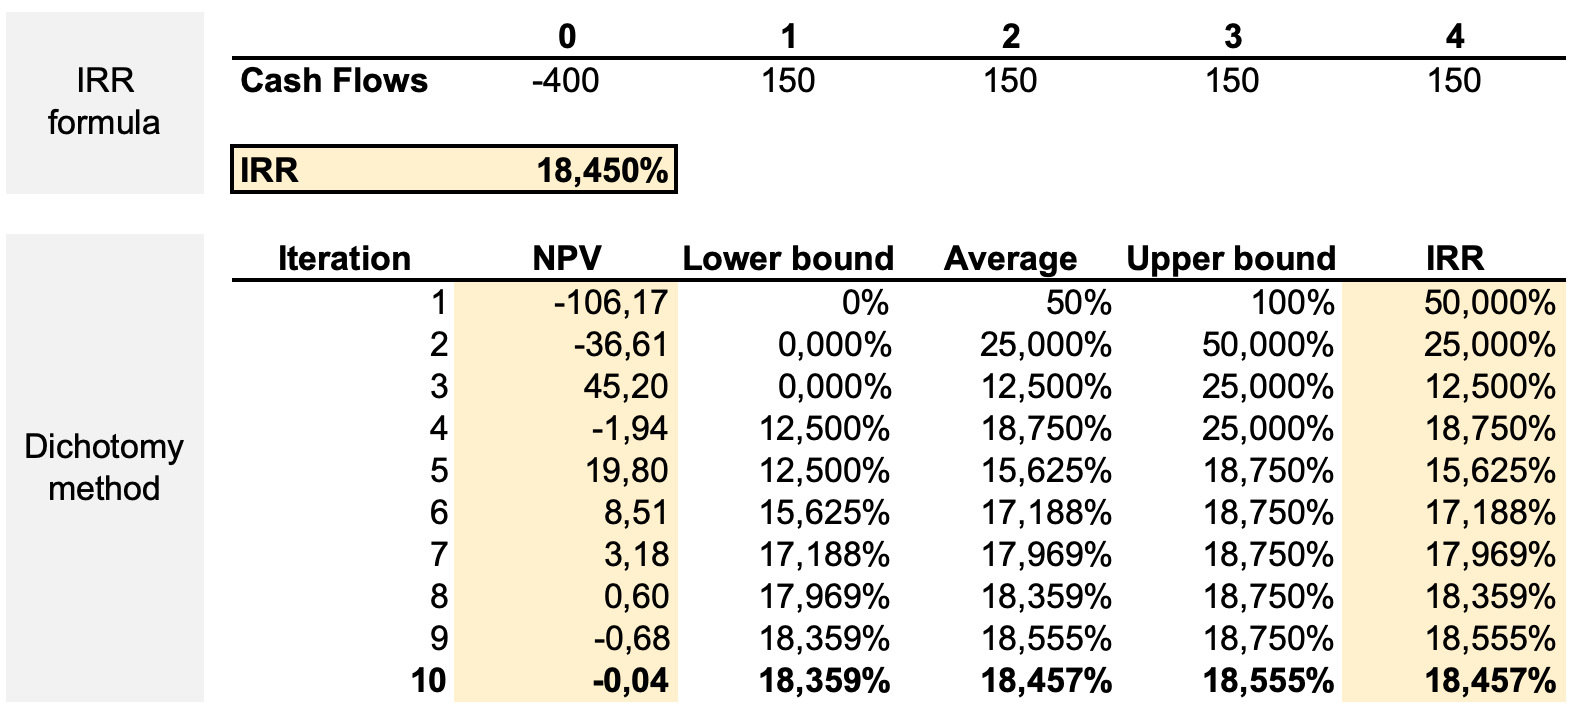
The computation of the internal rate of return (IRR) is based on the net present value (NPV) of an investment. In financial modelling, an investment is represented by a series of cash flows: CF0, CF1, CF2, …, CFT. For a classic investment, the first cash flow, CF0, is negative (outflow) and the future cash flows, CF1, CF2, …, CFT are positive (inflows).
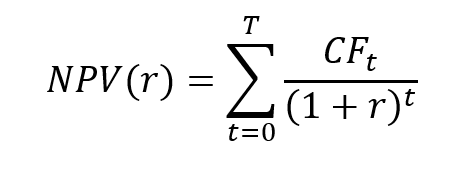
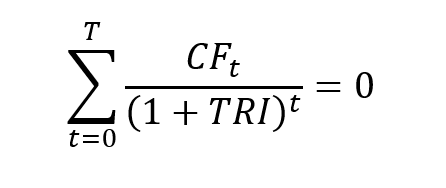
The net present value (NPV) of an investment is computed according to the following formula:
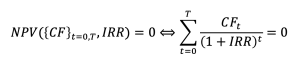
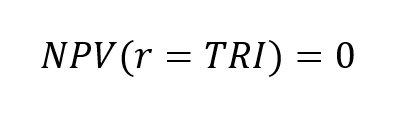
The IRR corresponds to the value of the discount rate for which the NPV is equal to 0:
Use in finance
One of the most important functions is the Internal Rate of Return (IRR) function, as it’s an easy function to compare an investment’s return, based on a series of cash flows.
The function is very useful in financial modeling. Indeed, it’s frequently used to compare scenarios before deciding about a project. An example is when a company is presented with two opportunities: one is investing in a new factory and the second is expanding its existing factory.
By using IRR, we can estimate the IRR for each scenario and verify which one is higher than the average cost of capital of the business (the Weighted Average Cost of Capital or WACC) is a calculation of a firm’s cost of capital in which each category is proportionally weighted).
The Excel functions to compute the IRR
Building a math-based calculation is time-consuming and complicated, so Excel offers three functions for the calculation of the internal rate of return: IRR, MIRR, and XIRR.
The IRR function
The IRR function uses one required argument and one optional:
- The values: they represent the series of cash flows, including net income value and investments.
- The guessed number for the expected internal rate of return. If omitted, the function will default to 0.1 (= 10%).
You can download the Excel file below in which I illustrate the use of the IRR function in Excel based on a simple example.

Note that the use of the IRR function assumes that the period between each cash flow is the same (equal-size payment periods), for example one year.
From the IRR function to the XIRR function
If the period between each cash flow is not the same, the IRR function should not be used. It is the case with monthly cash flows as the months of the year may contain 28, 29, 30 or 31 days.
In this case, the XIRR function comes into play to calculate a correct internal rate of return, taking into consideration the periods of different sizes.
The XIRR function has three arguments:
- The values
- The dates for cash outflows and inflows.
- The guessed number for the expected internal rate of return (optional argument).
You can download the Excel file below in which I illustrate the use of the IRR and XIRR functions in Excel based on a simple example.
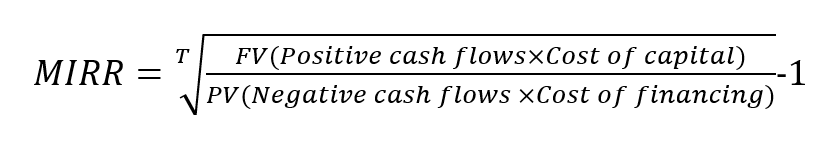
From the IRR function to the MIRR function (Modified Internal Rate of Return)
The MIRR function is quite the same as the IRR function, except that it takes into consideration both the cost of borrowing the initial investment funds (discount rate) and reinvestment rates for future cash flows.
In contrast to IRR, MIRR assumes that cash flows from a project are reinvested at the firm’s cost of capital (rate of return on a portfolio company’s existing securities).
To compute the MIRR, the Excel function uses the following parameters:
- The values
- The guessed number for the expected internal rate of return (optional argument).
- The financial rate: the finance rate of interest paid
- The reinvest rate: the interest rate earned from the reinvested profit
You can download the Excel file below in which I illustrate the use of the IRR and MIRR functions in Excel based on a simple example.
Limits of the IRR
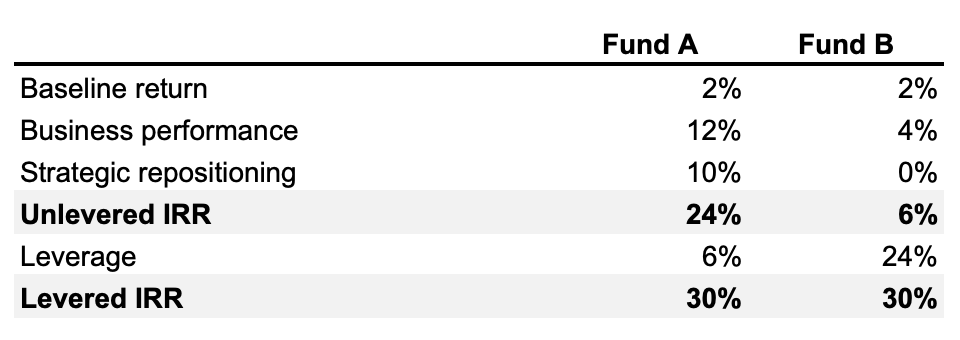
The non-linear equation for obtaining the IRR may have one solution, several solutions or no solution according to the sequence of cash flows. These represent limits of the IRR as an investor would like one value when estimating its investment.
Another limit of the IRR as a decision criterion for investing is that the result is not in agreement with the decision criterion based on NPV, which represents the value created by the investment.
You can download the Excel file below in which I provide an example to illustrate the limit of the IRR when selecting investment when two projects are available.
Related posts on the SimTrade blog
▶ Jérémy PAULEN The IRR function in Excel
▶ Raphaël ROERO DE CORTANZE The Internal Rate of Return
▶ William LONGIN How to compute the present value of an asset?
▶ Sébastien PIAT Simple interest rate and compound interest rate
▶ Georges WAUBERT Bond valuation
Useful resources
Mazars Excel IRR Function And Other Ways To Calculate IRR In Excel
About the author
The article was written in November 2021 by Léopoldine FOUQUES (ESSEC Business School, Global Bachelor of Business Administration, 2017-2021).