In this article, Ian DI MUZIO (ESSEC Business School, Master in Finance (MiF), 2025–2027) explores the economics of leverage in leveraged buyouts (LBOs) from an investment banking perspective.
Rather than treating debt as a purely mechanical input in an Excel model, the article explains—both conceptually and technically—how leverage amplifies equity returns, reshapes risk, affects pricing, and constrains deal execution.
The ambition is to provide junior analysts with a realistic framework they can use when building or reviewing LBO models during internships, assessment centres, or live mandates.
Context and objective
Most students encounter leverage for the first time through a simplified capital structure slide: a bar divided into senior debt, subordinated debt, and equity, followed by a formula showing that higher debt and lower equity mechanically increase the internal rate of return (IRR, the discount rate that sets net present value to zero).
In the abstract, the story appears straightforward. If a company generates stable cash flows, a sponsor can finance a large share of the acquisition with relatively cheap debt, repay that debt over time, and magnify capital gains on a smaller equity cheque.
In reality, this mechanism operates only within a narrow corridor. Too little leverage and the financial sponsor struggles to compete with strategic buyers. Too much leverage and the business becomes fragile: covenants tighten, financial flexibility disappears, and relatively small shocks in performance can wipe out the equity.
The objective of this article is therefore not to restate textbook identities, but to describe how investment bankers think about leverage when advising financial sponsors and corporate sellers, drawing on market practice and transaction experience (see, for example, Kaplan & Strömberg).
The focus is on the interaction between free cash flow generation, debt capacity, pricing, and exit scenarios, and on how analysts should interpret LBO outputs rather than merely producing them.
What an LBO really is
At its core, a leveraged buyout is a change of control transaction in which a financial sponsor acquires a company using a combination of equity and a significant amount of borrowed capital, secured primarily on the target’s own assets and cash flows.
The sponsor is rarely a long-term owner. Instead, it underwrites a finite investment horizon—typically four to seven years—during which value is created through a combination of operational improvement, deleveraging, multiple expansion, and sometimes add-on acquisitions, before exiting via a sale or initial public offering emphasises.
From a financial perspective, an LBO is effectively a structured bet on the spread between the company’s return on invested capital and the cost of debt, adjusted for the speed at which that debt can be repaid using free cash flow.
In other words, leverage only creates value if operating performance is sufficiently strong and stable to service and amortise debt. When performance falls short, the rigidity of the capital structure becomes a source of value destruction rather than enhancement.
How leverage amplifies equity returns
The starting point for understanding leverage is the identity that equity value equals enterprise value minus net debt. If enterprise value remains constant while net debt declines over time, equity value must mechanically increase.
This is the familiar deleveraging effect: as free cash flow is used to repay borrowings, the equity slice of the capital structure expands even if EBITDA growth is modest and exit multiples remain unchanged.
Figure 1 illustrates this mechanism in a stylised LBO. The company is acquired with high initial leverage. Over the holding period, EBITDA grows moderately, but the primary driver of equity value creation is the progressive reduction of net debt.
Figure 1. Evolution of capital structure in a simple LBO.
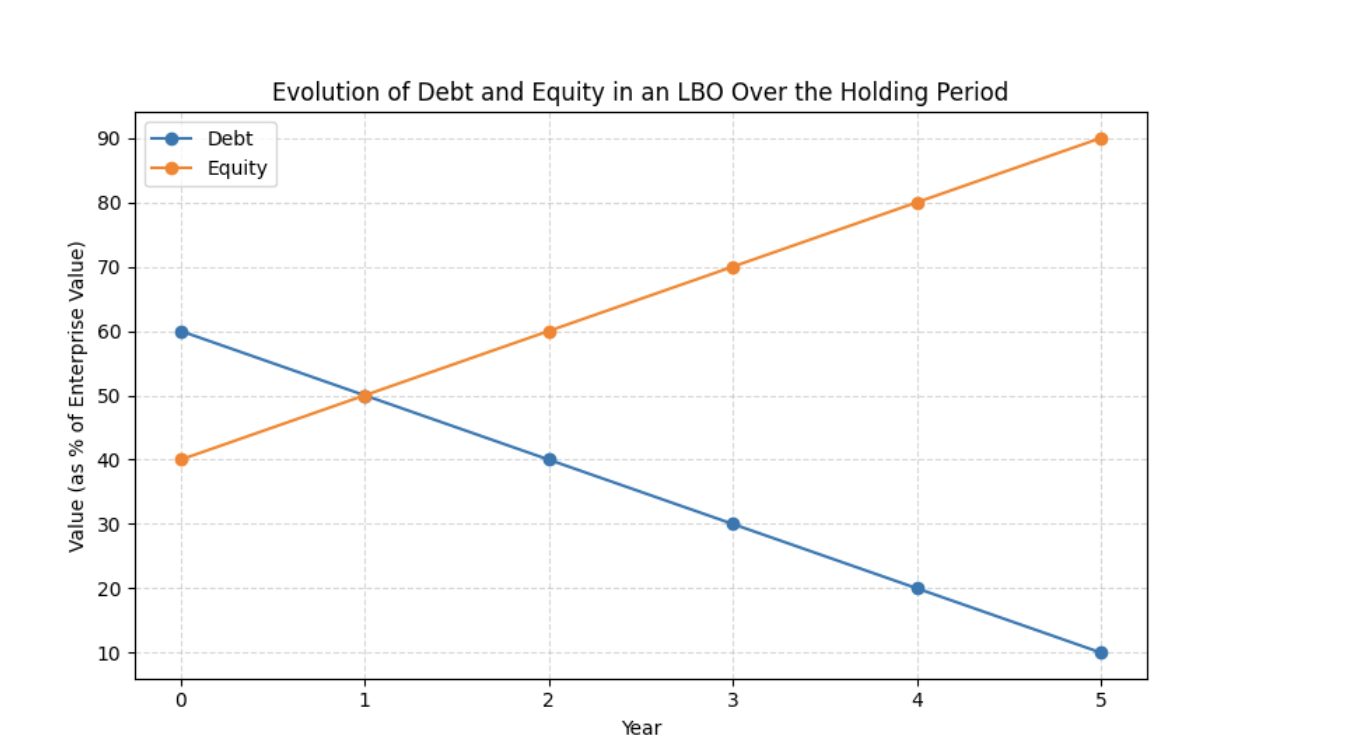
Source: the author.
Figure 1 illustrates the evolution of capital structure in a simple LBO. Debt is repaid using free cash flow, causing the equity portion of enterprise value to increase even if valuation multiples remain unchanged.
To enhance transparency and pedagogical value, the Excel model used to generate Figure 1—allowing readers to adjust leverage, cash flow, and amortisation assumptions—can be made available alongside this article.
This dynamic explains why LBO IRRs can appear attractive even with limited operational growth. It also highlights the fragility of highly levered structures: when EBITDA underperforms or exit multiples contract, equity value erodes rapidly because the initial leverage leaves little margin for error.
Debt capacity and the role of free cash flow
For investment bankers, the key practical question is not “how much leverage maximises IRR in Excel?” but “how much leverage can the business sustainably support without breaching covenants or undermining strategic flexibility?”.
This shifts the focus from headline EBITDA to the quality, predictability, and cyclicality of free cash flow. In an LBO context, free cash flow is typically defined as EBITDA minus cash taxes, capital expenditure, and changes in working capital, adjusted for recurring non-operating items.
A business with recurring revenues, limited capex requirements, and stable working capital can support materially higher leverage than a cyclical, capital-intensive company, even if both report similar EBITDA today.
Debt capacity is assessed using leverage and coverage metrics such as net debt to EBITDA, interest coverage, and fixed-charge coverage, tested under downside scenarios rather than a single base case. Lenders focus not only on entry ratios, but on how those ratios behave when EBITDA compresses or capital needs spike.
Pricing, entry multiples, and the leverage trade-off
Leverage interacts with pricing in a non-linear way. At a given entry multiple, higher leverage reduces the equity cheque and tends to increase IRR, provided exit conditions are favourable.
However, aggressive leverage also constrains bidding capacity. Lenders rarely support structures far outside market norms, which means sponsors cannot indefinitely substitute leverage for price. In competitive auctions, sponsors must choose whether to compete through valuation or capital structure, knowing that both dimensions feed directly into risk.
Figure 2 presents a stylised sensitivity of equity IRR to entry multiple and starting leverage, holding exit assumptions constant.
Figure 2. Sensitivity of equity IRR to entry valuation and starting leverage.
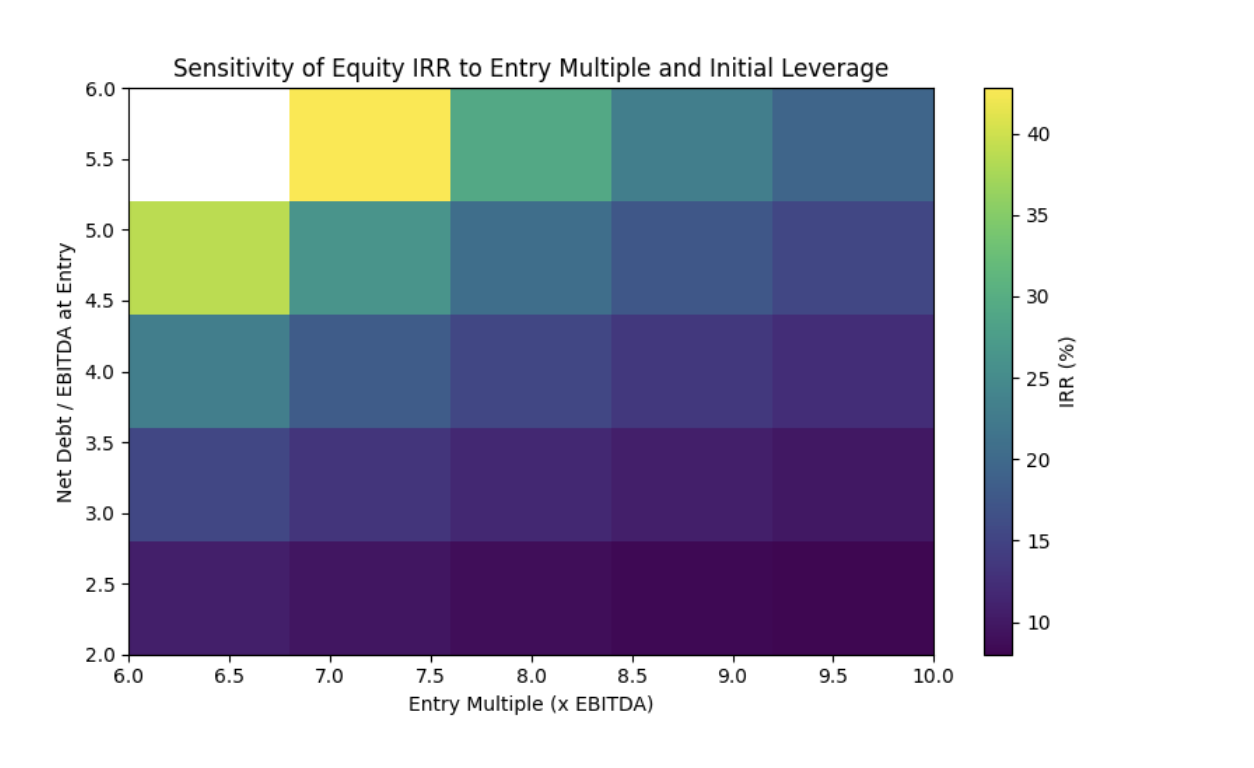
Source: the author.
Figure 2 illustrates the sensitivity of equity IRR to entry valuation and starting leverage. Outside a moderate corridor, IRR becomes highly sensitive to small changes in operating or exit assumptions.
Providing the Excel file behind Figure 2 would allow readers to stress-test entry pricing and leverage assumptions interactively.
Risk, scenarios, and the distribution of outcomes
A mature view of leverage focuses on the full distribution of outcomes rather than a single base case. Downside scenarios quickly reveal how leverage concentrates risk: when performance weakens, equity absorbs losses first.
Figure 3 illustrates how higher leverage increases expected IRR but also widens dispersion, creating both a fatter upside tail and a higher probability of capital loss.
Figure 3. Distribution of equity returns under low, moderate, and high leverage.
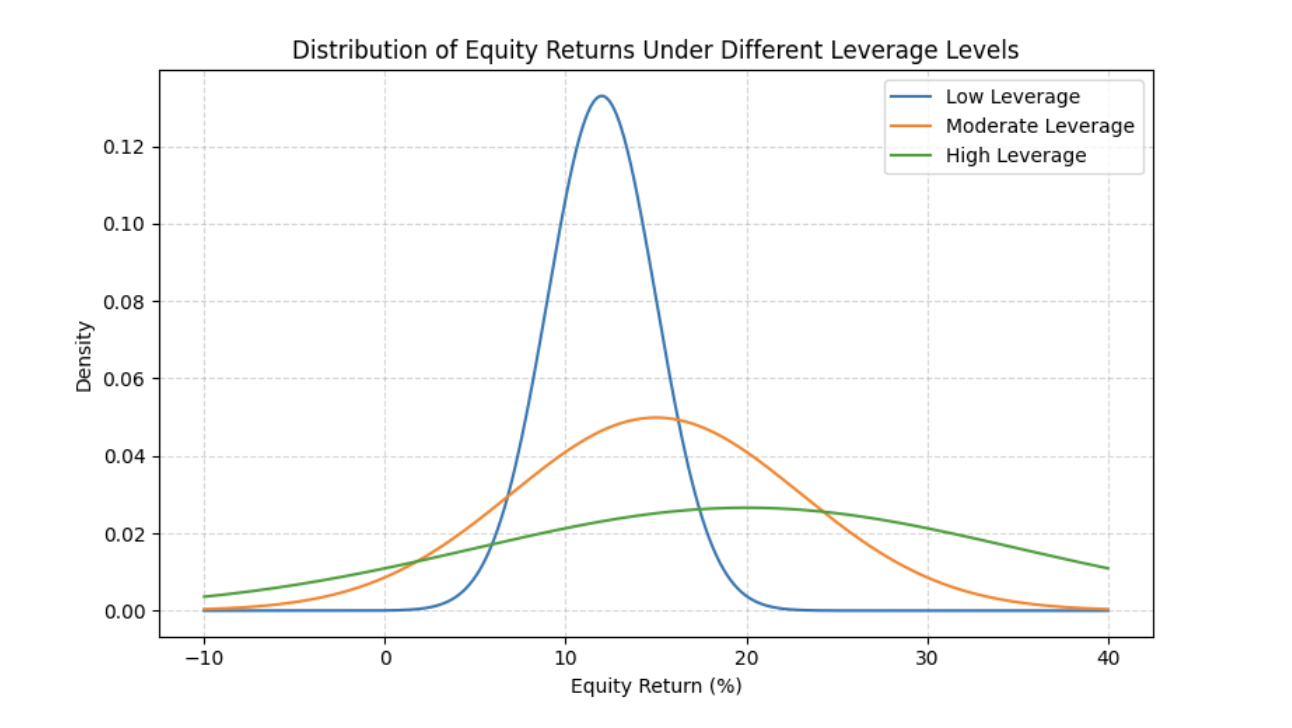
Source: the author.
Higher leverage raises expected returns but materially increases downside risk.
For junior bankers, the key lesson is that leverage is a design choice with consequences. A robust analysis interrogates downside resilience, covenant headroom, and the coherence between capital structure and strategy.
The role of investment banks
Investment banks play a central role in structuring and advising on leverage. On buy-side mandates, they assist sponsors in negotiating financing packages and ensuring proposed leverage aligns with market appetite. On sell-side mandates, they help sellers compare bids not only on price, but on financing certainty and execution risk.
Conclusion
Leverage sits at the heart of LBO economics, but its effects are often oversimplified. For analysts, the real skill lies in linking model outputs to a coherent economic narrative about cash flows, debt service, and downside resilience.
Related posts on the SimTrade blog
▶ Alexandre VERLET Classic brain teasers from real-life interviews
▶ Emanuele BAROLI Interest Rates and M&A: How Market Dynamics Shift When Rates Rise or Fall
▶ Bijal GANDHI Interest Rates
Useful resources
Academic references
Fama, E. F., & MacBeth, J. D. (1973). Risk, Return, and Equilibrium: Empirical Tests. Journal of Political Economy, 81(3), 607–636.
Koller, T., Goedhart, M., & Wessels, D. (2020). Valuation: Measuring and Managing the Value of Companies (7th ed.). Hoboken, NJ: John Wiley & Sons.
Axelson, U., Jenkinson, T., Strömberg, P., & Weisbach, M. S. (2013). Borrow Cheap, Buy High? The Determinants of Leverage and Pricing in Buyouts. The Journal of Finance, 68(6), 2223–2267.
Kaplan, S. N., & Strömberg, P. (2009). Leveraged Buyouts and Private Equity. Journal of Economic Perspectives, 23(1), 121–146.
Gompers, P. A., & Lerner, J. (1996). The Use of Covenants: An Empirical Analysis of Venture Partnership Agreements. Journal of Law and Economics, 39(2), 463–498.
Business data
About the author
The article was written in January 2026 by Ian DI MUZIO (ESSEC Business School, Master in Finance (MiF), 2025–2027).
▶ Read all posts written by Ian DI MUZIO