Valuing the Delisting of Best World International Using DCF Modeling

Samuel BRAL

In this article, Samuel BRAL (ESSEC Business School, Global BBA – Exchange at NUS, 2025) shares how he conducted a valuation of Best World International using a Discounted Cash Flow model in Excel. This modeling exercise was part of a corporate finance case during his exchange at the National University of Singapore.

Context of the project

During my exchange at NUS, I was asked to evaluate the fair price at which Best World International, a Singaporean skincare and wellness company, could be taken private. The company had announced its intention to delist from the Singapore Exchange (SGX). My role was to determine the intrinsic value per share using a discounted cash flow approach that distinguishes between a high-growth projection period and a long-term steady-state phase. The goal was to assess whether the proposed buyout price was fair to minority shareholders.

Understanding the DCF method

The Discounted Cash Flow method estimates the value of a company by forecasting its future free cash flows and discounting them back to their present value using the firm’s Weighted Average Cost of Capital. This method is widely used by investment banks, private equity firms, and corporate finance teams for valuing companies, especially in the context of M&A and privatizations.

Well-known examples of its application include the valuation of Twitter during its acquisition by Elon Musk in 2022 and the fairness opinions issued by investment banks in LBO transactions such as the Bain Capital acquisition of Kioxia.

Step-by-step technical implementation

The Excel model followed a two-stage DCF approach: an explicit forecast period from 2024 to 2028 and a terminal value from 2029 onward. Below is a breakdown of the modeling process:

1. Revenue Forecasting

I projected revenue growth using a blended approach. I considered:

  • The average historical CAGR of BWI’s revenues between 2021 and 2023.
  • The expected CAGR for the ASEAN cosmetics and wellness industry (7–9%) based on Statista and Euromonitor data.

Revenue = Previous Year Revenue × (1 + Growth Rate)

2. EBIT Estimation

I calculated EBIT by projecting the cost structure of the business:

  • I took historical averages of cost items such as COGS and SG&A as a percentage of revenue.
  • Assumed that operating leverage would allow fixed costs to grow slower than revenue, improving margins over time.

EBIT = Revenue – Operating Costs

3. Tax Adjustment and NOPAT

I applied a normalized effective tax rate based on BWI’s historical tax filings and Singapore’s corporate tax regime (17%).

NOPAT = EBIT × (1 – Tax Rate)

4. Depreciation and CAPEX

I assumed CAPEX as a stable % of revenue, using 2023 data as the benchmark. Depreciation was projected using the historical ratio of D&A to CAPEX.

Free Cash Flow = NOPAT + Depreciation – CAPEX – ΔWorking Capital

5. Net Working Capital (NWC)

NWC = Current Assets – Current Liabilities. I used the average NWC-to-revenue ratio from past years to forecast changes in NWC.

6. Terminal Value and Discounting

The Terminal Value, which captures the value of a business beyond the explicit forecast period in a DCF analysis – often 5 or 10 years into the future. was calculated using the Gordon Growth formula:

TV = FCF_2028 × (1 + g) / (WACC – g)

Where g was estimated at 2.5%, reflecting long-term GDP and sector growth rates in the ASEAN region.

Both FCFs and Terminal Value were discounted using WACC (5.55%). The present values were then summed to calculate Enterprise Value.

7. Equity Value per Share

Enterprise Value – Net Debt + Cash = Equity Value

Equity Value / Number of Shares = Value per Share

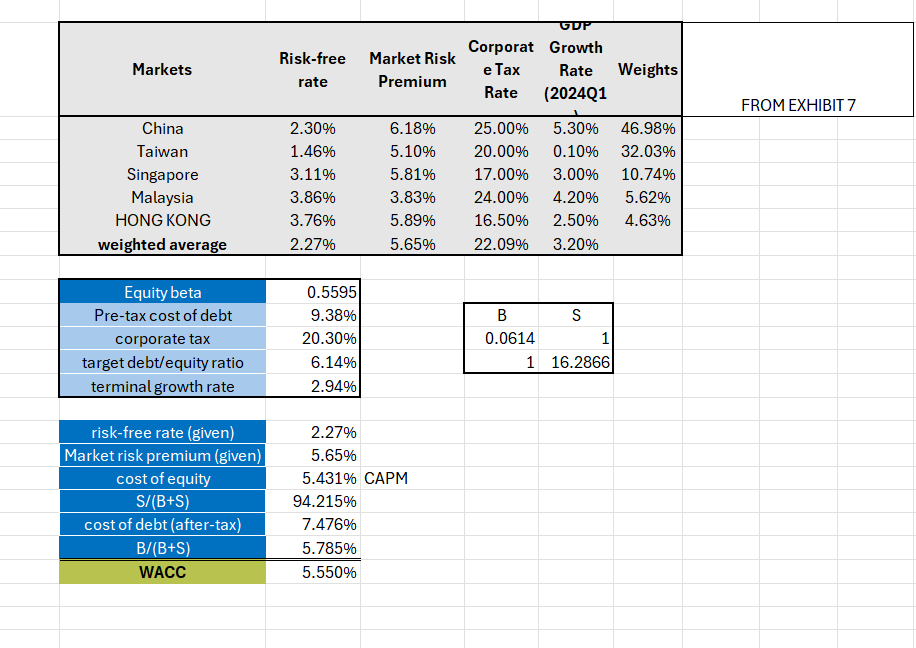
WACC and Beta calculation

WACC reflects the average cost of capital from both equity and debt, weighted by their proportions in the firm’s capital structure, it serves as the discount rate for projecting future cash flows. For companies like BWI, which operate in niche, consumer-focused markets, WACC provides a benchmark for evaluating whether future growth justifies current valuations

  • Cost of equity was derived using the Capital Asset Pricing Model (CAPM):
  • Cost of Equity = Risk-Free Rate + Beta × Market Risk Premium
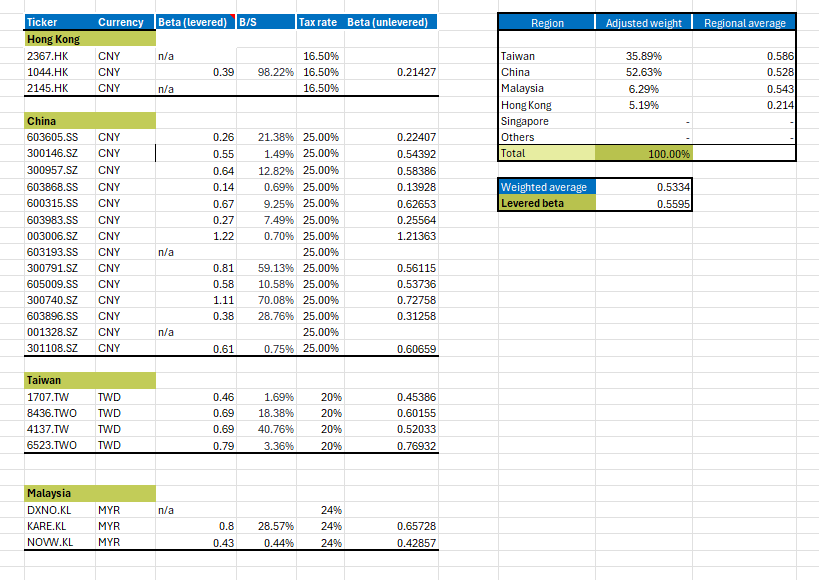
  • Beta was computed by unlevering and relevering betas of comparable firms in China, Taiwan, and Malaysia. This accounts for business and financial risk.
  • Cost of debt was based on comparable bond yields and company-specific risks.
  • Capital structure weights were based on BWI’s most recent financial statements.

The photos below are showing how I proceeded

WACC Computation

Beta Computation

Key results and analysis

The model output was:

  • Enterprise Value = SGD 4.8 billion
  • Equity Value = SGD 4.18 billion
  • Intrinsic Value per Share = SGD 9.72 (vs. proposed delisting price of SGD 7.00)

This suggests that the buyout offer undervalued the company by more than 30%. This raised questions of fairness for minority shareholders, echoing similar cases in Asia such as the privatization of Wing Tai Holdings or the delisting of Global Logistic Properties.

Download the Excel file

If you want to access a part of my work on the projections and DCF, click the link below:

Download the Excel file for WACC and Beta analysis

Why should I be interested in this post?

This modeling project not only strengthened my technical finance skills but also helped me think critically about shareholder rights, valuation fairness, and the role of financial modeling in defending minority interests. Mastering the DCF approach is essential for anyone pursuing investment banking, private equity, or corporate strategy roles.

Related posts on the SimTrade blog

   ▶All posts about Technical techniques

   ▶ Andrea ALOSCARI Valuation Methods

   ▶ Yann-Ray KAMANOU TAWAMBA Understanding the Discount Rate: A Key Concept in Finance

   ▶ William LONGIN How to compute the present value of an asset?

   ▶ Andrea ALOSCARI Internship: Corporate & Investment Banking (Intesa Sanpaolo)

Useful resources

SimTrade Platform

Monetary Authority of Singapore

About the author

This article was written in September 2025 by Samuel BRAL (ESSEC Business School, Global Bachelor in Business Administration – Exchange at NUS).

Forecasting Airline Route Profitability with Monte Carlo Simulation

Samuel BRAL

In this article, Samuel BRAL (ESSEC Business School, Global BBA – Exchange at NUS, 2025) explains how he applied Monte Carlo simulations to support Emirates Airlines in evaluating the profitability of launching a new long-haul route under conditions of uncertainty.

Context of the project

This project was part of the course “Decision Analytics using Spreadsheets” at the National University of Singapore (NUS). I was asked to provide a quantitative recommendation to Emirates Airlines on selecting a new international route from Dubai. The available destination options included Buenos Aires, Tokyo, Cape Town, and Cairo.

Due to the complexity of airline operations and the uncertainty surrounding factors such as demand, ticket prices, no-show rates, and operating costs, a traditional static financial model would not be sufficient. Instead, I built a Monte Carlo simulation model to capture the dynamic range of possible outcomes and assess the risk-return profile of each destination.

What is a Monte Carlo simulation?

A Monte Carlo simulation is a mathematical technique used to estimate the probability distribution of outcomes when there is uncertainty in the input variables. By running thousands of simulations using random values generated from defined probability distributions, the method provides insights into the range, likelihood, and volatility of potential results.

This approach is commonly used in financial modeling, risk analysis, and engineering. For example, investment banks use Monte Carlo models to simulate portfolio returns and Value at Risk (VaR), while oil and gas companies apply them to forecast drilling success and production volumes.

Simulation approach and methodology

I built a simulation model in Excel that executed 2,000 trials per route. Each trial simulated a potential outcome based on randomly generated values for key variables. The profit was calculated using the following formula:

Profit = (Tickets Sold × Ticket Price) – Operating Costs – Compensation Costs

Here is how each component was modeled:

  • Passenger demand: Modeled as a normal distribution using historical demand averages and standard deviations for each route. For example, Tokyo exhibited more stable demand, while Buenos Aires showed higher variance due to geopolitical and economic volatility in Argentina.
  • Ticket price: Ticket prices were generated using NORM.INV(RAND(), mean, stdev) to account for fluctuations caused by competitive pricing, seasonal variation, and macroeconomic factors like fuel costs and currency movements.
  • No-show rate: Modeled with a uniform distribution between 5% and 10%, based on IATA statistics and academic studies on airline overbooking behavior (source: IATA Global Passenger Survey, 2023).
  • Aircraft assignment: Simulated using a discrete probability distribution based on the actual Emirates fleet composition (e.g., A380, Boeing 777). Larger aircraft allowed more passengers but incurred higher operating costs.
  • Compensation cost: Incurred when demand exceeded seat capacity, reflecting the cost of rebooking, refunds, and customer service. These costs were calibrated using Emirates’ historical compensation data for overbooking cases (source: Emirates Annual Report 2023).

To execute the simulations, I used Excel’s Data Table function to loop through trials and capture the output profit distribution for each destination. From this distribution, I calculated:

  • Expected profit (mean)
  • Standard deviation of profit (volatility)
  • Probability of a loss (profit < 0)
  • Probability of a significant loss (loss > SGD 100,000)

Key results and insights

The simulation identified Buenos Aires as the most profitable option with an expected profit of SGD 292,247 and a 99.65% chance of profitability. However, the route also exhibited a small 0.1% risk of incurring losses above SGD 100,000 due to volatile demand and long travel distance.

Cape Town, while less profitable, offered near-zero downside risk. Tokyo had moderate returns and relatively low variance. This reflects a classic risk-return tradeoff that airlines often face: should the company pursue high-reward but volatile destinations, or opt for stable but lower-margin routes?

Additionally, I tested various overbooking strategies. An overbooking rate of 9.3% was found to optimize expected profits while keeping the cost of passenger compensation within an acceptable range. This mirrors real-world practices, where carriers like Delta and Lufthansa use algorithmic overbooking based on historical no-show patterns to maximize seat utilization (source: MIT Airline Data Project). If you want to have access to the work, here is the Excel file on the overview of all routes as well as the work for Buenos Aires.

Download the Excel file for Monte Carlo simulation

Why should I be interested in this post?

This project demonstrates how Monte Carlo simulations transform business decision-making under uncertainty. Instead of relying on single-point forecasts, the model enabled me to quantify risk, test strategic decisions (like overbooking), and provide data-driven recommendations.

For students and professionals in finance, consulting, or operations, Monte Carlo simulation is a core technique for scenario planning and risk assessment. It enhances decision quality in fields as diverse as project finance, asset management, supply chain optimization, and policy modeling.

Related posts on the SimTrade blog

   ▶All posts about Technical Subjects

   ▶Professional experience: Head of Data Modelling

   ▶Professional experience: Business Data Analyst at Tikehau Capital

Useful resources

SimTrade Platform

IATA Global Passenger Survey 2023

Emirates Annual Report and Press Releases

MIT Airline Data Project

About the author

This post was written in September 2025 by Samuel BRAL (ESSEC Business School, Global Bachelor in Business Administration – Exchange at NUS).

My internship experience as a Financial Controller at Talan

Samuel BRAL

In this article, Samuel BRAL (ESSEC Business School, Global Bachelor in Business Administration (GBBA), 2022-2026) shares his professional experience as Assistant Financial Controller at Talan.

About the company

Talan is a French consulting and IT services firm that supports large organizations in their digital transformation. Founded in 2002, the group now operates in over 15 countries with more than 5,000 employees. Its activities cover business consulting, data & AI, transformation management, and IT systems integration.

The company has experienced rapid growth in recent years, reaching €600 million in revenue in 2023. Talan’s value proposition lies in combining business understanding with technical expertise to create tailored, high-impact solutions.

Logo of Talan.
Logo of Talan
Source: the company.

I worked within the Group FP&A (Financial Planning & Analysis) department at the Paris headquarters. This central team oversees the performance monitoring and financial reporting for all business units (BU), directly supporting the CFO and COMEX.

My internship

My missions

During my internship at Talan, my missions focused on supporting financial reporting, tool optimization, and performance monitoring across Talan’s international business units. My first responsibility was to assist in producing monthly management reports and P&L statements for each business unit. To do so, I extracted and reconciled financial data from systems such as Kimble, Jedox, and SuccessFactors. I created detailed revenue and margin reports used by the CFO and COMEX during monthly performance reviews. In one instance, I was tasked with explaining a sudden drop in margin for the Iberia BU, which led me to identify under-reported subcontractor costs and propose adjustments that improved margin accuracy by 15%.

In parallel, I was assigned to enhance and maintain our internal reporting tools. I updated Power BI dashboards to reflect changes in budget KPIs, created dynamic filters to allow managers to track performance by project or team, and integrated new reporting metrics requested by HR. A concrete example includes building a resource utilization dashboard that tracked billable vs. non-billable hours across 20+ consultants. This became a key element in weekly performance meetings.

I also contributed to the improvement of the Jedox budgeting model by testing input logic and spotting misalignments between operational forecasts and financial planning. My test case simulation revealed a recurring mismatch between headcount forecasts in SuccessFactors and budgeted salaries in Jedox, this insight helped improve the accuracy of HR cost planning. Lastly, I supported daily project performance follow-up. I maintained Excel trackers for monitoring project delivery rates, billing status, and work-in-progress (WIP). In one project, I flagged €1.2 million in delayed invoices at our UK subsidiary and proposed a process with the project manager and billing team to correct invoice triggers and reduce WIP exposure the following month.

Required skills and knowledge

This internship demanded both technical and soft skills. Technically, I had to master Excel (pivot tables, advanced formulas), Power BI, and become comfortable with integrated tools like Jedox, Kimble, and SuccessFactors. A solid understanding of accounting principles and management control basics was essential to analyze P&Ls and challenge budget assumptions.

But beyond tools and numbers, what really made a difference was my ability to adapt quickly, communicate clearly, and collaborate with different teams: from business unit managers to the finance department. I learned how to handle pressure during closing periods and gained confidence in presenting insights to senior stakeholders.

What I learned

This experience allowed me to apply classroom knowledge to real-world challenges. I saw how data, when properly structured and analyzed, can support strategic decision-making. I also learned the importance of data reliability, reconciling figures between systems and ensuring consistency across dashboards was a daily concern. Finally, I came out of the internship with a clearer picture of what FP&A means in practice: it’s not just about reporting, but about driving performance.

Financial concepts related to my internship

I present below three financial concepts related to my internship: variance analysis, working capital, and margin optimization.

Variance Analysis

Variance analysis was at the heart of my role. Each month, we compared actual figures with the budget and previous year (N-1) to explain key deviations in revenue, costs, and margins. This involved discussions with business unit heads to understand operational reasons behind the numbers: new project delays, staffing issues, or cost overruns. It’s a fundamental tool for financial control and performance steering.

Working Capital

Although I didn’t manage working capital directly, I learned how crucial it is in project-based firms like Talan. Delays in project billing or collection can quickly impact cash flow. Some of our dashboards tracked project completion status vs. invoicing, helping identify WIP (Work in Progress) accumulation. It gave me a concrete view of how accounting flows translate into liquidity risks.

Margin Optimization

One of our KPIs was project margin, calculated using resource allocation, billing rates (TJM), and direct costs. I worked on visualizing these margins in Power BI and exploring scenarios with the team. For example, we modelled the impact of raising the average billing rate or optimizing staffing on low-yield projects. This showed me how financial insight directly supports business decisions.

Why should I be interested in this post?

If you’re an ESSEC student interested in corporate finance, FP&A is a great field to explore. This internship gave me exposure to reporting, performance analysis, budgeting, and tools like Power BI and Jedox. It’s also a great entry point to understand how strategy and operations connect through numbers.

Related posts on the SimTrade blog

   ▶ All posts about Professional experiences

Useful resources

Talan website

Microsoft Power BI

Jedox EPM platform

About the author

The article was written in September 2025 by Samuel BRAL (ESSEC Business School, Global Bachelor in Business Administration, 2022–2026).