In this article, Samuel BRAL (ESSEC Business School, Global BBA – Exchange at NUS, 2025) shares how he conducted a valuation of Best World International using a Discounted Cash Flow model in Excel. This modeling exercise was part of a corporate finance case during his exchange at the National University of Singapore.
Context of the project
During my exchange at NUS, I was asked to evaluate the fair price at which Best World International, a Singaporean skincare and wellness company, could be taken private. The company had announced its intention to delist from the Singapore Exchange (SGX). My role was to determine the intrinsic value per share using a discounted cash flow approach that distinguishes between a high-growth projection period and a long-term steady-state phase. The goal was to assess whether the proposed buyout price was fair to minority shareholders.
Understanding the DCF method
The Discounted Cash Flow method estimates the value of a company by forecasting its future free cash flows and discounting them back to their present value using the firm’s Weighted Average Cost of Capital. This method is widely used by investment banks, private equity firms, and corporate finance teams for valuing companies, especially in the context of M&A and privatizations.
Well-known examples of its application include the valuation of Twitter during its acquisition by Elon Musk in 2022 and the fairness opinions issued by investment banks in LBO transactions such as the Bain Capital acquisition of Kioxia.
Step-by-step technical implementation
The Excel model followed a two-stage DCF approach: an explicit forecast period from 2024 to 2028 and a terminal value from 2029 onward. Below is a breakdown of the modeling process:
1. Revenue Forecasting
I projected revenue growth using a blended approach. I considered:
- The average historical CAGR of BWI’s revenues between 2021 and 2023.
- The expected CAGR for the ASEAN cosmetics and wellness industry (7–9%) based on Statista and Euromonitor data.
Revenue = Previous Year Revenue × (1 + Growth Rate)
2. EBIT Estimation
I calculated EBIT by projecting the cost structure of the business:
- I took historical averages of cost items such as COGS and SG&A as a percentage of revenue.
- Assumed that operating leverage would allow fixed costs to grow slower than revenue, improving margins over time.
EBIT = Revenue – Operating Costs
3. Tax Adjustment and NOPAT
I applied a normalized effective tax rate based on BWI’s historical tax filings and Singapore’s corporate tax regime (17%).
NOPAT = EBIT × (1 – Tax Rate)
4. Depreciation and CAPEX
I assumed CAPEX as a stable % of revenue, using 2023 data as the benchmark. Depreciation was projected using the historical ratio of D&A to CAPEX.
Free Cash Flow = NOPAT + Depreciation – CAPEX – ΔWorking Capital
5. Net Working Capital (NWC)
NWC = Current Assets – Current Liabilities. I used the average NWC-to-revenue ratio from past years to forecast changes in NWC.
6. Terminal Value and Discounting
The Terminal Value, which captures the value of a business beyond the explicit forecast period in a DCF analysis – often 5 or 10 years into the future. was calculated using the Gordon Growth formula:
TV = FCF_2028 × (1 + g) / (WACC – g)
Where g was estimated at 2.5%, reflecting long-term GDP and sector growth rates in the ASEAN region.
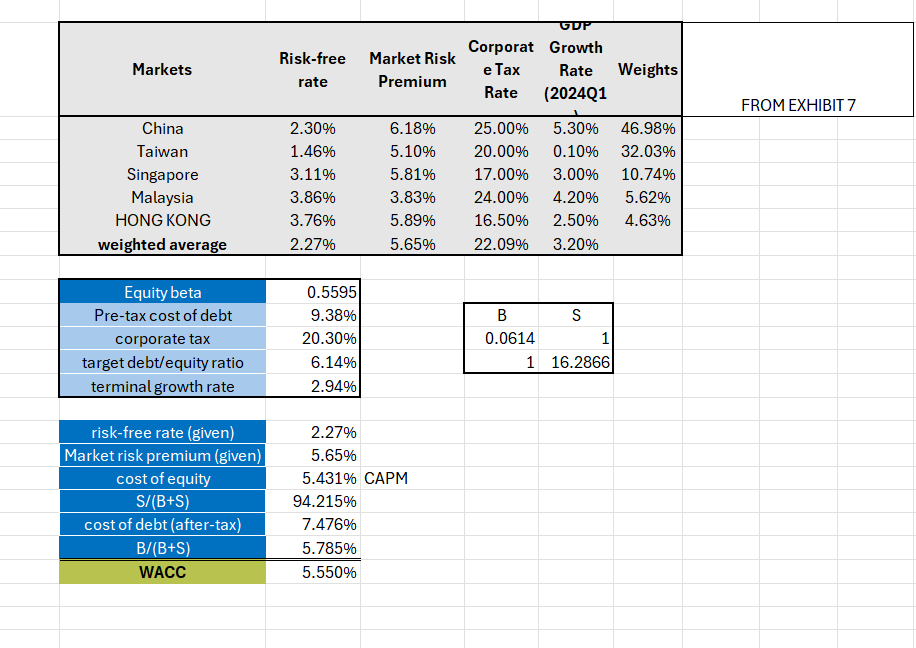
Both FCFs and Terminal Value were discounted using WACC (5.55%). The present values were then summed to calculate Enterprise Value.
7. Equity Value per Share
Enterprise Value – Net Debt + Cash = Equity Value
Equity Value / Number of Shares = Value per Share
WACC and Beta calculation
WACC reflects the average cost of capital from both equity and debt, weighted by their proportions in the firm’s capital structure, it serves as the discount rate for projecting future cash flows. For companies like BWI, which operate in niche, consumer-focused markets, WACC provides a benchmark for evaluating whether future growth justifies current valuations
- Cost of equity was derived using the Capital Asset Pricing Model (CAPM):
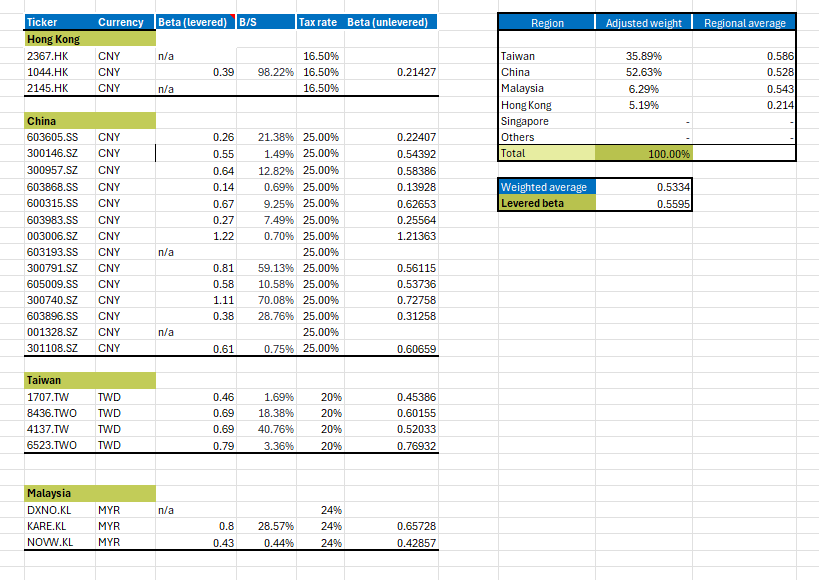
- Beta was computed by unlevering and relevering betas of comparable firms in China, Taiwan, and Malaysia. This accounts for business and financial risk.
- Cost of debt was based on comparable bond yields and company-specific risks.
- Capital structure weights were based on BWI’s most recent financial statements.
Cost of Equity = Risk-Free Rate + Beta × Market Risk Premium
The photos below are showing how I proceeded


Key results and analysis
The model output was:
- Enterprise Value = SGD 4.8 billion
- Equity Value = SGD 4.18 billion
- Intrinsic Value per Share = SGD 9.72 (vs. proposed delisting price of SGD 7.00)
This suggests that the buyout offer undervalued the company by more than 30%. This raised questions of fairness for minority shareholders, echoing similar cases in Asia such as the privatization of Wing Tai Holdings or the delisting of Global Logistic Properties.
Download the Excel file
If you want to access a part of my work on the projections and DCF, click the link below:
This modeling project not only strengthened my technical finance skills but also helped me think critically about shareholder rights, valuation fairness, and the role of financial modeling in defending minority interests. Mastering the DCF approach is essential for anyone pursuing investment banking, private equity, or corporate strategy roles. ▶All posts about Technical techniques ▶ Andrea ALOSCARI Valuation Methods ▶ Yann-Ray KAMANOU TAWAMBA Understanding the Discount Rate: A Key Concept in Finance ▶ William LONGIN How to compute the present value of an asset? ▶ Andrea ALOSCARI Internship: Corporate & Investment Banking (Intesa Sanpaolo) Monetary Authority of Singapore This article was written in September 2025 by Samuel BRAL (ESSEC Business School, Global Bachelor in Business Administration – Exchange at NUS). ▶ Read all posts written by Samuel BRAL
Why should I be interested in this post?
Related posts on the SimTrade blog
Useful resources
About the author
