Modeling of the crude oil price

Modeling of the crude oil price

Youssef LOURAOUI

In this article, Youssef LOURAOUI (Bayes Business School, MSc. Energy, Trade & Finance, 2021-2022) models the market price of the crude oil.

This article is structured as follows: we introduce the crude oil market. Then, we present the mathematical foundations of Geometric Brownian Motion (GBM) model. We use this model to simulate the price of crude oil.

The crude oil market

The crude oil market represents the physical (cash or spot) and paper (futures) market where buyers and sellers acquire oil.

Nowadays, the global economy is heavily reliant on fossil fuels such as crude oil, and the desire for these resources frequently causes political upheaval due to the fact that a few nations possess the greatest reservoirs. The price and profitability of crude oil are significantly impacted by supply and demand, like in any sector. The top oil producers in the world are the United States, Saudi Arabia, and Russia. With a production rate of 18.87 million barrels per day, the United States leads the list. Saudi Arabia, which will produce 10.84 million barrels per day in 2022 and own 17% of the world’s proved petroleum reserves, will come in second. Over 85% of its export revenue and 50% of its GDP are derived from the oil and gas industry. In 2022, Russia produced 10.77 million barrels every day. West Siberia and the Urals-Volga area contain the majority of the nation’s reserves. 10% of the oil produced worldwide comes from Russia.

Throughout the late nineteenth and early twentieth centuries, the United States was one of the world’s largest oil producers, and U.S. corporations developed the technology to convert oil into usable goods such as gasoline. U.S. oil output declined significantly throughout the middle and latter decades of the 20th century, and the country began to import energy. Nonetheless, crude oil net imports in 2021 were at their second-lowest yearly level since 1985. Its principal supplier was the Organization of the Petroleum Exporting Countries (OPEC), created in 1960, which consisted of the world’s largest (by volume) holders of crude oil and natural gas reserves.

As a result, the OPEC nations wielded considerable economic power in regulating supply, and hence price, of oil in the late twentieth century. In the early twenty-first century, the advent of new technology—particularly hydro-fracturing, or fracking—created a second U.S. energy boom, significantly reducing OPEC’s prominence and influence.

Oil spot contracts and futures contracts are the two forms of oil contracts that investors can exchange. To the individual investor, oil can be a speculative asset, a portfolio diversifier, or a hedge for existing positions.

Spot contract

The spot contract price indicates the current market price for oil, while the futures contract price shows the price that buyers are ready to pay for oil on a delivery date established in the future.

Most commodity contracts bought and sold on the spot market take effect immediately: money is exchanged, and the purchaser accepts delivery of the commodities. In the case of oil, the desire for immediate delivery vs future delivery is limited, owing to the practicalities of delivering oil.

Futures contract

An oil futures contract is an agreement to buy or sell a specified number of barrels of oil at a predetermined price on a predetermined date. When futures are acquired, a deal is struck between buyer and seller and secured by a margin payment equal to a percentage of the contract’s entire value. The futures price is no guarantee that oil will be at that price on that date in the future market. It is just the price that oil buyers and sellers anticipate at the time. The exact price of oil on that date is determined by a variety of factors impacting the supply and demand. Futures contracts are more frequently employed by traders and investors because investors do not intend to take any delivery of commodities at all.

End-users of oil buy on the market to lock in a price; investors buy futures to speculate on what the price will be in the future, and they earn if they estimate correctly. They typically liquidate or roll over their futures assets before having to take delivery. There are two major oil contracts that are closely observed by oil market participants: 1) West Texas Intermediate (WTI) crude, which trades on the New York Mercantile Exchange, serves as the North American oil futures benchmark (NYMEX); 2) North Sea Brent Crude, which trades on the Intercontinental Exchange, is the benchmark throughout Europe, Africa, and the Middle East (ICE). While the two contracts move in tandem, WTI is more sensitive to American economic developments, while Brent is more sensitive to those in other countries.

Mathematical foundations of the Geometric Brownian Motion (GBM) model

The concept of Brownian motion is associated with the contribution of Robert Brown (1828). More formally, the first works of Brown were used by the French mathematician Louis Bachelier (1900) applied to asset price forecast, which prepared the ground of modern quantitative finance. Price fluctuations observed over a short period, according to Bachelier’s theory, are independent of the current price as well as the historical behaviour of price movements. He deduced that the random behaviour of prices can be represented by a normal distribution by combining his assumptions with the Central Limit Theorem. This resulted in the development of the Random Walk Hypothesis, also known as the Random Walk Theory in modern finance. A random walk is a statistical phenomenon in which stock prices fluctuate at random. We implement a quantitative framework in a spreadsheet based on the Geometric Brownian Motion (GBM) model. Mathematically, we can derive the price of crude oil via the following model:

img_SimTrade_GBM_equation_2

where dS represents the price change in continuous time dt, dX the Wiener process representing the random part, and Μdt the deterministic part.

The probability distribution function of the future price is a log-normal distribution when the price dynamics is described with a geometric Brownian motion.

Modelling crude oil market prices

Market prices

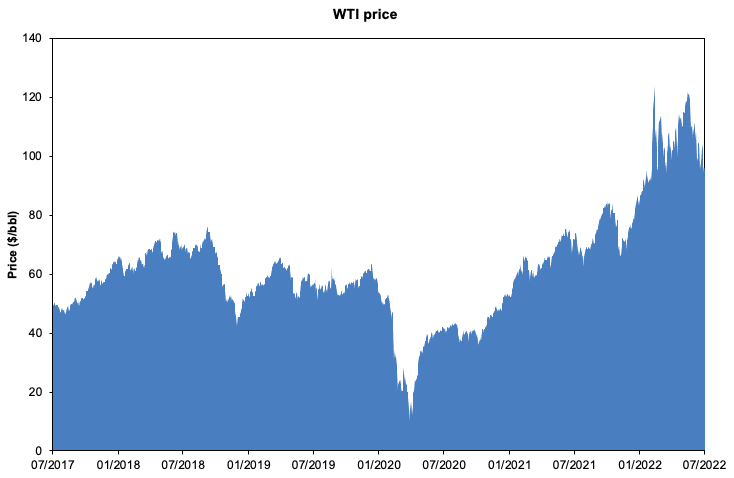
We downloaded a time series for WTI from June 2017 to June 2022. We picked this timeframe to assess the behavior of crude oil during two main market events that impacted its price: Covid-19 pandemic and the war in Ukraine.

The two main parameters to compute in order to implement the model are the (historical) average return and the (historical) volatility. We eliminated outliers (the negative price of oil) to clean the dataset and obtain better results. The historical average return is 11.99% (annual return) and the historical volatility is 59.29%. Figure 1 helps to capture the behavior of the WTI price over the period from June 2017 to June 2022.

Figure 1. Crude oil (WTI) price.
img_SimTrade_WTI_price
Source: computation by the author (data: Refinitiv Eikon).

Market returns

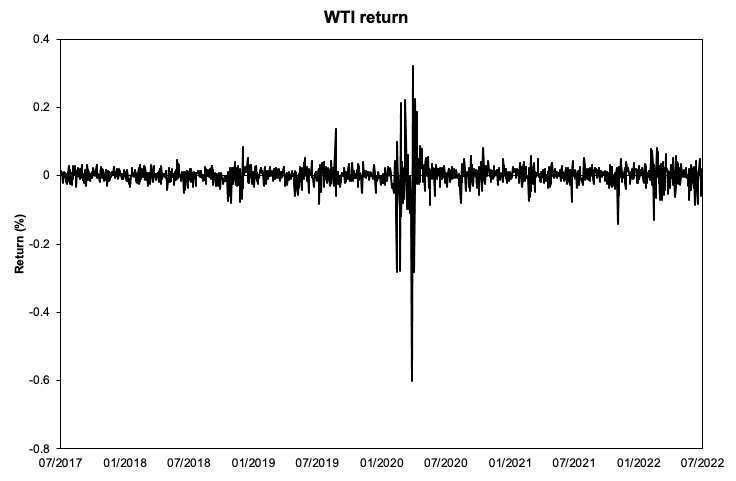
Figure 2 represents the returns of crude oil (WTI) over the period. We can clearly see that the impact of the Covid-19 pandemic had important implications for the negative returns in during the period covering early 2020.

Figure 2. Crude oil (WTI) return.
img_SimTrade_WTI_return
Source: computation by the author (data: Refinitiv Eikon).

We compute the returns using the log returns approach.

img_SimTrade_log_return_WTI

where Pt represents the closing price at time t.

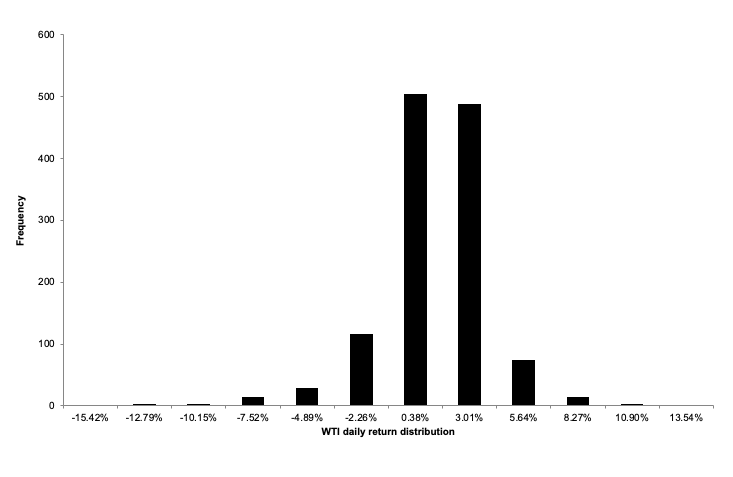
Figure 3 captures the distribution of the crude oil (WTI) daily returns in a histogram. As seen in the plot, the returns are skewed towards the negative tail of the distribution and show some peaks in the center of the distribution. When analyzed in conjunction, we can infer that the crude oil daily returns doesn’t follow the normal distribution.

Figure 3. Histogram of crude oil (WTI) daily returns.img_SimTrade_WTI_histogramSource: computation by the author (data: Refinitiv Eikon).
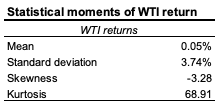
To have a better understanding of the crude oil behavior across the 1257 trading days retained for the period of analysis, it is interesting to run a statistical analysis of the four moments of the crude oil time series: the mean (average return), standard deviation (volatility), skewness (symmetry of the distribution), kurtosis (tail of the distribution). As captured by Table 1, crude oil performed positively over the period covered delivering a daily return equivalent to 0.05% (13.38% annualized return) for a daily degree of volatility equivalent to 3.74% (or 59.33% annualized). In terms of skewness, we can see that the distribution of crude oil return is highly negatively skewed, which implies that the negative tail of the distribution is longer than the right-hand tail (positive returns). Regarding the high positive kurtosis, we can conclude that the crude oil return distribution is more peaked with a narrow distribution around the center and show more tails than the normal distribution.

Table 1. Statistical moments of the crude oil (WTI) daily returns.
 WTI statistical moment
Source: computation by the author (data: Refinitiv Eikon).

Application: simulation of future prices for the crude oil market

Understanding the evolution of the price of crude oil can be significant for pricing purposes. Some models (such as the Black-Scholes option pricing model) rely heavily on a price input and can be sensitive to this parameter. Therefore, accurate price estimation is at the core of important pricing models and thus having a good estimate of spot and future price can have a significant impact in the accuracy of the pricing implemented profitability of the trade.

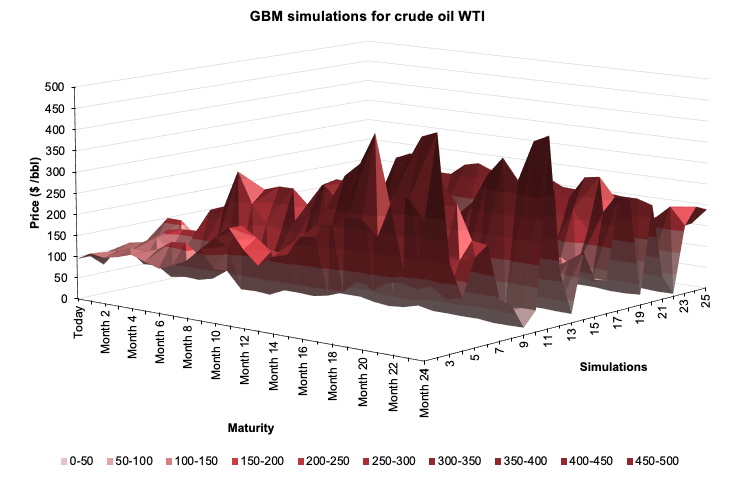
We implement this framework and use a Monte Carlo simulation of 25 iterations to capture the different path that the WTI price can take over a period of 24 months. Figure 4 captures the result of the model. We plot the simulations in a 3D-graph to grasp the shape of the variations in each maturity. As seen from Figure 4, price peaked at the longer end of the maturity at a level near the 250$/bbl. Overall the shape is bumpy, with some local spikes achieved throughout the whole sample and across all the maturities (Figure 4).

Figure 4. Geometric Brownian Motion (GBM) simulations for WTI. WTI GBM simulationSource: computation by the author (Data: Refinitiv Eikon).
You can find below the Excel spreadsheet that complements the explanations about of this article.

 GBM_simulation_framework

Related posts on the SimTrade blog

   ▶ Youssef LOURAOUI My experience as an Oil Analyst at an oil and energy trading company

   ▶ Jayati WALIA Brownian Motion in Finance

   ▶ Youssef LOURAOUI Introduction to Hedge Funds

   ▶ Youssef LOURAOUI Global macro strategy

   ▶ Youssef LOURAOUI Portfolio

Useful resources

Academic research

Bachelier, Louis (1900). Théorie de la Spéculation, Annales Scientifique de l’École Normale Supérieure, 3e série, tome 17, 21-86.

Bashiri Behmiri, Niaz and Pires Manso, José Ramos, Crude Oil Price Forecasting Techniques: A Comprehensive Review of Literature (June 6, 2013). SSRN Reseach Journal.

Brown, Robert (1828), “A brief account of microscopical observations made on the particles contained in the pollen of plants” in Philosophical Magazine 4:161-173.

About the author

The article was written in January 2023 by Youssef LOURAOUI (Bayes Business School, MSc. Energy, Trade & Finance, 2021-2022).

My experience as an Oil Analyst at an oil and energy trading company

Youssef_Louraoui

In this article, Youssef LOURAOUI (Bayes Business School, MSc. Energy, Trade & Finance, 2021-2022) shares his experience as an oil market analyst during a summer internship at Petroineos Trading Ltd.

About the company

Petroineos is a joint venture between PetroChina International London (PCIL) and the INEOS Group for refining and energy trading. PetroChina is one of the world’s major oil and gas enterprises and the INEOS is a refining and petrochemical group. This joint venture is a young and ambitious firm that was founded in 2011 with a dynamic approach to business and a strong ambition for long-term success.

In Petroineos, there are three sections which handle trading in different products: crude, refined products, and power and emissions. Petroineos’s annual trading volume exceeds 70 million tonnes, with assets worth around $6 billion and trading revenue in excess of $30 billion (Figure 1).

Its strategically positioned refineries in Grangemouth (Scotland) and Lavera (France), is among the oldest crude oil refineries in Europe. It provides gasoline to both domestic (Scotland and
France) and international markets, while also sustaining local economies. Every year, the two refineries process about 360,000 barrels of crude oil per day and create over 16 million tonnes of oil products.

Figure 1. Petroineos Trading Ltd. key numbers.
 Petroineos Trading Ltd. numbers
Source: Petroineos Trading Ltd. (2022)

My internship

I was affected along with seven other interns, each with their own specific project that had to be completed throughout the 12-week internship. The first days were intense because we had to deal with jargon, practitioners’ concepts, and the dynamic nature of the trading floor. Fortunately, I had the opportunity to be supervised by a seasoned analyst during the first month of the internship, which allowed me step up my skills and be up and running for the next two months. There was a healthy mix of autonomous work and fruitful discussions with the other colleagues. This forced me to be independent in my job while also working in groups when required, allowing for some flexibility in how I performed.

The highlight of this internship was the relationships created with my fellow interns. It really helped a lot to make this experience so enjoyable. The teamwork, the feedbacks, the help that was offered among interns was really amazing; it created a strong bond inside and outside the office. It was a blessing to meet and learn from them as they are all well accomplished individuals who have a bright future in front of them.

By the end of my internship, I felt that I improved significantly in terms of notions regarding crude oil market, time management, relationships with my colleagues and good memories overall.

Missions

During this internship, I was assigned to the analysis department, which was in charge of providing reports and market updates for the major commodity markets. I did my internship in extraordinary times for the oil and commodity markets as it was a few months after the beginning of the Ukrainian-Russian conflict. At that time, the world was experiencing a global energy crisis, a shock of extraordinary scope and complexity. This crisis reminded us of the events of the 1970s (Oil shocks 73-79). This crisis had many dimensions, including coal, oil, gas, food security, and climate change. Governments around the world are seeking for an equilibrium that would deliver a good energy mix while retaining affordable and secure resources for their people, not only reducing reliance on a single commodity.

Natural gas spot prices had reached unprecedented highs, the equivalent of USD 250 for a barrel of oil. Furthermore, the crisis had fueled inflationary pressures and raised the prospect of a recession, as well as a massive USD 2 trillion windfall for fossil fuel producers above their 2021 net revenue. In response to energy shortages and high costs, governments have invested well over USD 500 billion, primarily in industrialized nations, to protect consumers from the immediate consequences of inflation (especially in gas and oil).

Keeping this in mind, I was assigned coverage on the impact of Western sanctions on the Russian crude oil market. Every market participant seeked to predict the impact of the sanctions on the number of barrels shipped from Russia.

  • Is Russia going to reduce its crude oil export since Europe represented alone more than 80% of its exports volume before the war?
  • Who are the new market players that are profiting from this situation and capitalizing on a discounted Russian crude oil in the international crude oil market?
  • Are there any patterns that can help in better understanding the crude flows?

Those three questions captured the importance of the analysis that had to be conducted in order to give sound and well detailed answers in order to capitalize with trading strategies that could leverage this information.

The main task was the redaction of the report which was shared across the whole company. The basic idea of this report was to give a micro overview on a weekly basis on the main changes that can impact the Urals market. I was in charge of analysing the vessels movement from the main ports in Russia and capture their discharging patterns in order to extract valuable information into the main discharging regions that are profiting from this market.

I also collaborated on other analyses with another intern from the Data Science department, which involved analyzing alternative data to identify any interesting signals that may be used as a trading strategy. In addition, I shared two further quantitative analyses involving econometric relationships to analyze Russian and global oil demand in analysis to other factors of relevance. The projects were incredibly interesting, and the insights were also helpful in understanding the complexities of collecting insights in an environment where analysts are surrounded by noisy data that must be filtered in order to communicate valuable information.

The main conclusions of the Russian coverage:

India and China as the main actors profiting from the discounted price of Urals

Russia becomes the highest exporter of crude oil to India (Urals crude). The pattern change since the war unfolded. Historically, India imported oil from Irak and Saudi Arabia. This interest is based on the decision by the Asian countries to capitalise on a devaluated Russian oil price in the international crude oil market, which reached at some point of the war 30$/bbl difference with the main international oil benchmark (Brent). According to the Indian energy minister, they want to lock in the best price available in the international crude oil market (Figure 1).

According to US treasury Janet Yellen, this trend will continue, profiting from the western price cap on russian crude oil. G7 countries agreed in September to implement the price cap, which the US government hopes will be in place by December 5 when an EU embargo on the shipment of Russian crude comes into force. Under the mechanism, European companies will be permitted to transport and insure shipments of Russian oil to third countries as long as it is sold below a fixed price — an effort to limit the impact of the sanctions on global oil flows but ensure Russia’s earns less from the trade.

Dislocation of the market between Europe and Asia

Europe decreased importantly its dependence from Russian crude oil after the war in Ukraine. There is a shifting of actors in this market, with Asia skyrocketing demand compared to previous years because of the attractivity of the Urals in the international crude oil market. Also, if we shrink oil price volatility to its components, we see that:

  • External factors, other than supply and demand, play a more important role now specifically policy issues are more important than ever, accounting for more than 25% of oil volatility
  • 20 years ago we could explain 90% of oil volatility by supply and demand, now this rate dropped to 65%.

Required skills

I would mention two main skills: market understanding and programming expertise. It is very beneficial to stay on top of market news, as it is good industry practice (especially for an analyst position) to understand the many market events that affect the specific commodity covered. As most businesses strive for automation, acquiring and mastering a programming language can only benefit future analysts. It has become a wider pre-requirement for most analyst positions.

Key learning

Key numbers

Some key numbers to have in mind to understand the crude oil market:

  • Estimation according to a reliable source: 1.43 trillion barrels left in the ground (2022)
  • Estimated part of oil consumption in most developed economies (around 30-45% of crude oil in the energy mix)
  • Estimated daily production per day in the world: around 100mb/d
  • Russia produce approximately 10% of the world daily crude oil demand. Urals production (the most traded grade of crude in the Russian oil market) was fluctuating on average around the 2mb/d threshold

Refinery margins

Refinery margin is derived from the difference between the refinery cost (buying crude) and the profit (selling refined product).

Refinery margin and crack spread

Crack spread represents the differential between the price of crude oil and the price of products refined. It is an industry specific metric to assess refining profitability. Crack refers also to the chemical process of decomposing the crude oil into different petroleum products. As different variables affect the price of crude oil and its refined products, this has an implication for refining margins.

Implementation of a crack strategy

  • Single product crack: Differential of one barrel of crude with one barrel of refined product
  • Multi product crack: Use of different refined products to secure a margin

Trading the crack spread

  • Either long or short crack: If long crack, confident view that refinery margins will strengthen (either crude oil price decreasing or products demand increasing)
  • If short crack, confident view that refinery margins are worsening, either because crude oil price increase or decrease of products demand

Reading crack spread as market signal

  • If crack widens, refined products more expensive than crude oil price, market expects that crude oil price will increase (to tighten back the spread to historical norm)
  • If crack tightens, refined products are sold cheaper than the price of crude oil, market expects that refined products (will reduce production) in order to get more expensive to widen the spread

Why should I be interested in this post?

This post will help any student looking to break into the work of oil or energy trading, but more generally for any analyst position, to have a grasp of the main concepts and skills that are required in the market and have a better understanding of the energy industry.

Related posts on the SimTrade blog

   ▶ All posts about Professional experiences

   ▶ Youssef LOURAOUI My experience as a portfolio manager in a central bank

   ▶ Aastha DAS My experience during a summer internship as an investment banking analyst at G2 Capital Advisors

   ▶ Aamey MEHTA My experience as a credit analyst at Wells Fargo

Useful resources

Business Analysis

Petroineos

Financial Times (2022) Russia becomes India’s top oil supplier as sanctions deflate price.

About the author

The article was written in December 2022 by Youssef LOURAOUI (Bayes Business School, MSc. Energy, Trade & Finance, 2021-2022).